Hi,
I am trying to plot the 200 moving average of the hourly chart in higher timeframes; 4 hours chart for instance.
I have tried grapfhonprice as suggested in the example 2, but it is nt working; it claims:
https://www.prorealcode.com/documentation/graphonprice/
timeframe(4 hours)
mm7h4=average[7]
mm20h4=average[20]
mm50h4=average[50]
boluph4=BollingerUp[20](close)
boldnh4=BollingerDown[20](close)

timeframe(1 hour)
mm7h1=average[7]
mm20h1=average[20]
mm50h1=average[50]
boluph1=BollingerUp[20](close)
boldnh1=BollingerDown[20](close)

timeframe(default)
a = 0
if a>0 then
 buy at market
endif

// --- PLOT MTF INDICATORS ON PRICE CHART
//4 hours indis
graphonprice mm7h4 coloured(200,200,0)
graphonprice mm20h4 coloured(200,200,0)
graphonprice mm50h4 coloured(200,200,0)
graphonprice boluph4 coloured(200,200,0)
graphonprice boldnh4 coloured(200,200,0)
//1 hour indis
graphonprice mm7h1 coloured(0,200,0)
graphonprice mm20h1 coloured(0,200,0)
graphonprice mm50h1 coloured(0,200,0)
graphonprice boluph1 coloured(0,200,0)
graphonprice boldnh1 coloured(0,200,0)
//etc.
Thanks in advance for your help
It looks like it’s working fine on DAX, 30-minute TF.
Thanks Roberto,
Yoou are right, It wors fine in 30 minutes also and also in 1 hour timeframe but you get an error in 4 hours timeframe and daily timeframe.
Thanks n advance
What is the error you get in these timeframes please?
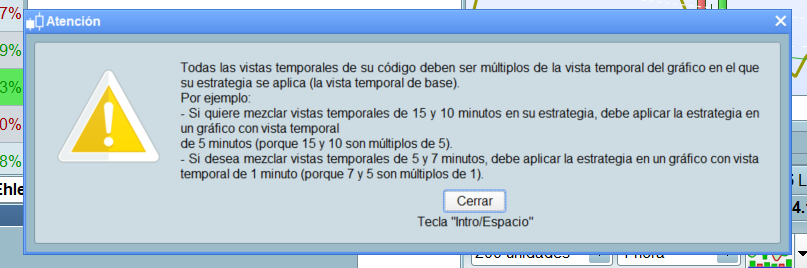
Attached you hace the error. Thanks
You get this error because you have to launch the strategy on the lowest timeframe declared by your TIMEFRAME instruction.
It’s because you use timeframes that are not multiple of the lowest one, that on the chart.
If you use, say, a 20-minute TF on the chart, then you cannot refer TF’s like 30 minutes in your code.
What TF’s did you use?
Thansks
I have just copied the example 2 that it claims:
4 hours and 1 hour indicators plotted on the current chart.
I is wotking in 30 minutes and 1 hour chart but it is not working in 4 hours and daily chart.
I would like to plot the 200 hourly average in four hours chart and daily charts. What I should change?
Many thanks
As it has already been said, MTF requires the lowest TF on the chart!
So, in this case you can use it on any TF <= 1 hour provided 1 hours and 4 houra are multiples. You cannot launch it from a 17-minute TF, because 1 hour (60 minutes) and 4 hours (240 minutes) are NOT multiple of 17.
You CANNOT use it on any TF higher than 1 hour, since this is the lowest TF you use in your strategy.
By the way, what use it a 1-hour and 4-hour MA on a Daily TF? It’s fine the other way round.
Thank you very much.
Now I understood perfectly the issue.
An yes, I would like to plot the SMA200 hourly in a 4 hours chart.
Is it possible?
Thanks
I am not sure you understood the issue, you CANNOT use a higher TF as default.
You can plot a 4h TF’s indicators on a 1h TF, not the other way round!
Moreover, what use would be doing the other way round?
Yes I understood.
And I would like the hourly plotted in the 4 hours chart because the hourly average is an important level.
It is impossible to do, but in case you could do that, every 4 hours you would like to plot a 1-hor MA, which hour would you like to be plotted, out of for? That of the first hour, the second hour, the third or the last hour?
If you are in front of your 4-hour chart and you plot on it the 1-h MA from 2 hours before, does that make sense.
The other way round is true, if you are taking a glance at your 1-hour chart you may want to also plot the 4-hour MA to see what the price and indicators on higher TF are doing.
I woud like to plot the 1 hour average as it is in the 1 hour graph.
I found in another post another solution for the RSI that I do not know if it can be changed to apply to the simple average, thanks for your help.
//higher timeframe minutes count
//HigherTFminutes = 60

//current timeframe minutes count
//CurrentTFminutes = 5

//RSI period to display
//RSIperiod = 14

if hour<>hour[1] then
c = close
endif

currentRSI = RSI[RSIperiod](close)

factor = ROUND(HigherTFminutes/CurrentTFminutes)


MTFRSI = RSI[RSIperiod*factor](c)


RETURN currentRSI as "current TF RSI", MTFRSI as "higher TF RSI"
Just open the 1-hour chart, then add a moving average.
Have you found difficulties in trying?