The GRAPHONPRICE instruction lets you display the values of variables you use in your ProBacktest program (“myvariable” in the example below) at the close of each bar on the price chart.
Syntax:
|
1 |
GRAPHONPRICE myvariable AS "my variable" |
It can be useful to monitor the levels of some variables in your program to better understand the program’s results. When a GRAPHONPRICE instruction is used in your code, the variable will appear on your price chart.
GRAPHONPRICE instructions can also be ‘coloured(R,G,B,alpha)’ like any other variable returned as a graphical object.
Example 1:
Plot indicators on chart directly from your ProBacktest program:
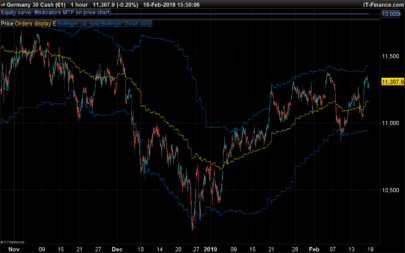
The below code will plot daily Bollinger Bands indicator on the default chart (the chart currently opened).
|
1 2 3 4 5 6 7 8 9 10 11 12 13 14 15 |
timeframe(daily) ema20daily = average[20,1] bolupdaily = BollingerUp[20](close) boldndaily = BollingerDown[20](close) timeframe(default) a = 0 if a>0 then buy at market endif // --- PLOT MTF INDICATORS ON PRICE CHART graphonprice ema20daily coloured(200,200,0) as "E" graphonprice bolupdaily coloured(0,200,0) as "Bollinger Up daily" graphonprice boldndaily coloured(0,200,0) as "Bollinger Down daily" |
Example 2:
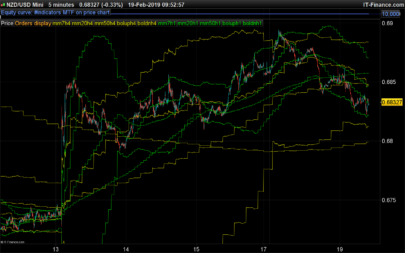
4 hours and 1 hour indicators plotted on the current chart:
|
1 2 3 4 5 6 7 8 9 10 11 12 13 14 15 16 17 18 19 20 21 22 23 24 25 26 27 28 29 30 31 32 33 34 |
timeframe(4 hours) mm7h4=average[7] mm20h4=average[20] mm50h4=average[50] boluph4=BollingerUp[20](close) boldnh4=BollingerDown[20](close) timeframe(1 hour) mm7h1=average[7] mm20h1=average[20] mm50h1=average[50] boluph1=BollingerUp[20](close) boldnh1=BollingerDown[20](close) timeframe(default) a = 0 if a>0 then buy at market endif // --- PLOT MTF INDICATORS ON PRICE CHART //4 hours indis graphonprice mm7h4 coloured(200,200,0) graphonprice mm20h4 coloured(200,200,0) graphonprice mm50h4 coloured(200,200,0) graphonprice boluph4 coloured(200,200,0) graphonprice boldnh4 coloured(200,200,0) //1 hour indis graphonprice mm7h1 coloured(0,200,0) graphonprice mm20h1 coloured(0,200,0) graphonprice mm50h1 coloured(0,200,0) graphonprice boluph1 coloured(0,200,0) graphonprice boldnh1 coloured(0,200,0) //etc. |
 GRAPHONPRICE

Je viens de découvrir ! Fonction génial pour compenser dans l’attente d’un mutli time frame temps réel. Merci pour le partage