Was trying to get this to work:
tradedollars = ((close/pipsize)*countofposition*pipvalue)-((tradeprice/pipsize)*countofposition*pipvalue)

graph highest[barindex](tradedollars)
Tradedollars works on its own – and I can graph it and it does what it should – but it won’t seem to graph the HIGHEST of this function.
Any clues why?
Thanks,
Finning
You should try with:
graph highest[max(1,barindex)](tradedollars)
or with:
hh = max(hh,tradedollars)
graph hh
This sort of thing often happens to me – it is probably due to trying to find HIGHEST[0] when BARINDEX = 0.
Try this instead – not tested:
tradedollars = ((close/pipsize)*countofposition*pipvalue)-((tradeprice/pipsize)*countofposition*pipvalue)

maxtradedollars = max(tradedollars,maxtradedollars)

graph maxtradedollars
Hi Nicolas,
thanks for your reply.
I just tried both codes, and both don’t return/graph anything.
Try this (not tested):
tradedollars = ((close/pipsize)*countofposition*pipvalue)-((tradeprice/pipsize)*countofposition*pipvalue)

if barindex > 0 then
maxtradedollars = max(tradedollars,maxtradedollars)
endif

graph maxtradedollars
Which Prorealtime version please?
Hi Vonasi,
thanks for your reply.
I just tried your code, and it didn’t work either.
Putting the “graph” right at the bottom of the code too with nothing under it.
Just not returning anything, not even a zero.
A graph value line doesn’t even com up in the cursor details box.
Hi Vonasi,
just read your second code and tried it – the second code comes up in the cursor window as maxtradedollars – however the value doesn’t change from zero at any stage.
Nicolas,
I am currently running v 10.3 – 1.8.0_45
Thanks
But it should work! Proceed in order:
- use one of our snippet in another code (basic one) on the same instrument
- if 1/ doesnt work, try another instrument and timeframe
- if 2/ doesnt work, relaunch platform
- retry
- give feedback here
Hi Nicolas,
I can’t do everything right now – but I’ll give you some quick feedback:
I have been working on AUDUSD $1 weekly timeframe – where I have had my initial problem.
Just retried the complete code from #113798 on my initial code and I can confirm that it didn’t work – it only showed a zero the whole time.
So as for point #1
I tried this code below on my target market the AUDUSD $1 weekly timeframe
If date = 20000102 then
buy 1 contract at market
endif

If date = 2000131 then
sell at market
endif


tradedollars = ((close/pipsize)*countofposition*pipvalue)-((tradeprice/pipsize)*countofposition*pipvalue)

if barindex > 0 then
maxtradedollars = max(tradedollars,maxtradedollars)
endif

graph maxtradedollars
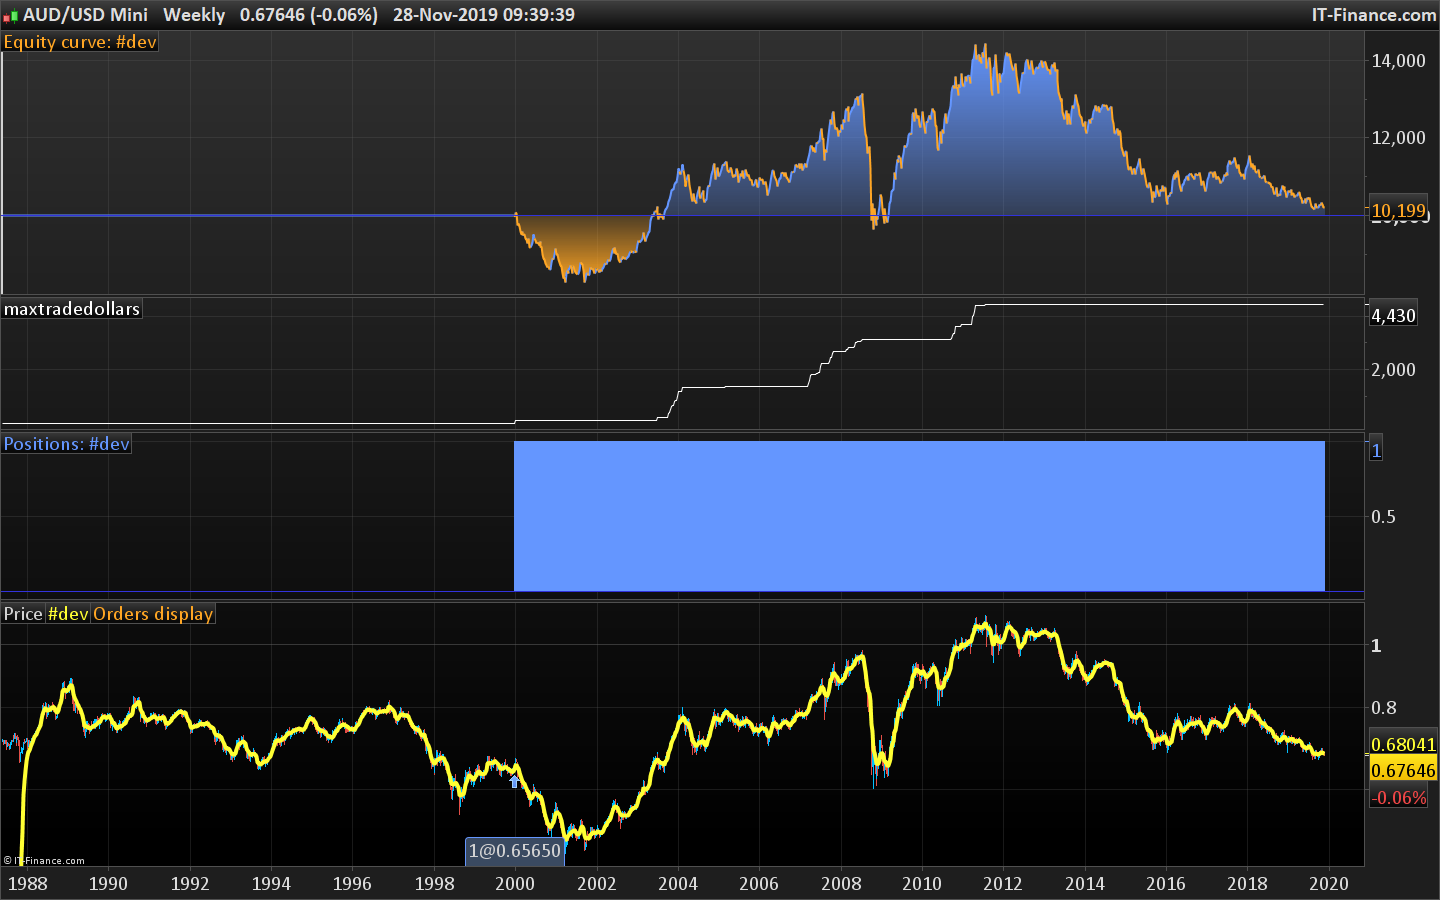
and I still got a constant zero value from the maxtradedollars graph – see attached picture.
I’ll work my way through the other points ASAP and get back to you.
Thanks,
Finning
It works for me for AUDUSD mini, not with AUDUSD .. with this code:
If date >= 20020102 and not longonmarket then
buy 1 contract at market
endif

//If date = 2000131 then
//sell at market
//endif

tradedollars = ((close/pipsize)*countofposition*pipvalue)-((tradeprice/pipsize)*countofposition*pipvalue)

if barindex > 0 then
maxtradedollars = max(tradedollars,maxtradedollars)
endif

graph maxtradedollars
I’ll make a report.
Hi Nicolas,
yes I was using the mini market/$1 market too.
I’ll restart my platform just to check that its not the problem either.
Thanks,
Finning
PS – restart didn’t help.
The problem is identified and will be fixed. In the meantime, you can change the code with:
If date >= 20020102 and not longonmarket then
buy 1 contract at market
endif

//If date = 2000131 then
//sell at market
//endif

tradedollars = ((close/pipsize)*countofposition*pipvalue)-((tradeprice/pipsize)*countofposition*pipvalue)

if tradeindex > 0 then
 maxtradedollars = max(tradedollars,maxtradedollars)
endif

graph maxtradedollars
It should work.
Hi Nicolas,
thanks for chasing that up!
Yes the last bit of code that you wrote with the tradeindex>0 did work – so I have something that I can use now.
Thanks for getting this to work,
Finning