Hi Everyone, just joined this forum today and would really appreciate your help.
I tried to make my own stock screener on PRT- I use this screener on StockCharts everyday but need it now on PRT but am struggling.
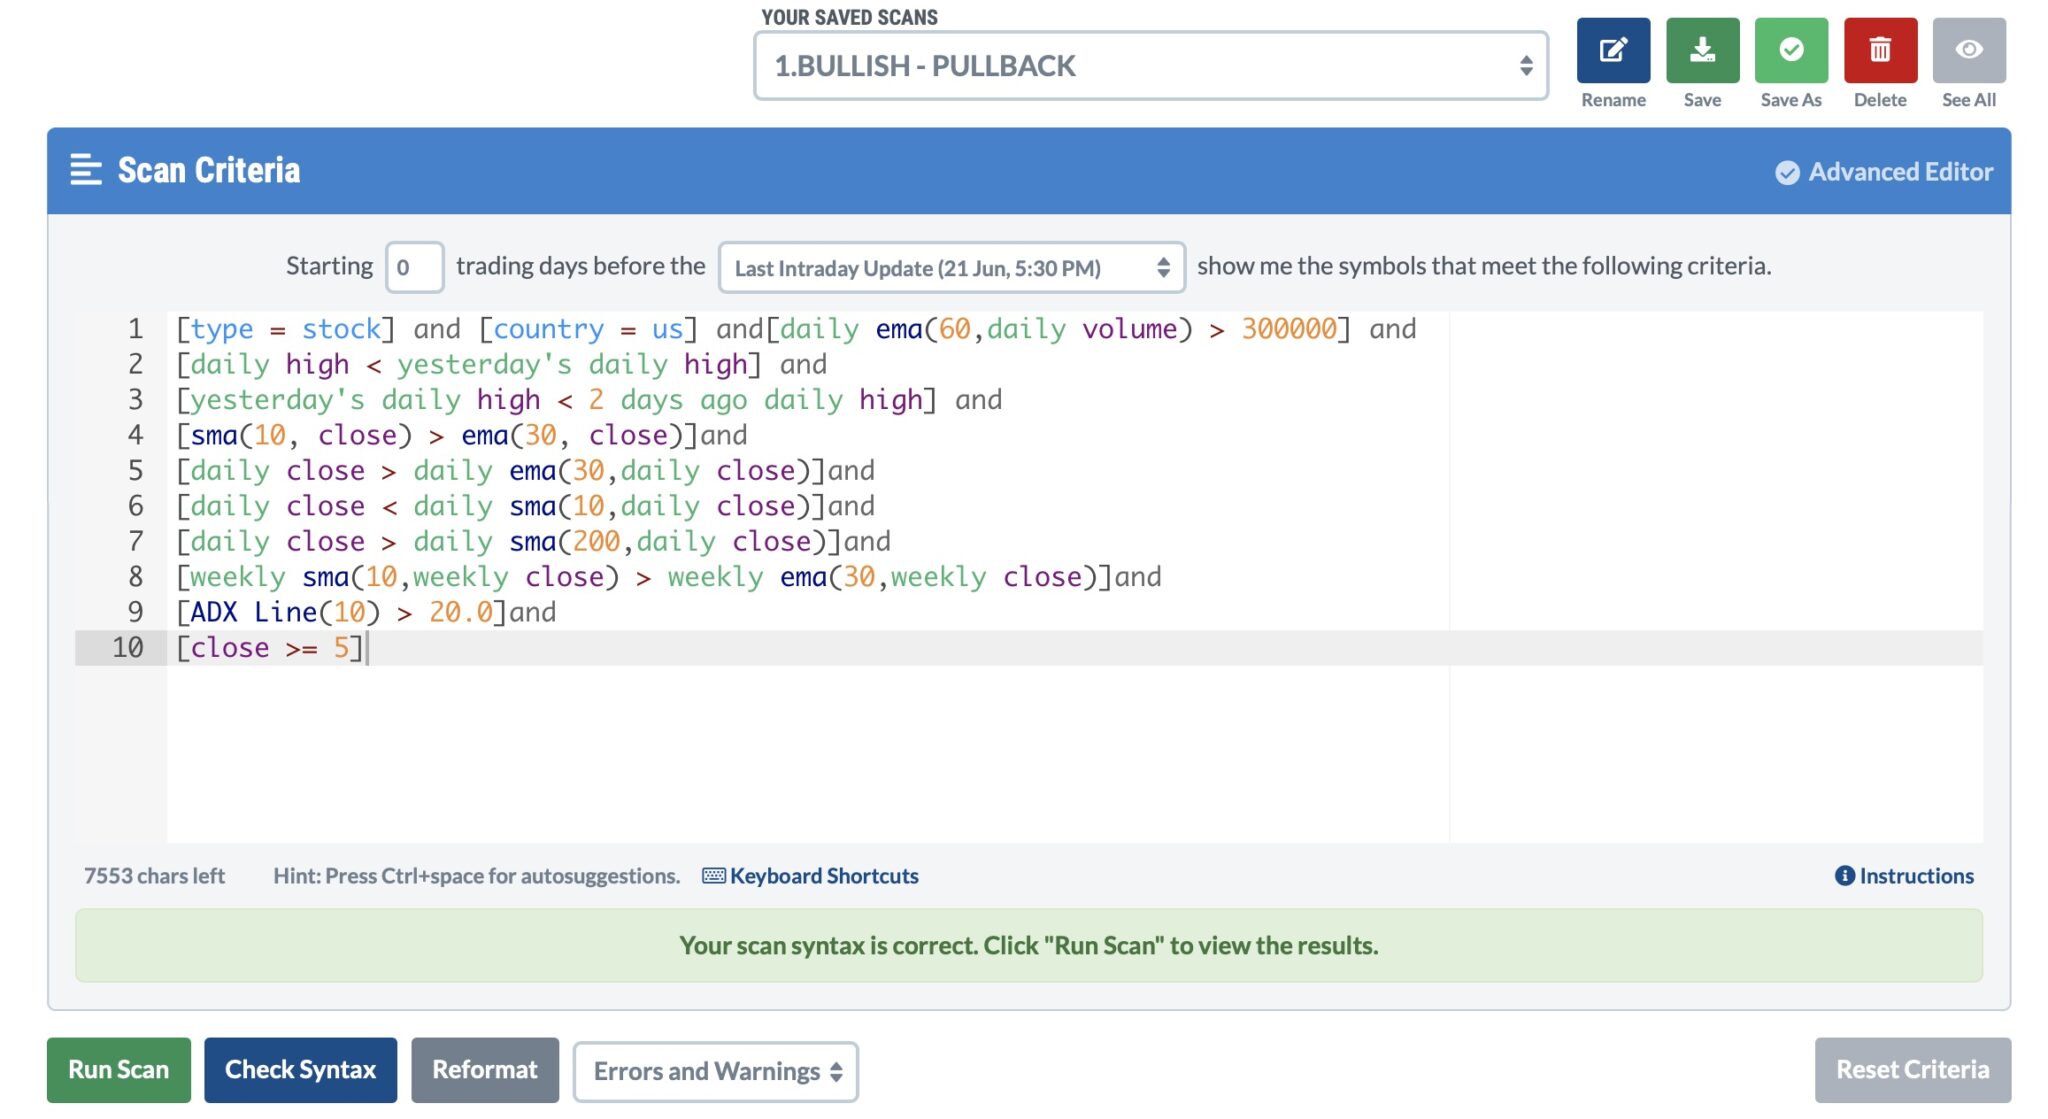
Below I attached the StockCharts Screener Coding.
Below is PRT’s ProScreener’s data or coding which does not seem to work as no Stock Charts is being selected:
I understand I must use the <b>Insert PRT Code </b>button when putting code in my message but the button was there when I started but was just gone when I needed it- damn.
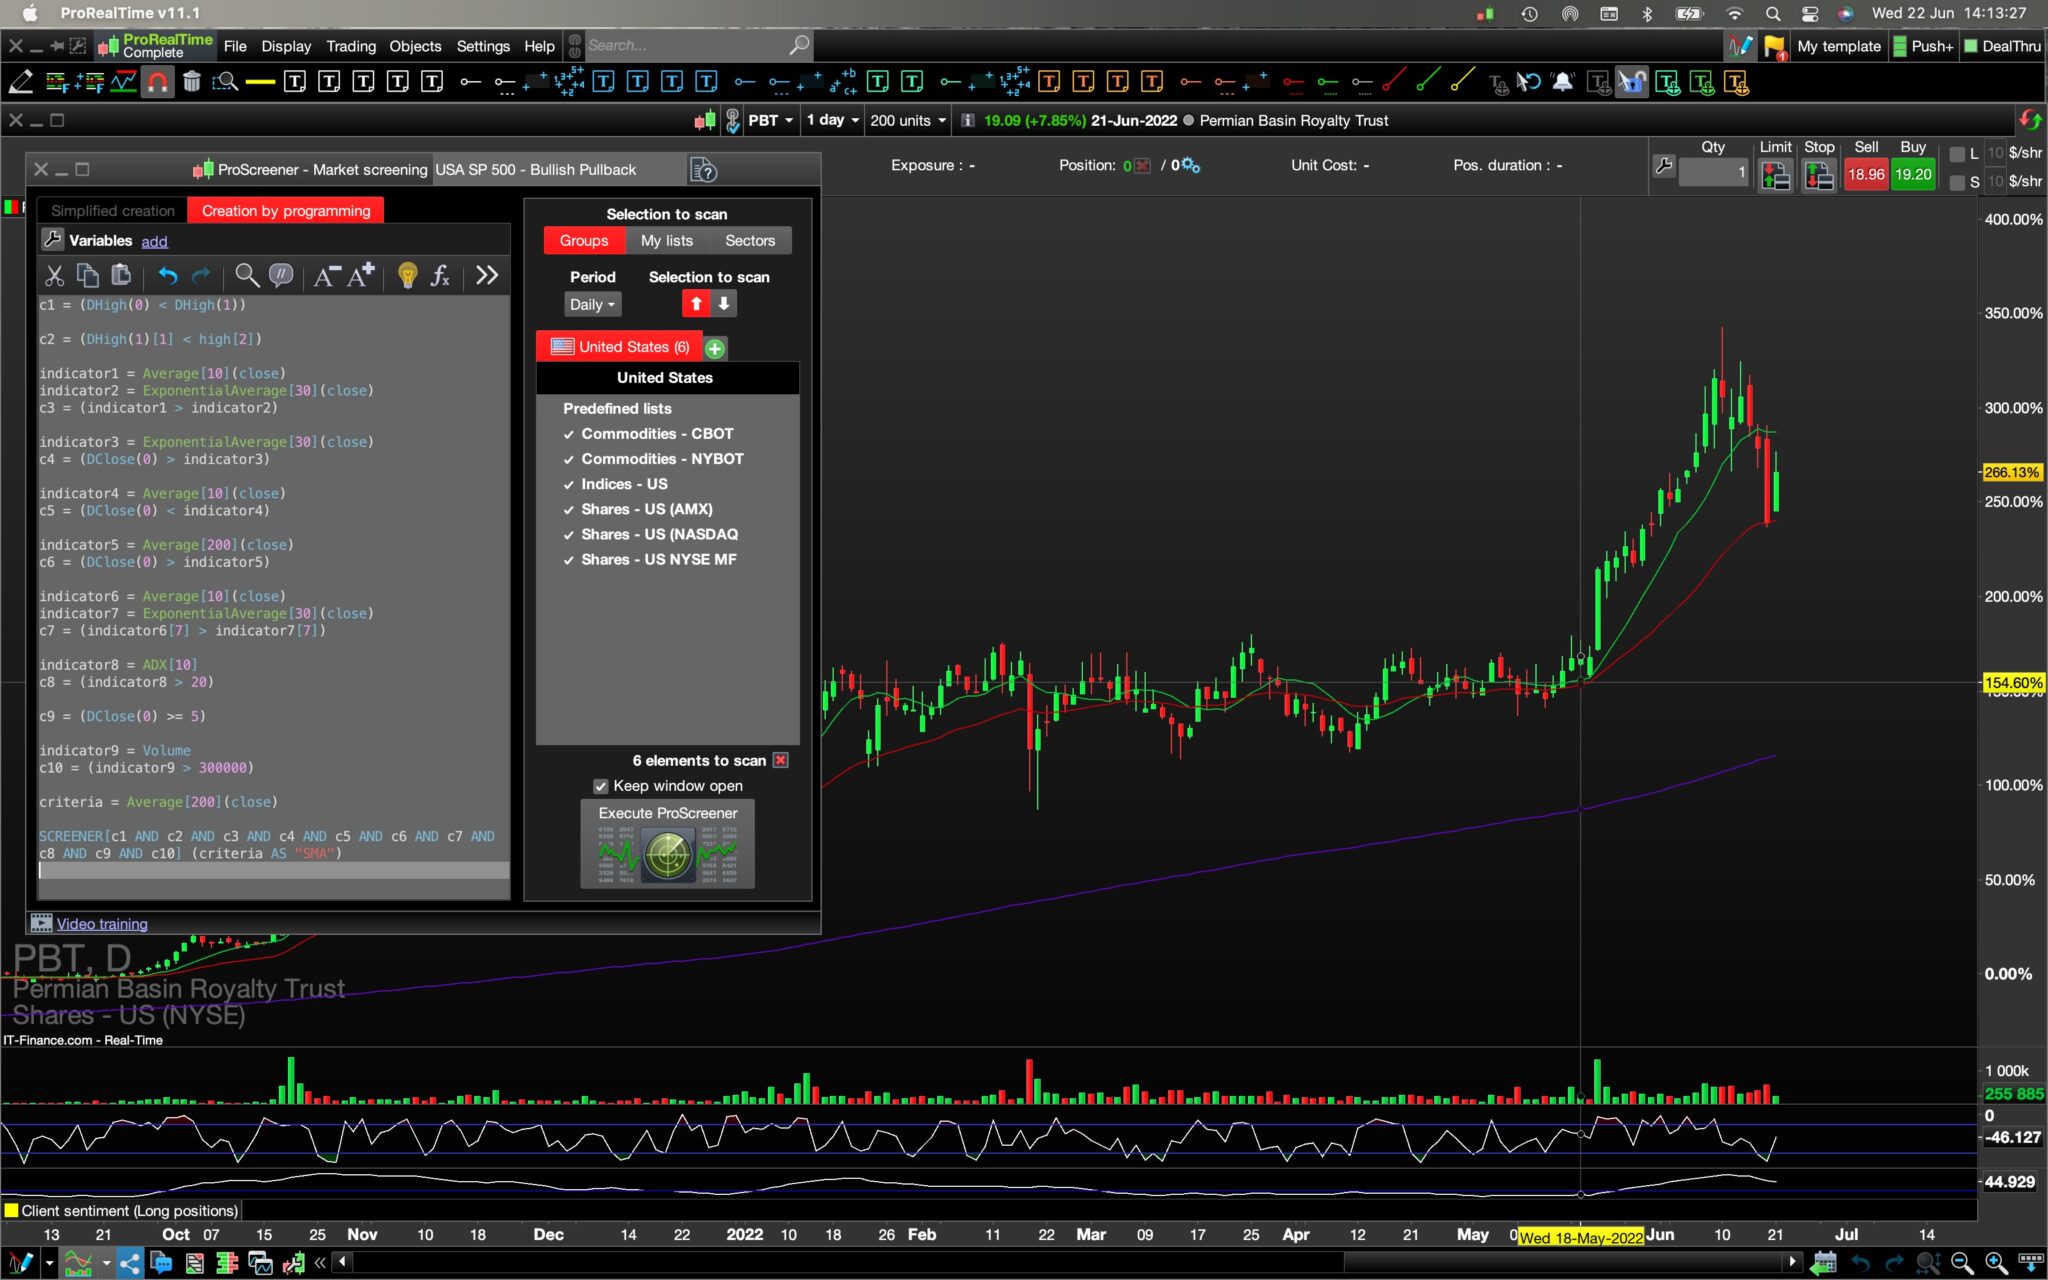
Below is another screenshot of the ProScreener Coding on PRT and also an example of a stockchart (PBT) in the background of the charts I would like the Screener to find for me.
Below is also a copied version of the Screener:
<p style=”padding-left: 40px;”><span style=”color: #0000ff;”>c1 = (DHigh(0) < DHigh(1))</span></p>
<p style=”padding-left: 40px;”><span style=”color: #0000ff;”>c2 = (DHigh(1)[1] < high[2])</span></p>
<p style=”padding-left: 40px;”><span style=”color: #0000ff;”>indicator1 = Average[10](close)</span>
<span style=”color: #0000ff;”>indicator2 = ExponentialAverage[30](close)</span>
<span style=”color: #0000ff;”>c3 = (indicator1 > indicator2)</span></p>
<p style=”padding-left: 40px;”><span style=”color: #0000ff;”>indicator3 = ExponentialAverage[30](close)</span>
<span style=”color: #0000ff;”>c4 = (DClose(0) > indicator3)</span></p>
<p style=”padding-left: 40px;”><span style=”color: #0000ff;”>indicator4 = Average[10](close)</span>
<span style=”color: #0000ff;”>c5 = (DClose(0) < indicator4)</span></p>
<p style=”padding-left: 40px;”><span style=”color: #0000ff;”>indicator5 = Average[200](close)</span>
<span style=”color: #0000ff;”>c6 = (DClose(0) > indicator5)</span></p>
<p style=”padding-left: 40px;”><span style=”color: #0000ff;”>indicator6 = Average[10](close)</span>
<span style=”color: #0000ff;”>indicator7 = ExponentialAverage[30](close)</span>
<span style=”color: #0000ff;”>c7 = (indicator6[7] > indicator7[7])</span></p>
<p style=”padding-left: 40px;”><span style=”color: #0000ff;”>indicator8 = ADX[10]</span>
<span style=”color: #0000ff;”>c8 = (indicator8 > 20)</span></p>
<p style=”padding-left: 40px;”><span style=”color: #0000ff;”>c9 = (DClose(0) >= 5)</span></p>
<p style=”padding-left: 40px;”><span style=”color: #0000ff;”>indicator9 = Volume</span>
<span style=”color: #0000ff;”>c10 = (indicator9 > 300000)</span></p>
<p style=”padding-left: 40px;”><span style=”color: #0000ff;”>criteria = Average[200](close)</span></p>
<p style=”padding-left: 40px;”><span style=”color: #0000ff;”>SCREENER[c1 AND c2 AND c3 AND c4 AND c5 AND c6 AND c7 AND c8 AND c9 AND c10] (criteria AS “SMA”)</span></p>
If possible, Please help me to figure out what I did wrong and how I can fix it.
Thank you in advance and hope you are having a nice day.
c1 = (DHigh(0) < DHigh(1))

c2 = (DHigh(1)[1] < high[2])

indicator1 = Average[10](close)
indicator2 = ExponentialAverage[30](close)
c3 = (indicator1 > indicator2)

indicator3 = ExponentialAverage[30](close)
c4 = (DClose(0) > indicator3)

indicator4 = Average[10](close)
c5 = (DClose(0) < indicator4)

indicator5 = Average[200](close)
c6 = (DClose(0) > indicator5)

indicator6 = Average[10](close)
indicator7 = ExponentialAverage[30](close)
c7 = (indicator6[7] > indicator7[7])

indicator8 = ADX[10]
c8 = (indicator8 > 20)

c9 = (DClose(0) >= 5)

indicator9 = Volume
c10 = (indicator9 > 300000)

criteria = Average[200](close)

SCREENER[c1 AND c2 AND c3 AND c4 AND c5 AND c6 AND c7 AND c8 AND c9 AND c10] (criteria AS "SMA")
Hallo everyone again, I figured it out how to do the ‘Insert PRT Code’ as you can see above, any help will be appreciated.
Have a nice day
The the ‘Insert PRT Code’ as you can see above is available switching from VISUAL to TEXT mode (on the top right corner of this text window).
Please do not embed pics in your post, as this slows down loading the pages. Attaching them with the SELECT FILE button is fine.
Hay Robert,
Thanks for the reply, I appreciate it.
Yes I figured the ‘Insert PRT Code’ out seconds after I posted my first message- haha. Thanks though for the help.
I will do as you asked in the future by not embedding the pics, Thanks for the heads up.
Will you be able to help me with my problem or am I still on standby?
Hope you have a nice evening.
Are you using it on a Daily chart?
Hi Robert,
Yes, I am using it on a Daily chart.
good evening, remove C9 and C10 and do a test
Good evening, thanks for the reply, I will remove those two lines and post an update.
c1 = (DHigh(0) < DHigh(1))

c2 = (DHigh(1)[1] < high[2])

indicator1 = Average[10](close)
indicator2 = ExponentialAverage[30](close)
c3 = (indicator1 > indicator2)

indicator3 = ExponentialAverage[30](close)
c4 = (DClose(0) > indicator3)

indicator4 = Average[10](close)
c5 = (DClose(0) < indicator4)

indicator5 = Average[200](close)
c6 = (DClose(0) > indicator5)

indicator6 = Average[10](close)
indicator7 = ExponentialAverage[30](close)
c7 = (indicator6[7] > indicator7[7])

indicator8 = ADX[10]
c8 = (indicator8 > 20)

criteria = Average[200](close)

SCREENER[c1 AND c2 AND c3 AND c4 AND c5 AND c6 AND c7 AND c8] (criteria AS "SMA")
Hallo once again <span class=”bbp-author-name”>fifi743</span>,
I did remove C9 and C10 as requested and as you can see above.
ProScreener still came out empty handed with no charts selected- this was after a search in all the Predefined Lists under the USA.
If you have any other ideas, please let me know as I am all ears.
Thanks again for your help and time.
good evening, I have reorganized the code.
and there was a writing error on line 3
c1 = (DHigh(0) < DHigh(1))

c2 = (DHigh(1) < high[2])

indicator1 = Average[10](close)
indicator2 = ExponentialAverage[30](close)
indicator3 = ExponentialAverage[30](close)
indicator5 = Average[200](close)
c3 = (indicator1 > indicator2)
c4 = (DClose(0) > indicator3)
c5 = (DClose(0) < indicator1)
c6 = (DClose(0) > indicator5)
c7 = (indicator1[7] > indicator2[7])
indicator8 = ADX[10]
c8 = (indicator8 > 20)

criteria = indicator5

SCREENER[c1 AND c2 AND c3 AND c4 AND c5 AND c6 AND c7 AND c8] (criteria AS "SMA")
Good evening <span class=”bbp-author-name”>fifi743</span>
You are a rockstar, thank you for trying to help me, I appreciate it immensely, I honestly thought that no one will get back to me again and that I am on my own- that is usually how it goes on most of these sights- so once again ‘THANKS’
Remember you asked me to take out c9 and c10 and test it- so I think you worked off or reorganised the code without c9 and c10 (if you look further up you’ll see the full code) Do you think I can just ad c9 and c10 at the end of your reorganised coding? Below is a copied version of c9 and c10.
c9 = (DClose(0) >= 5)
indicator9 = Volume
c10 = (indicator9 > 300000)
Can’t wait to try your reorganised coding- will keep you up to date.
Looking forward hearing from you.
Cheers mate, have a good evening.
Hey Fifi,
You are a legend buddy- it worked and I got 13 hits out of your reorganised coding version- in todays market or since the beginning of this year is 13 hits not bad I reckon.
I will try to ad lines c9/c10 in a bit and take it for a test drive- will keep you posted.
Seriously- Legend man- That’s you- Thanks again.
Good morning,
yes you can add C9 and C10