Thanks very much @RobertoGozzi and @Nicolas, works very well. Better than Standard Deviation variances and Moving Average Distributions entries.
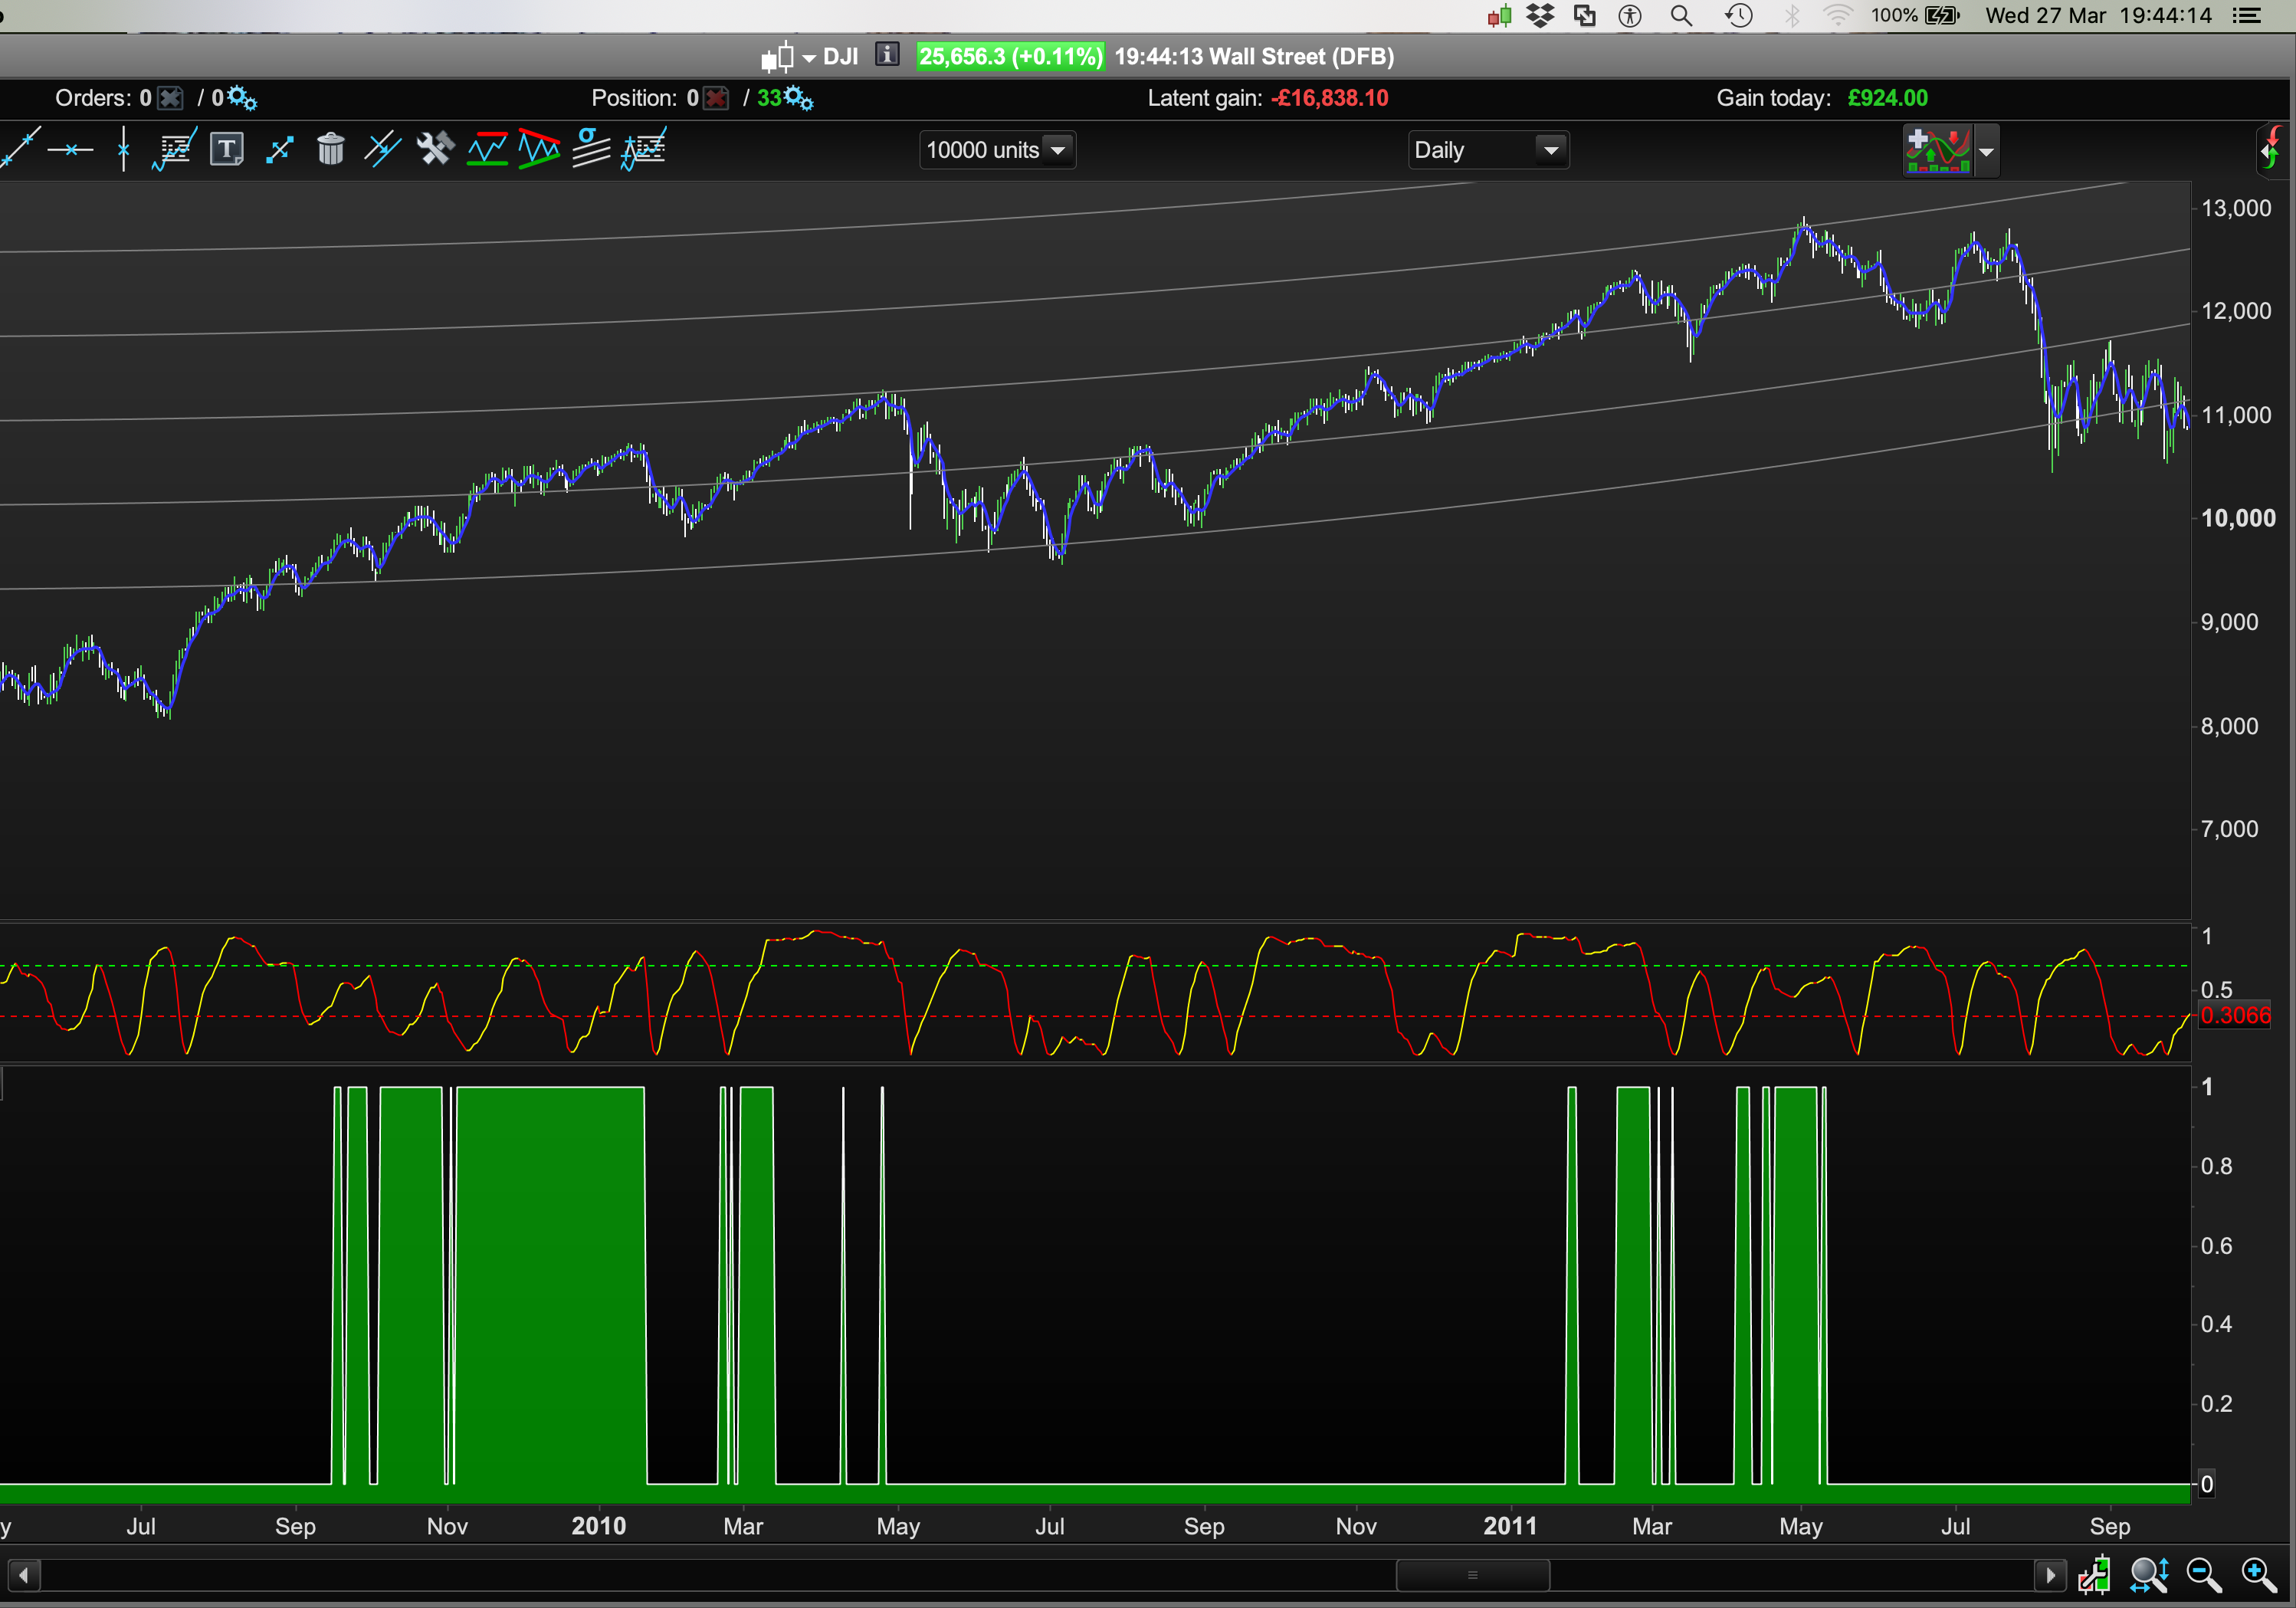
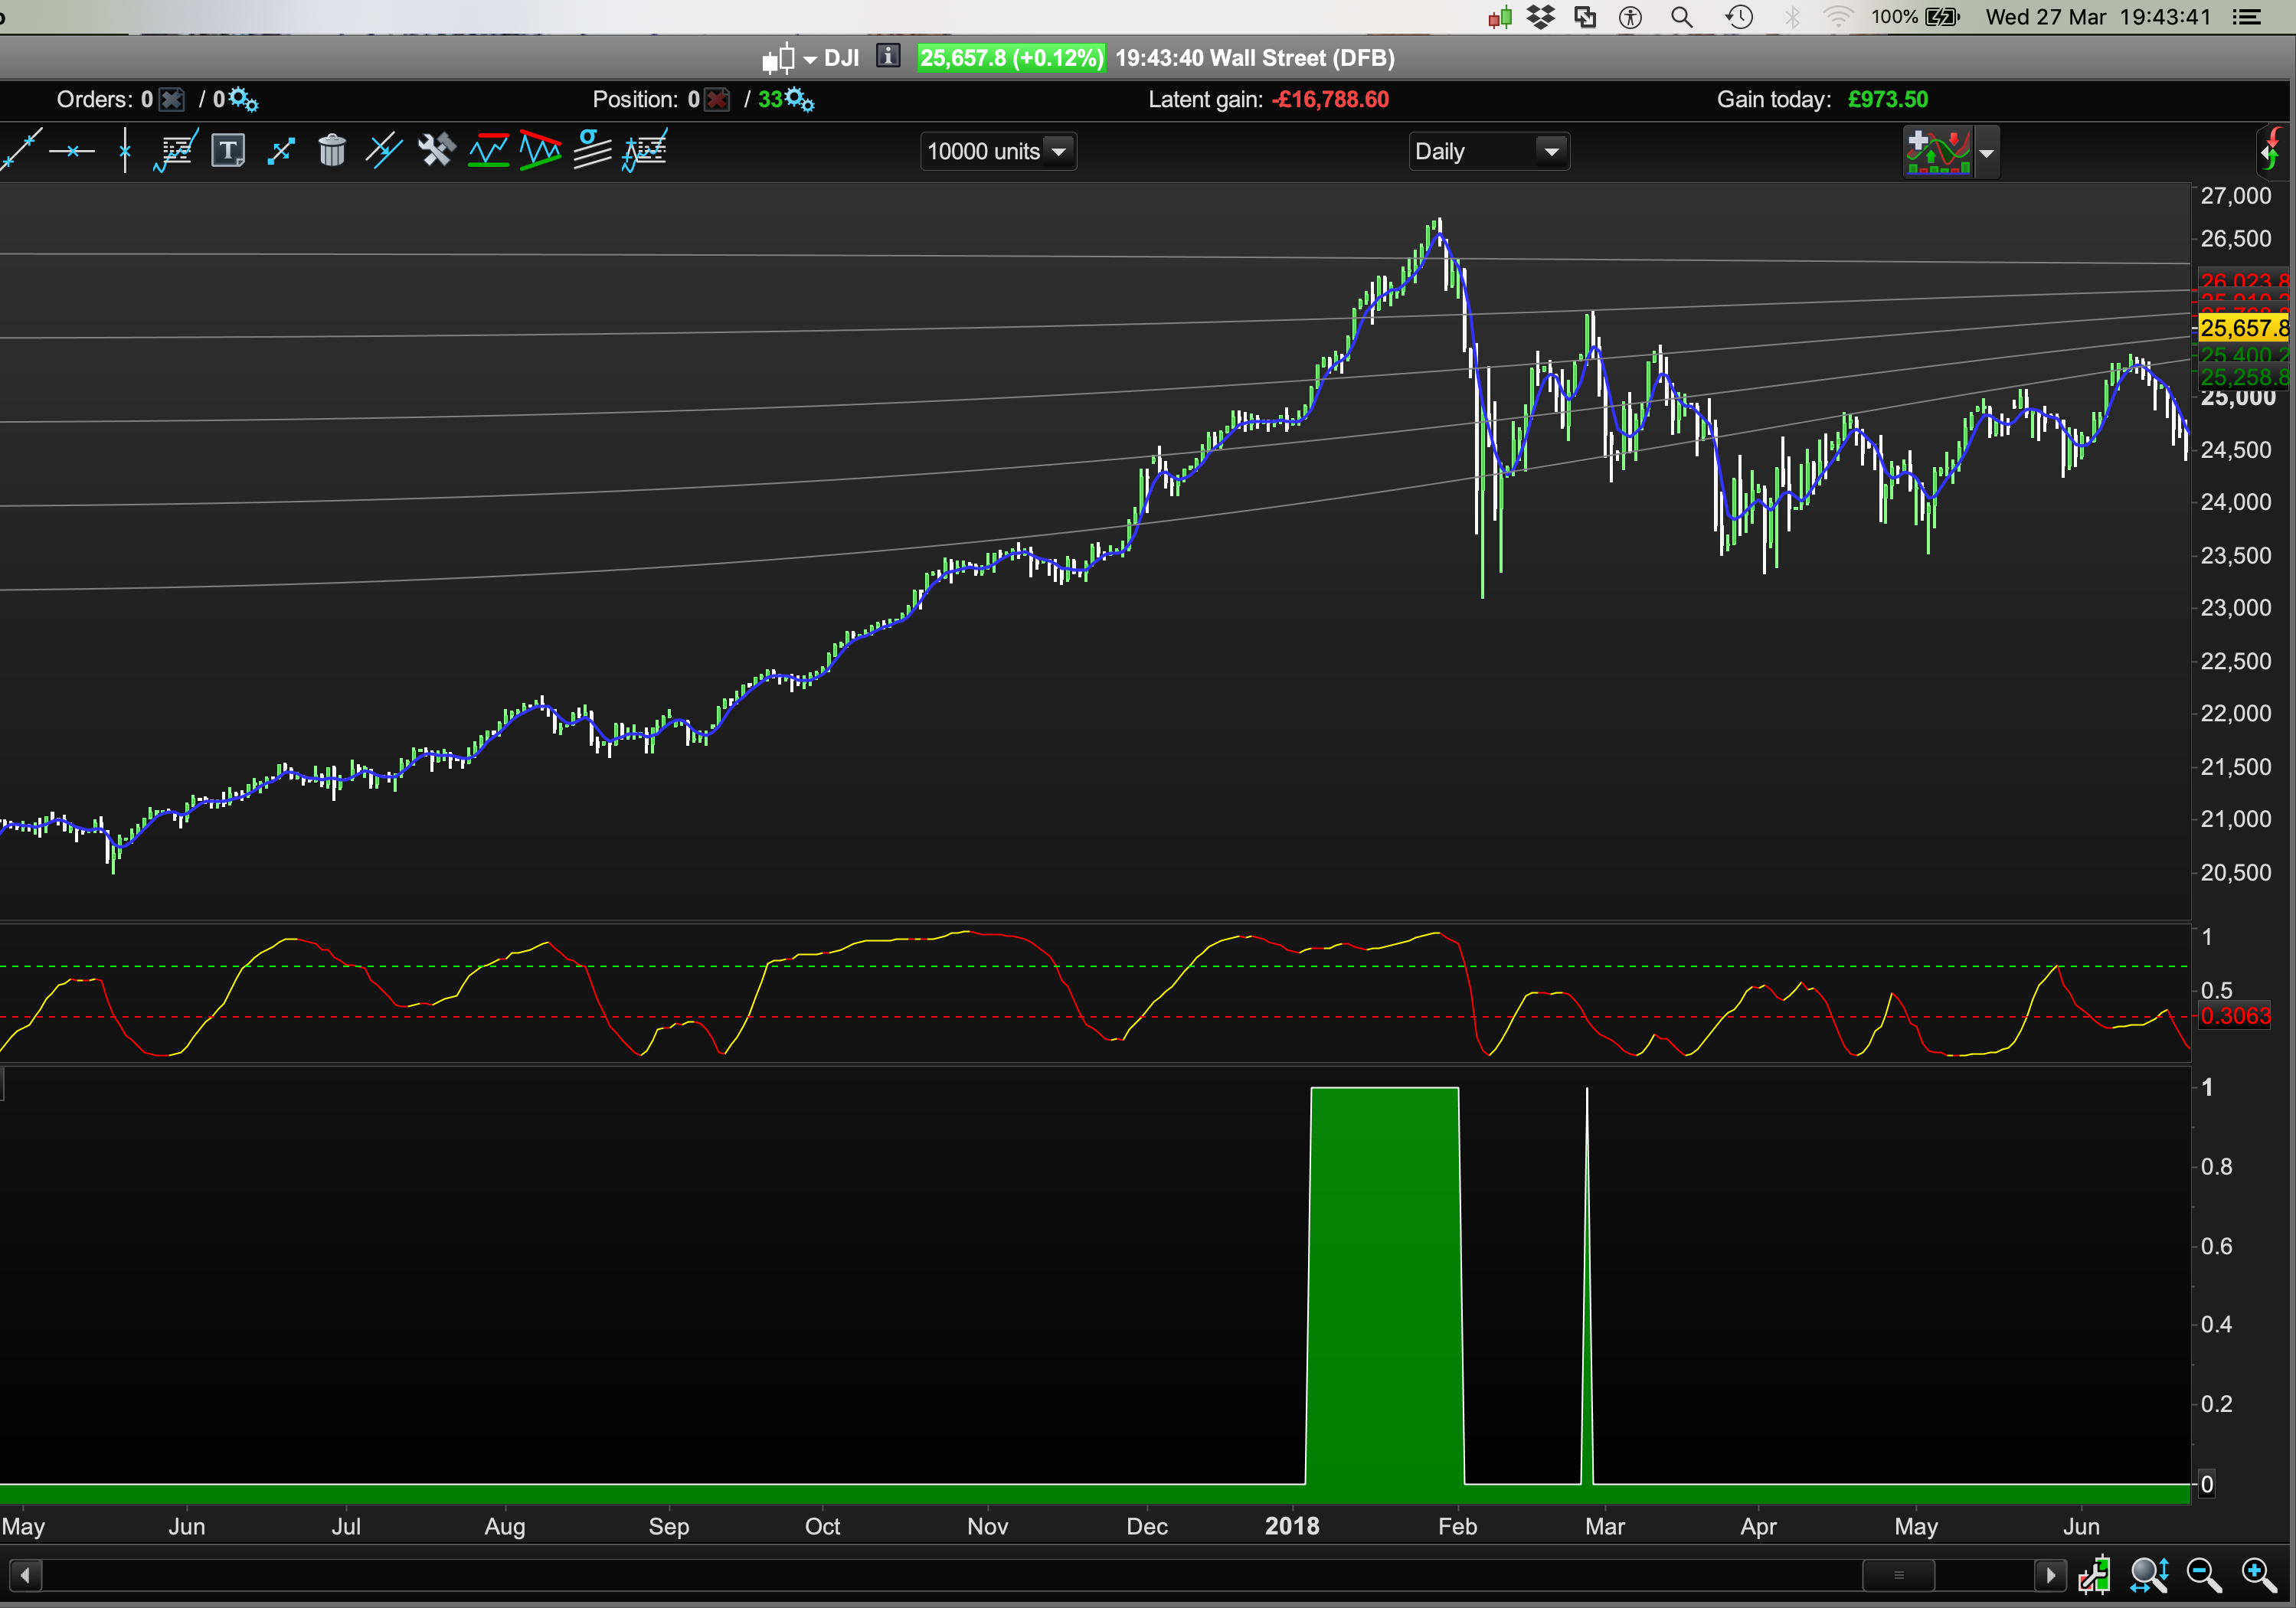
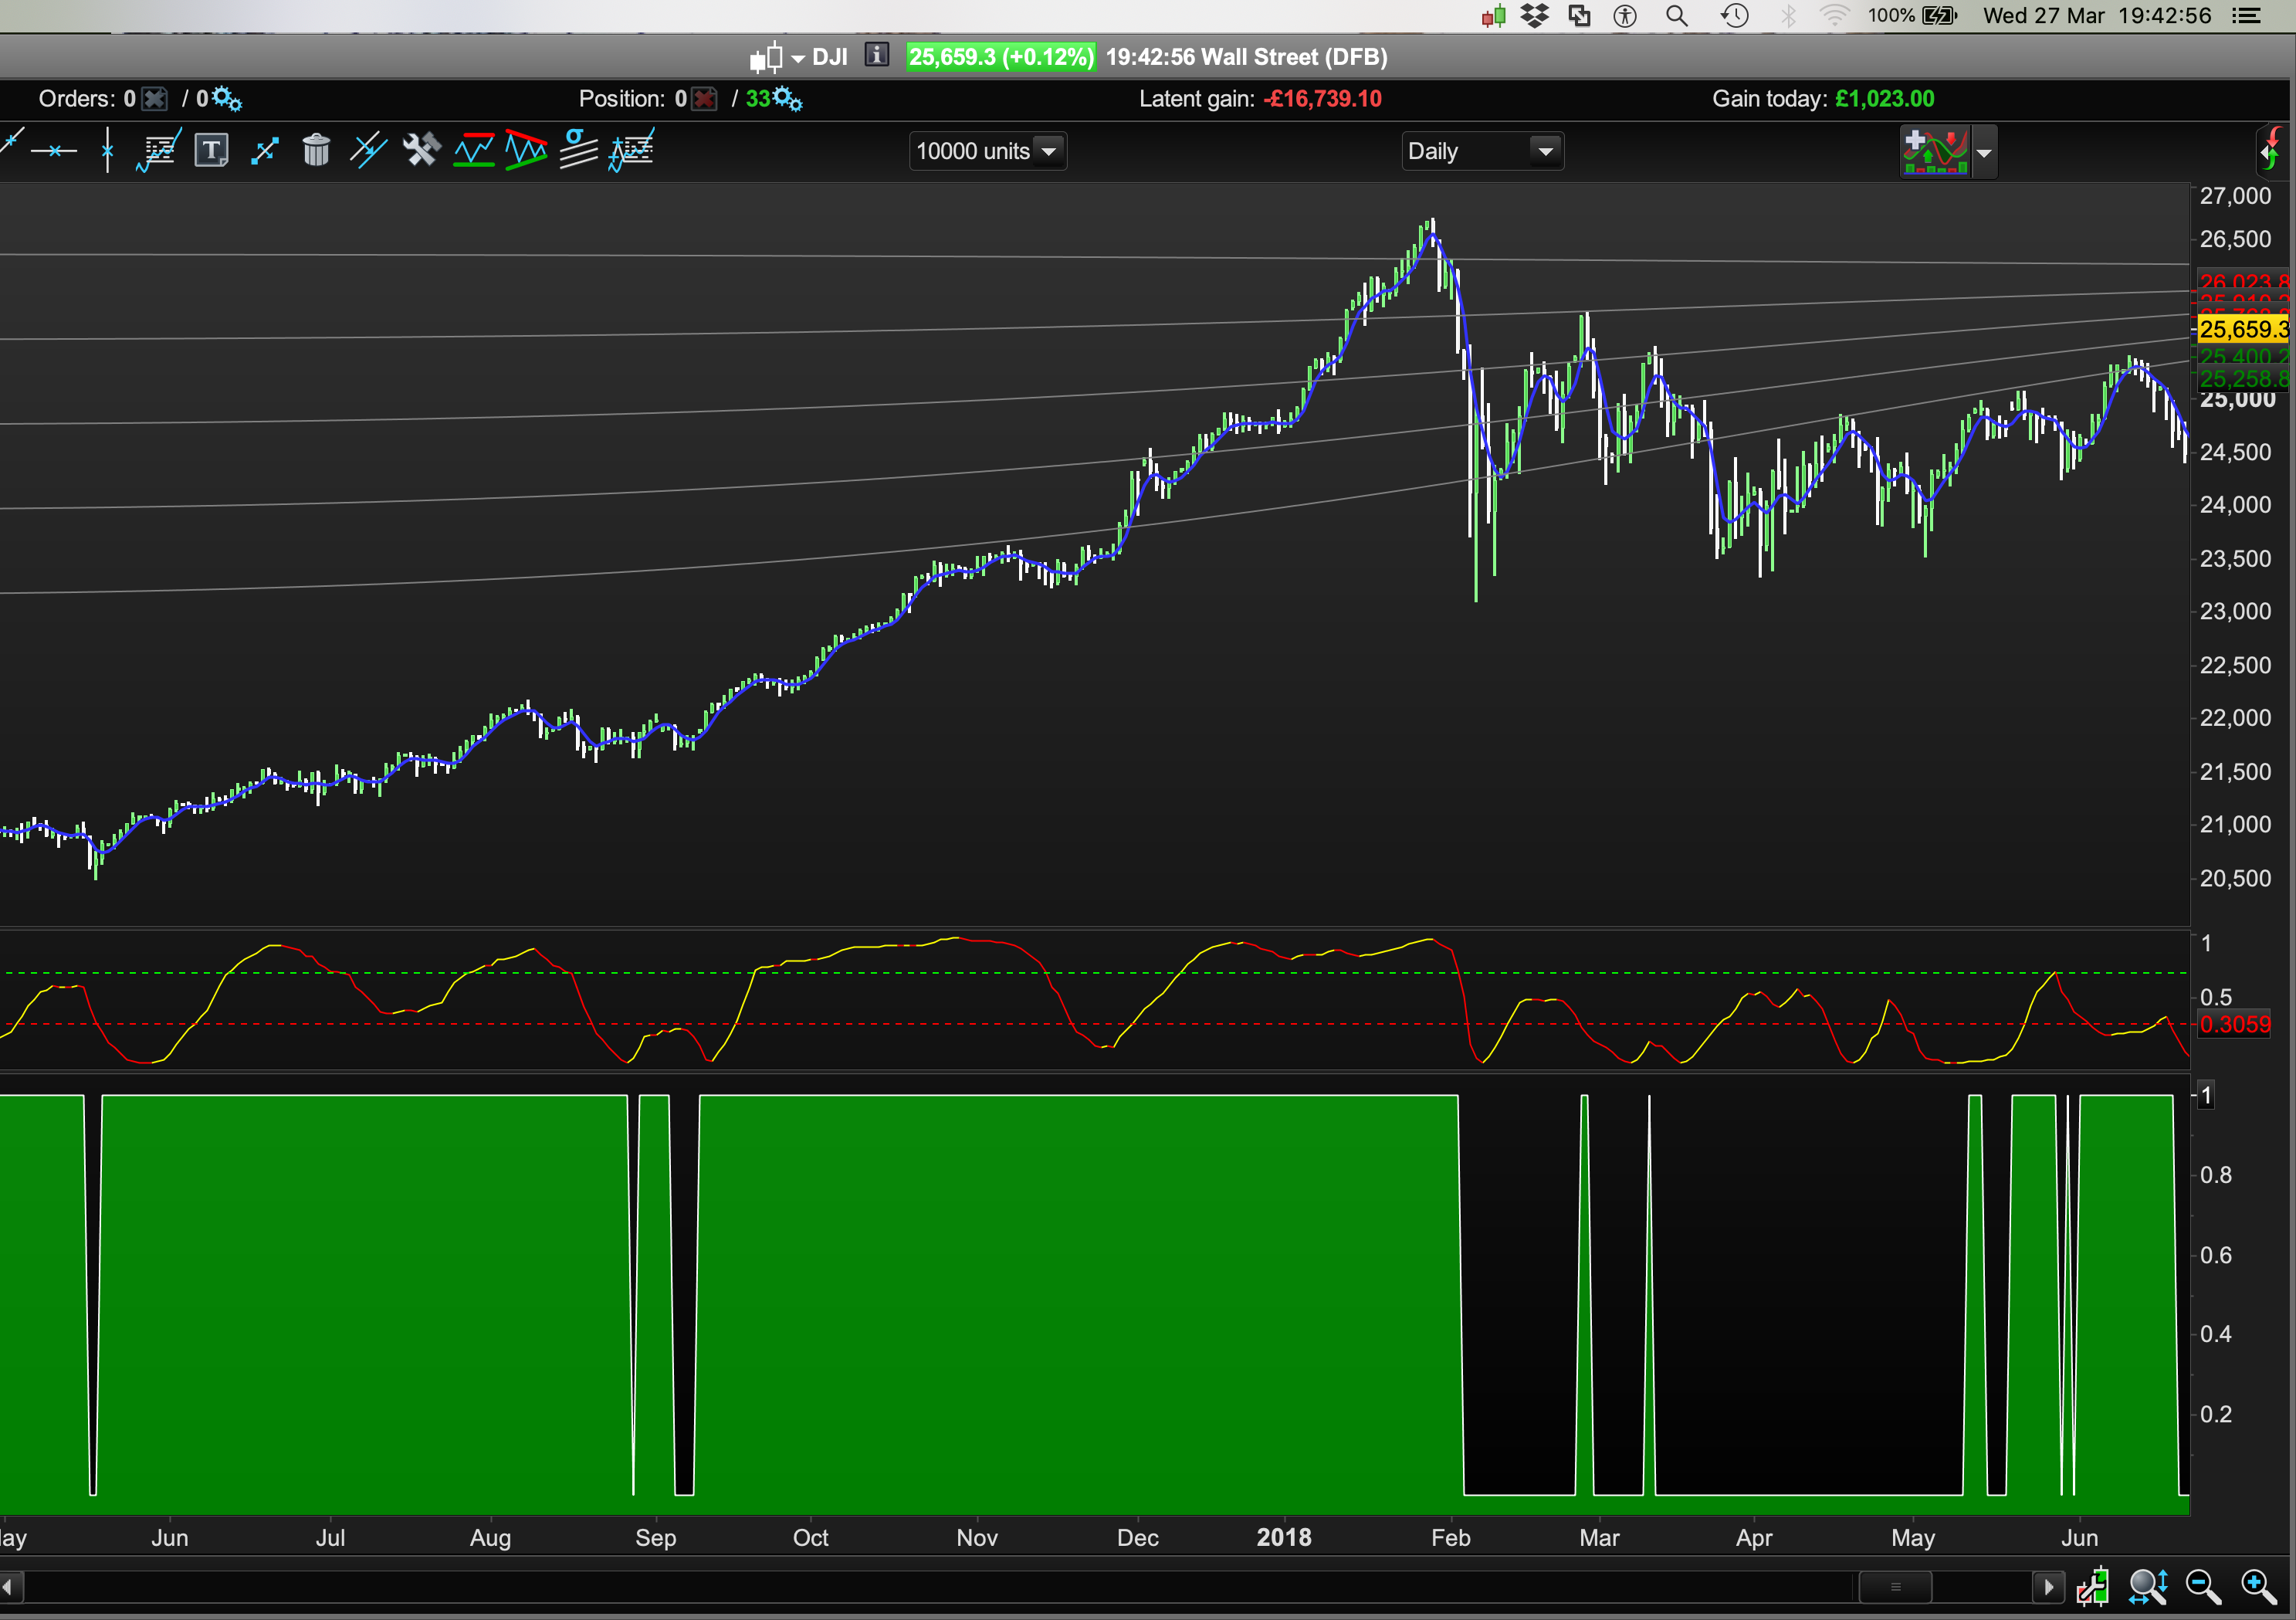
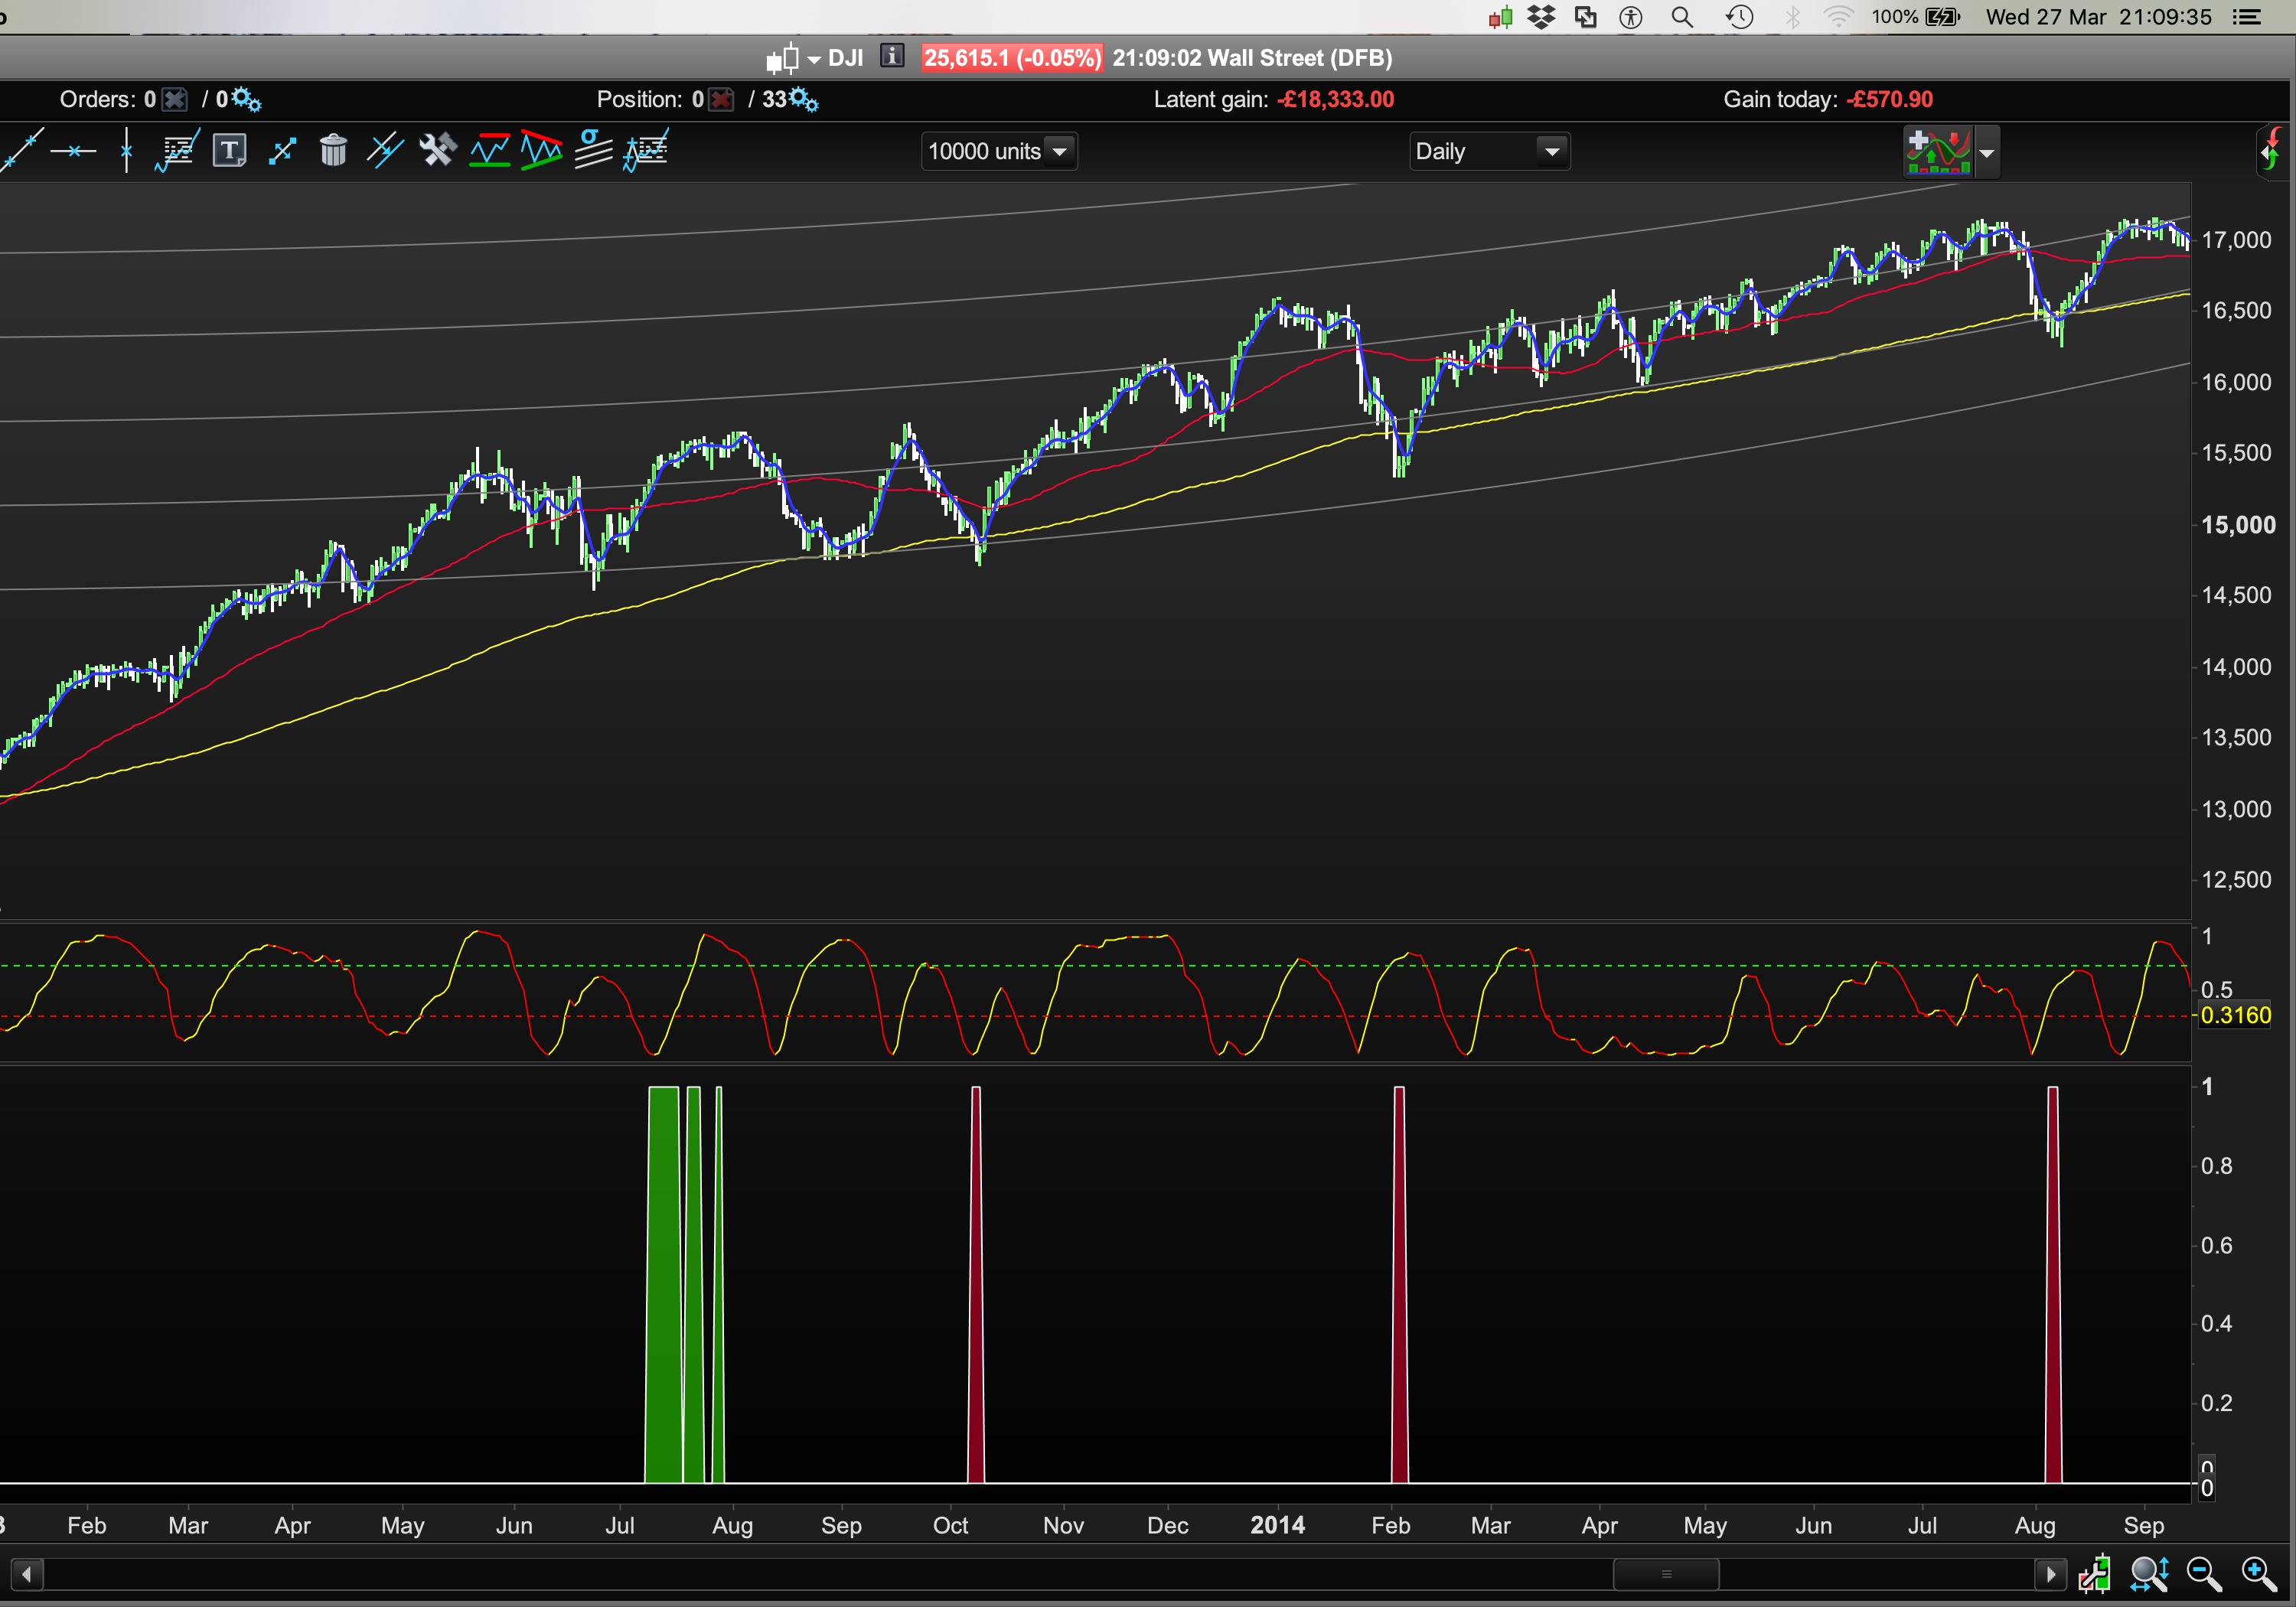
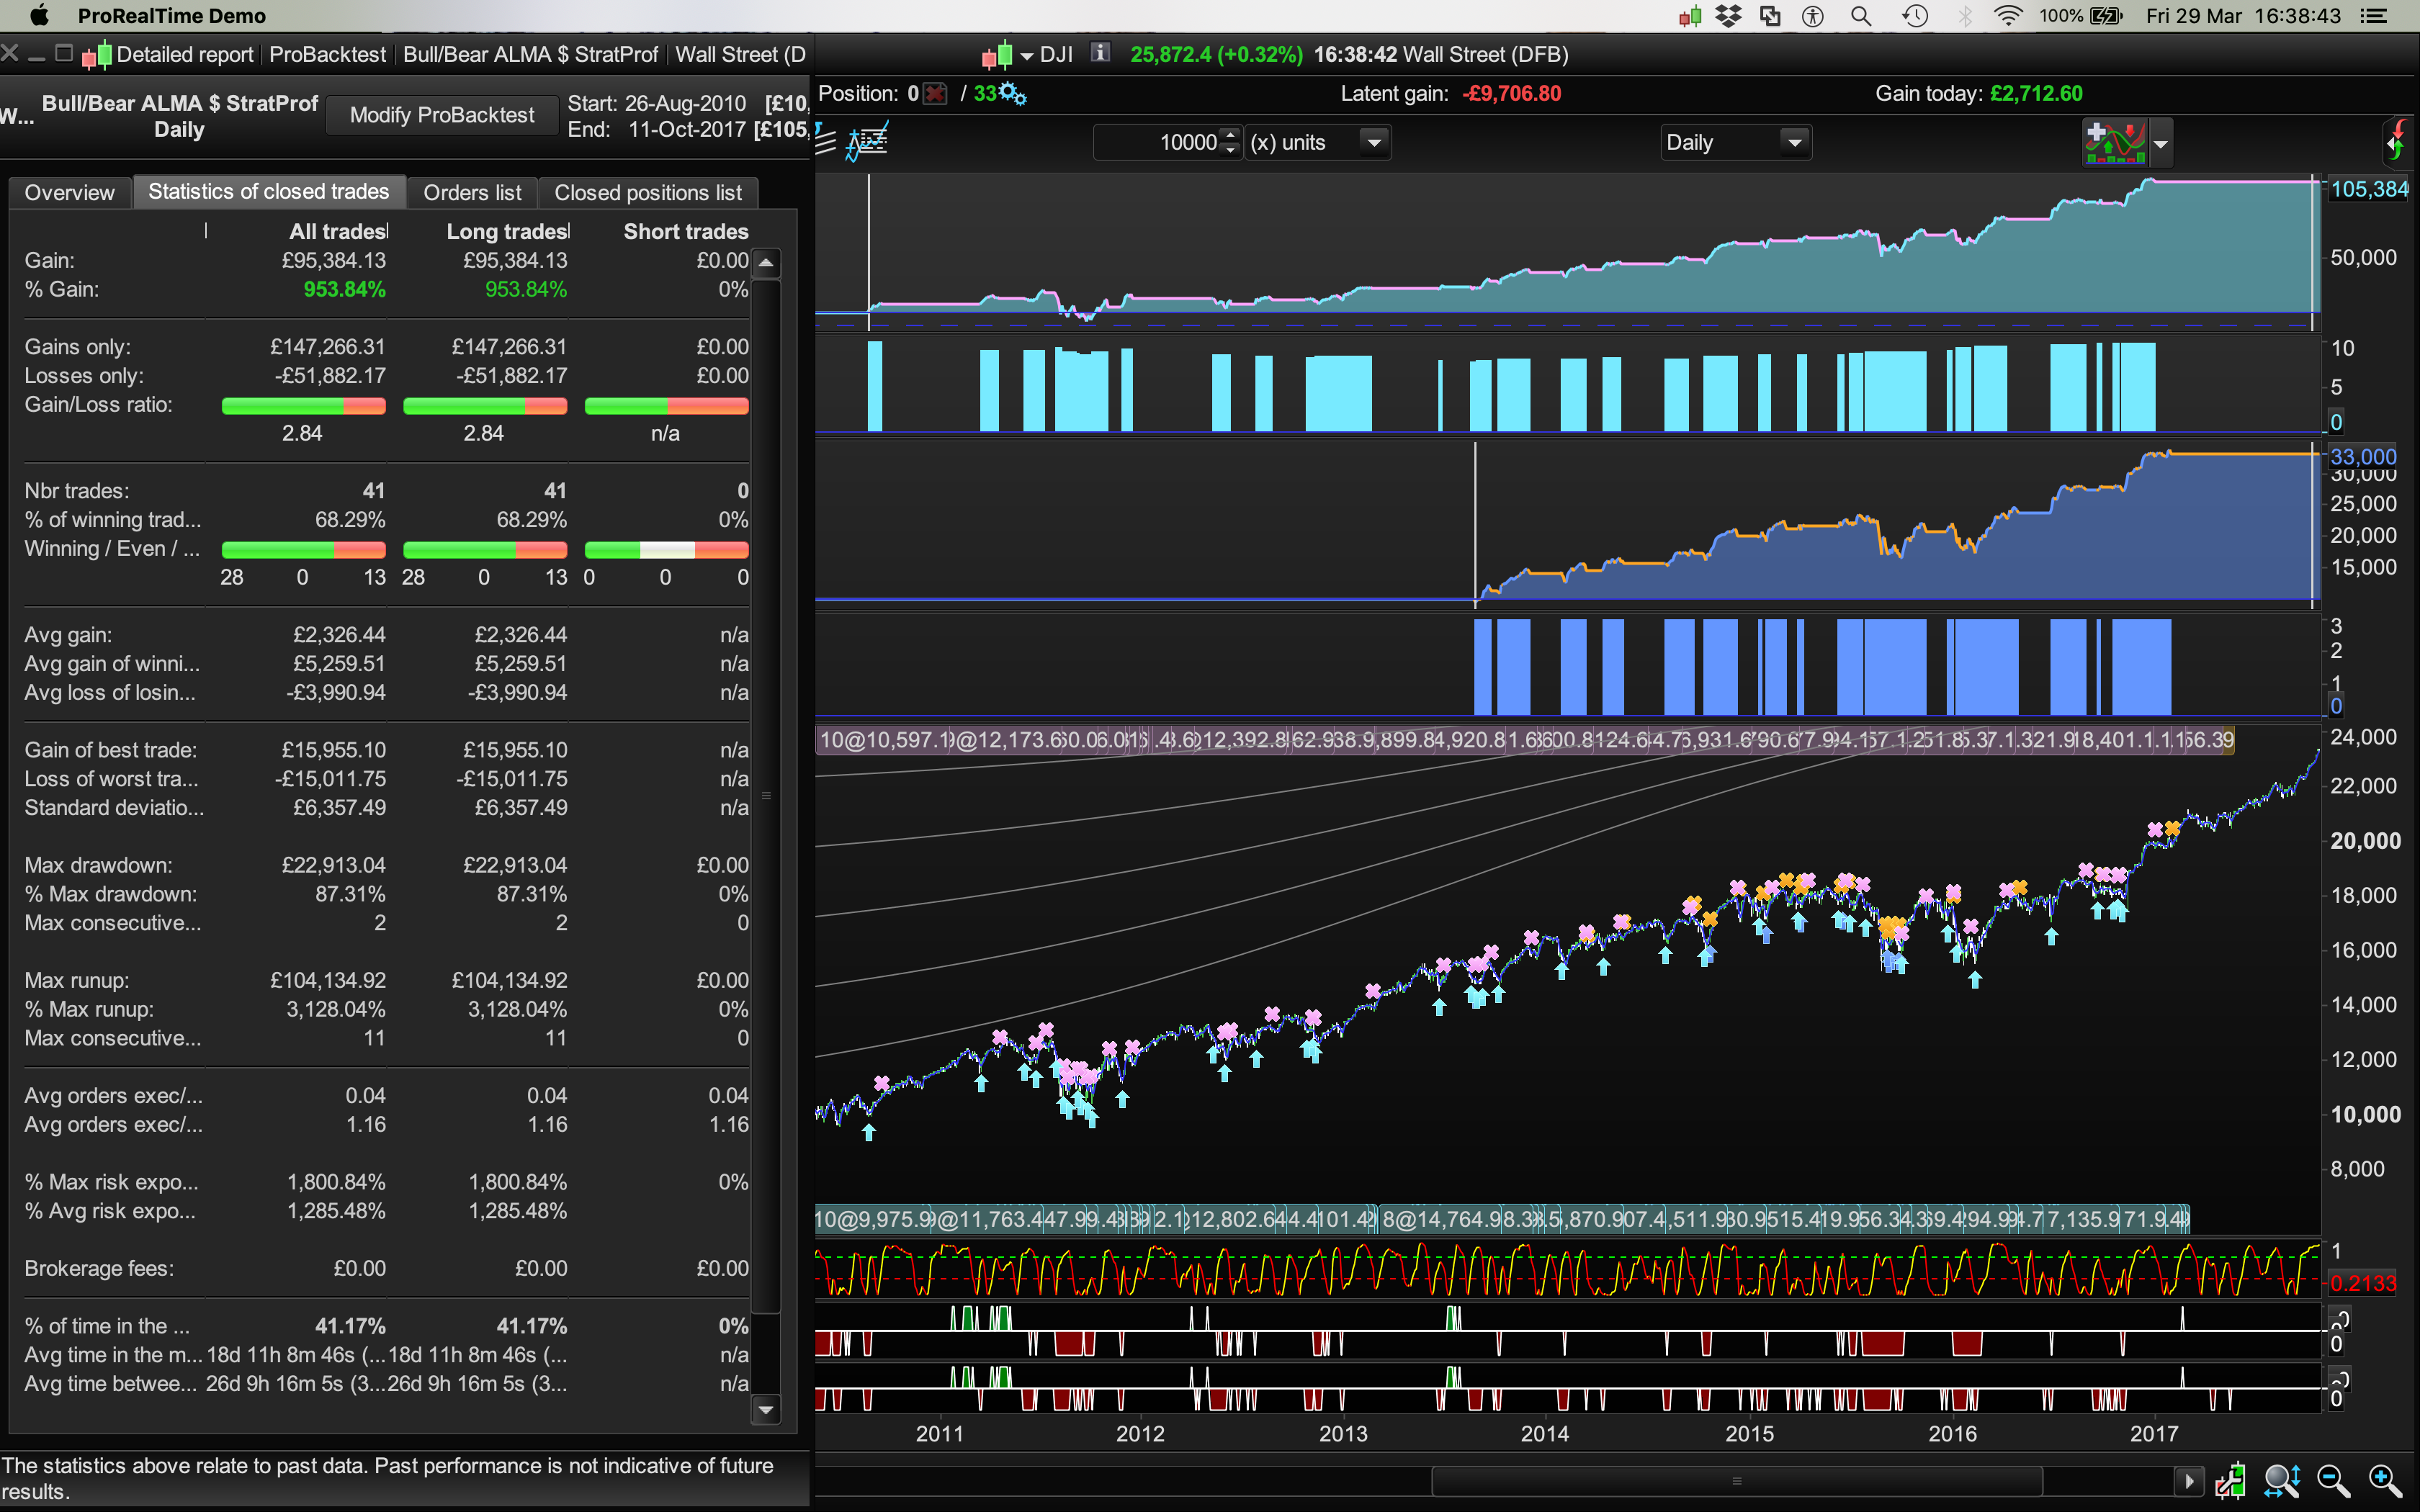
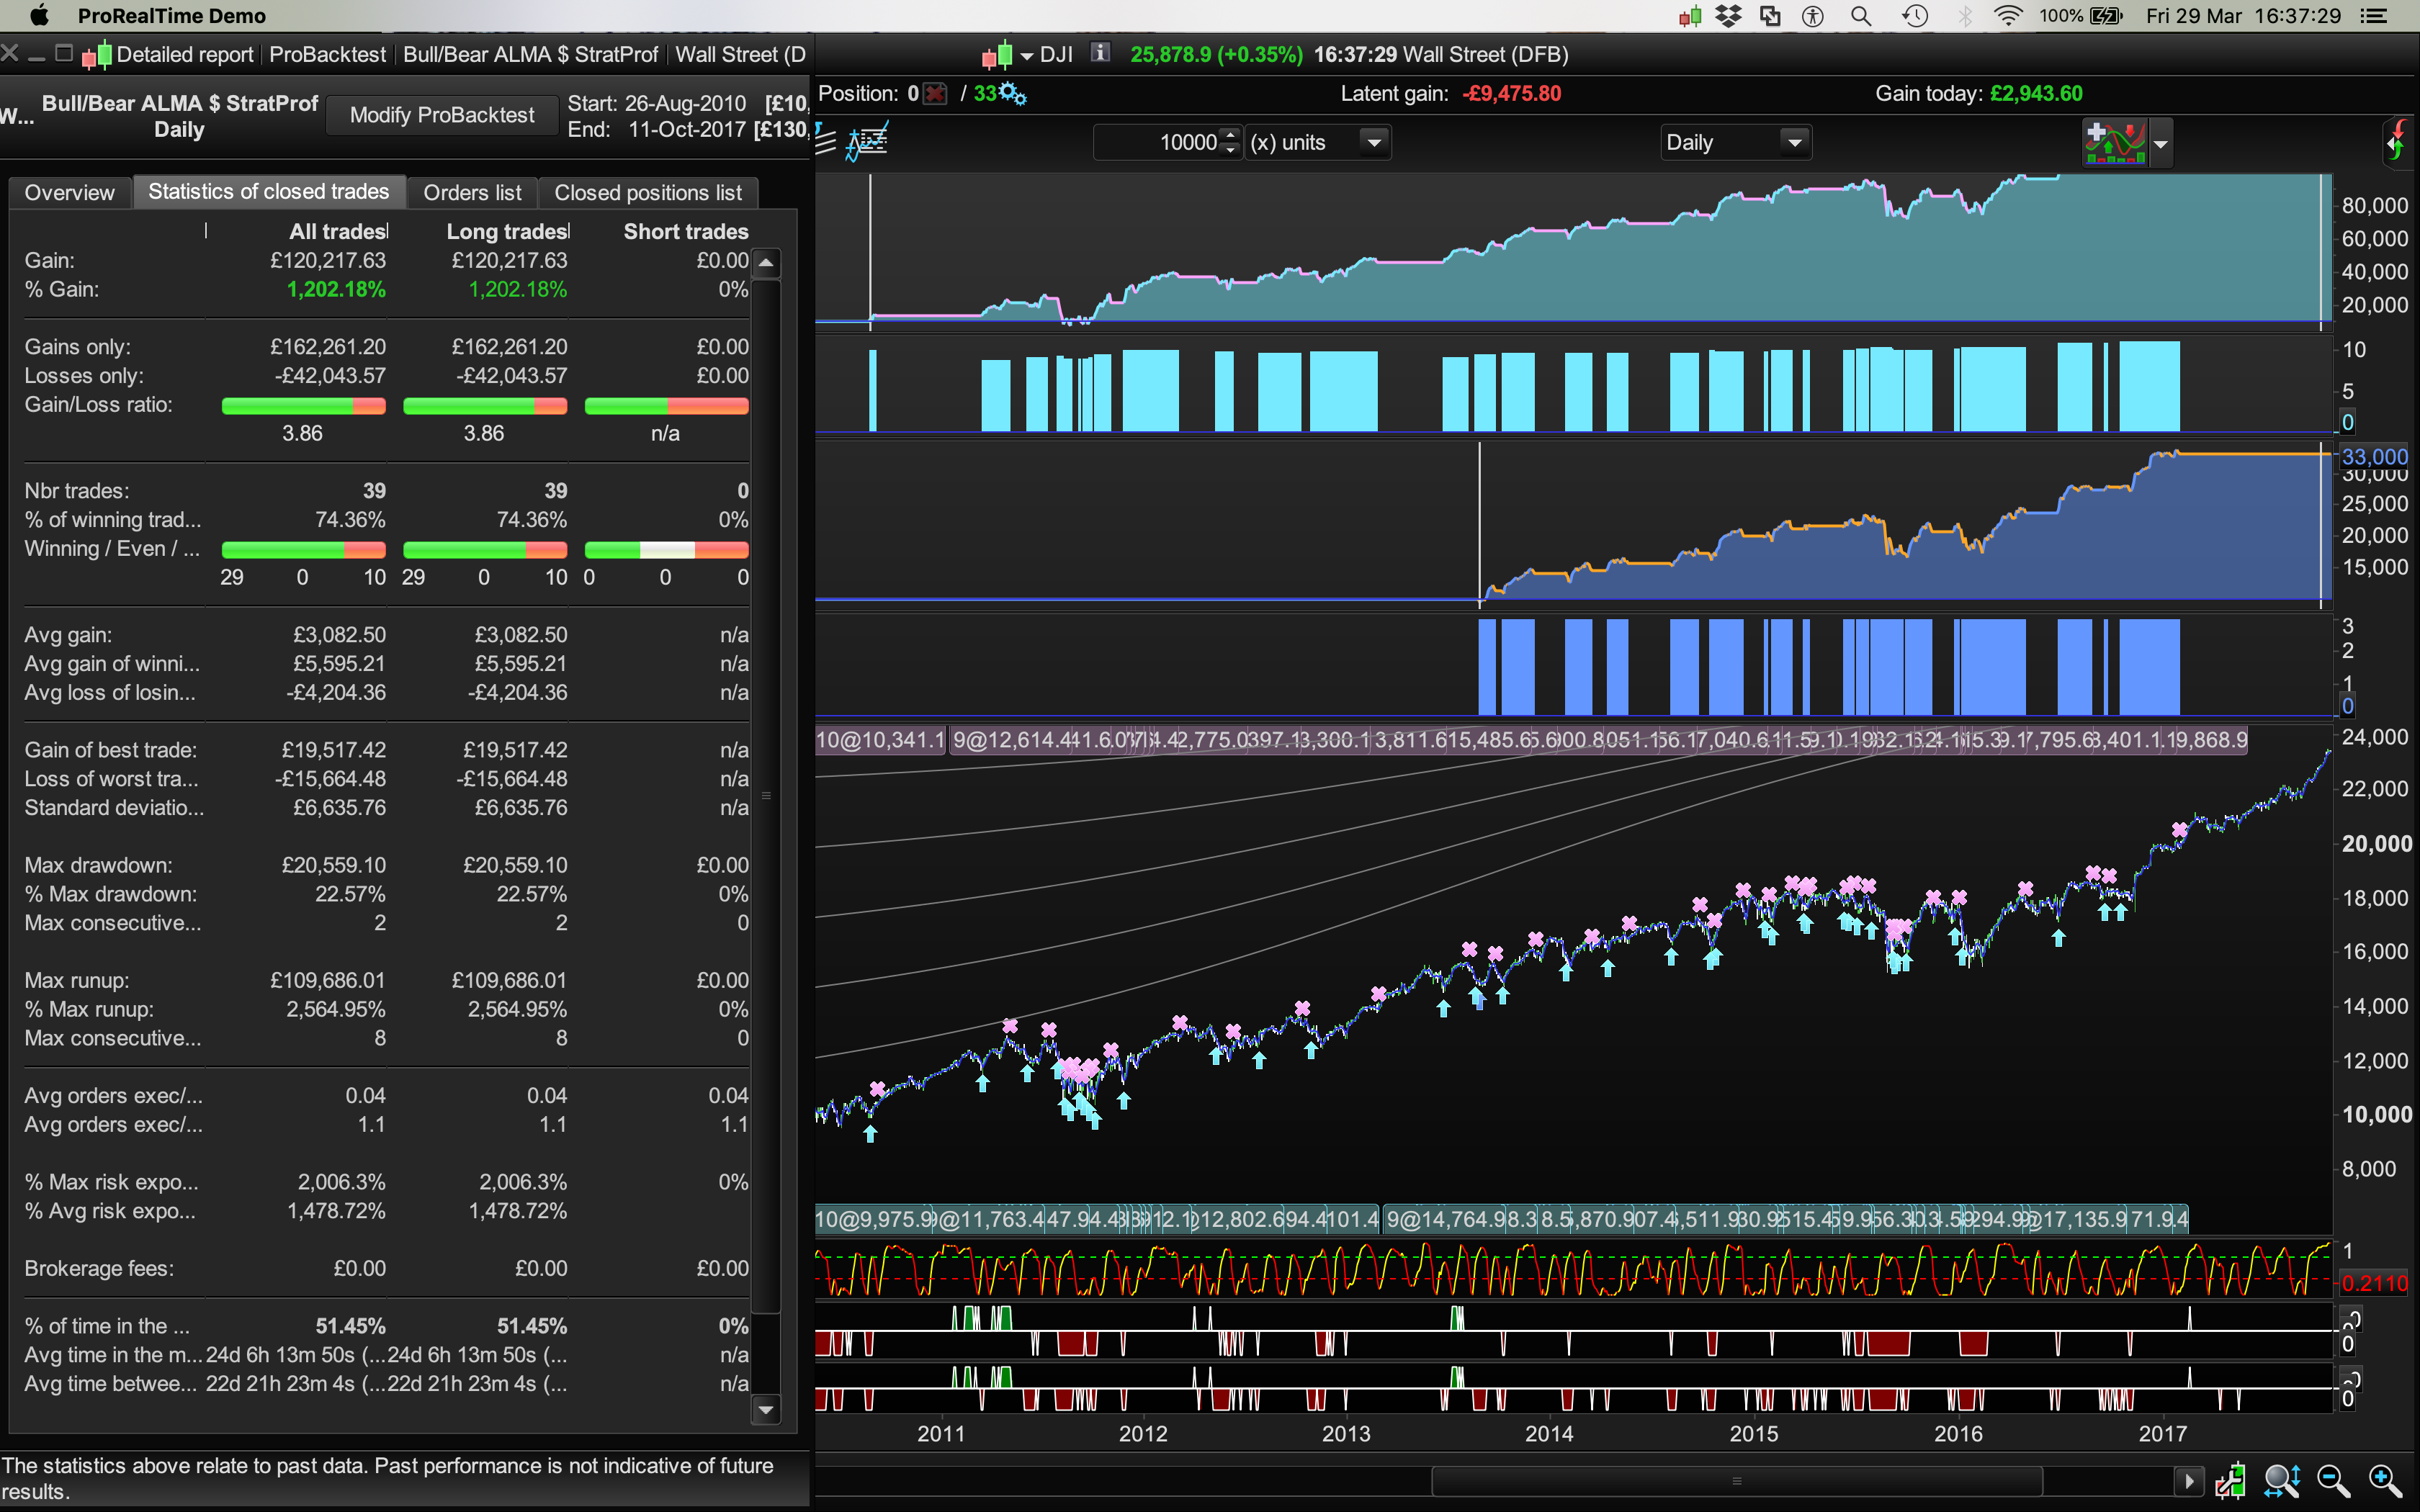
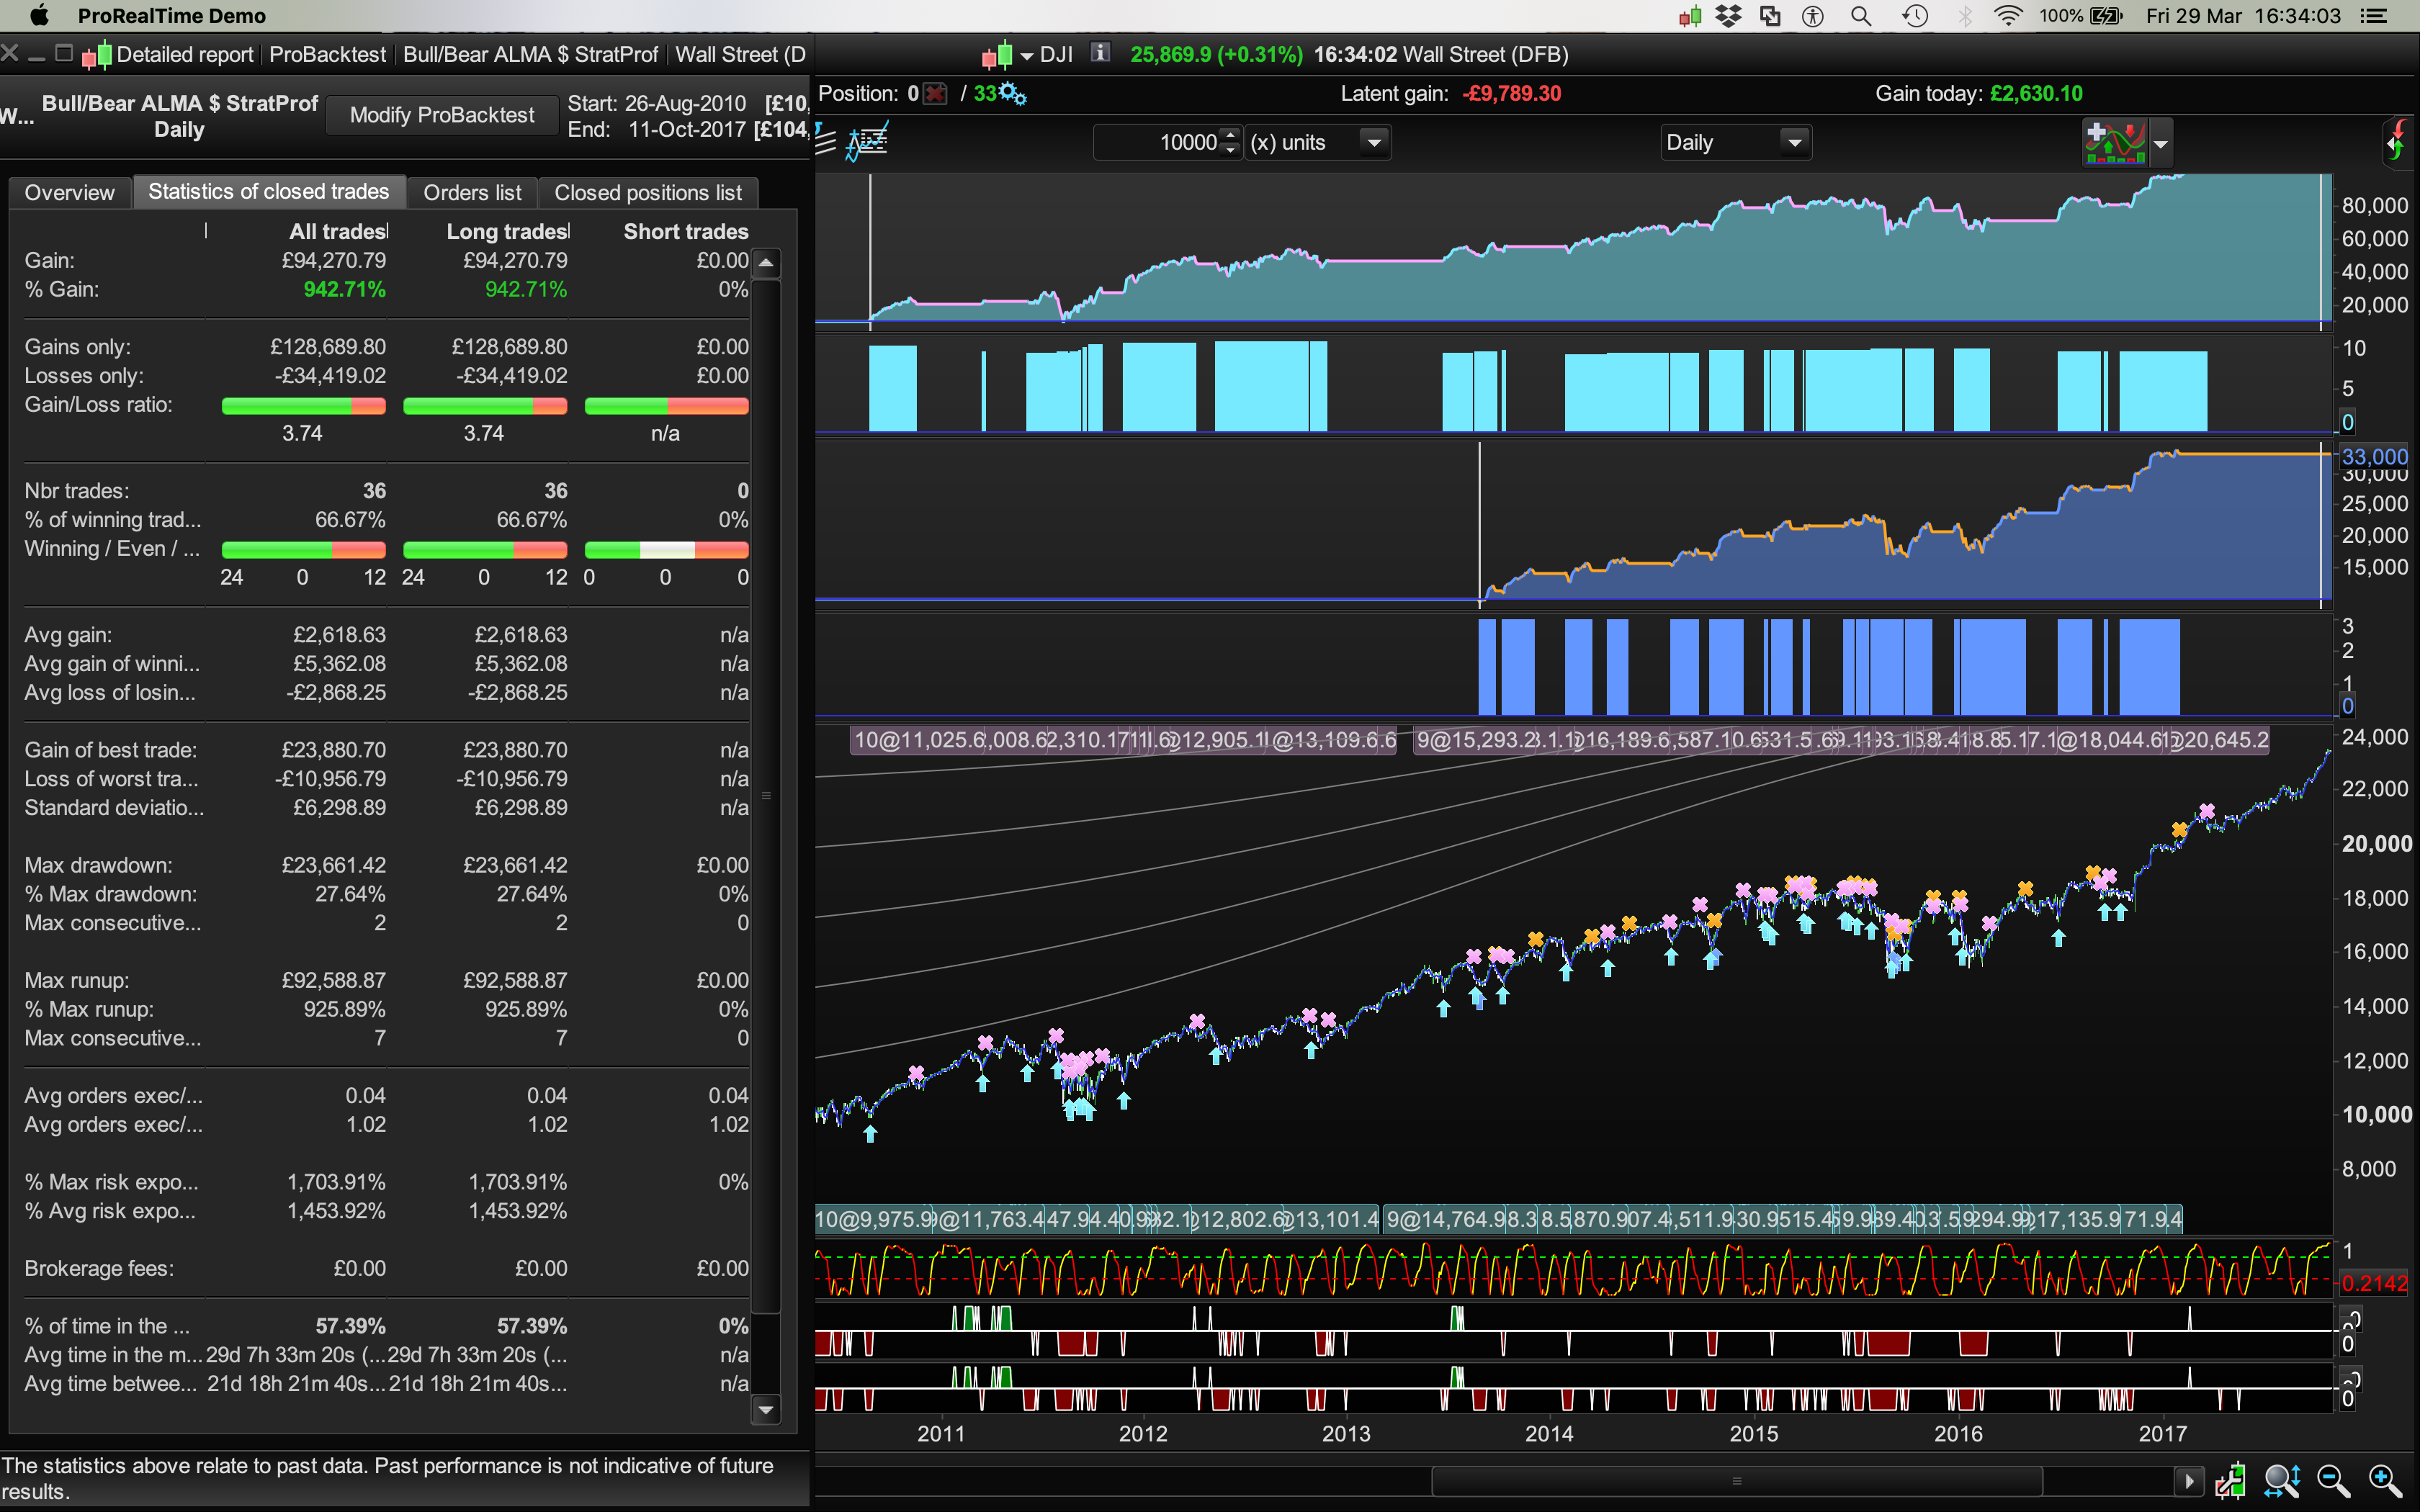
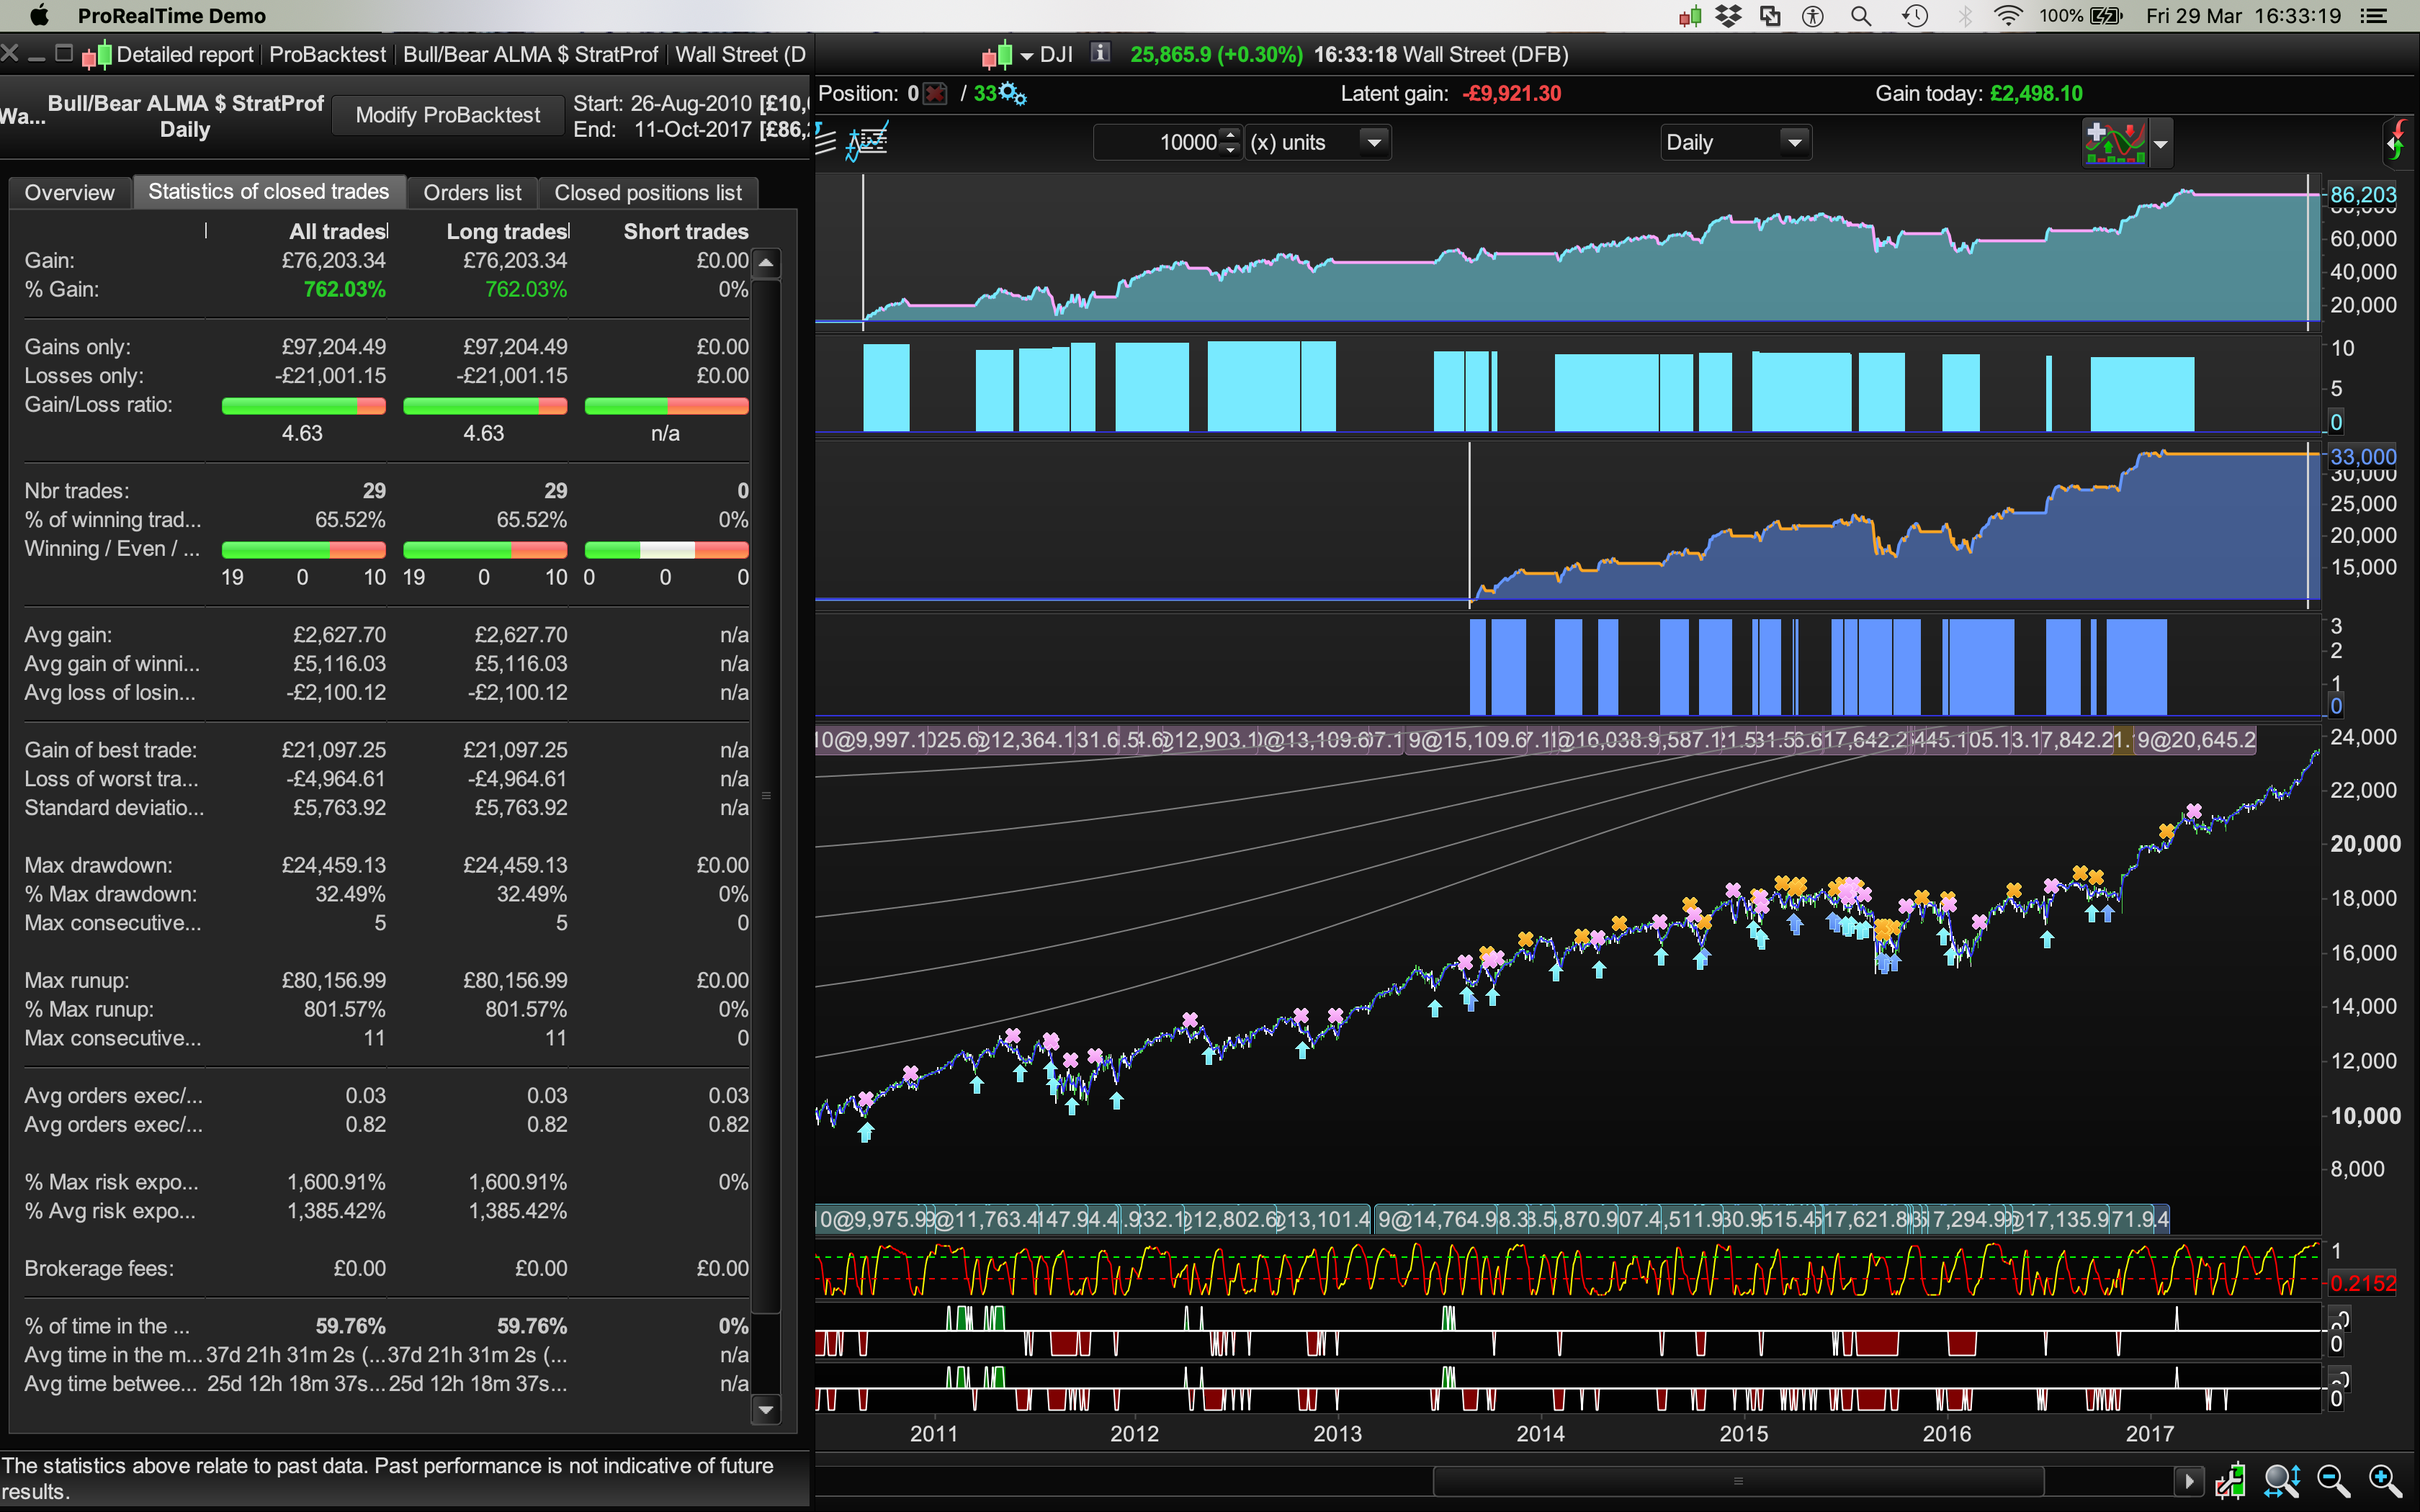
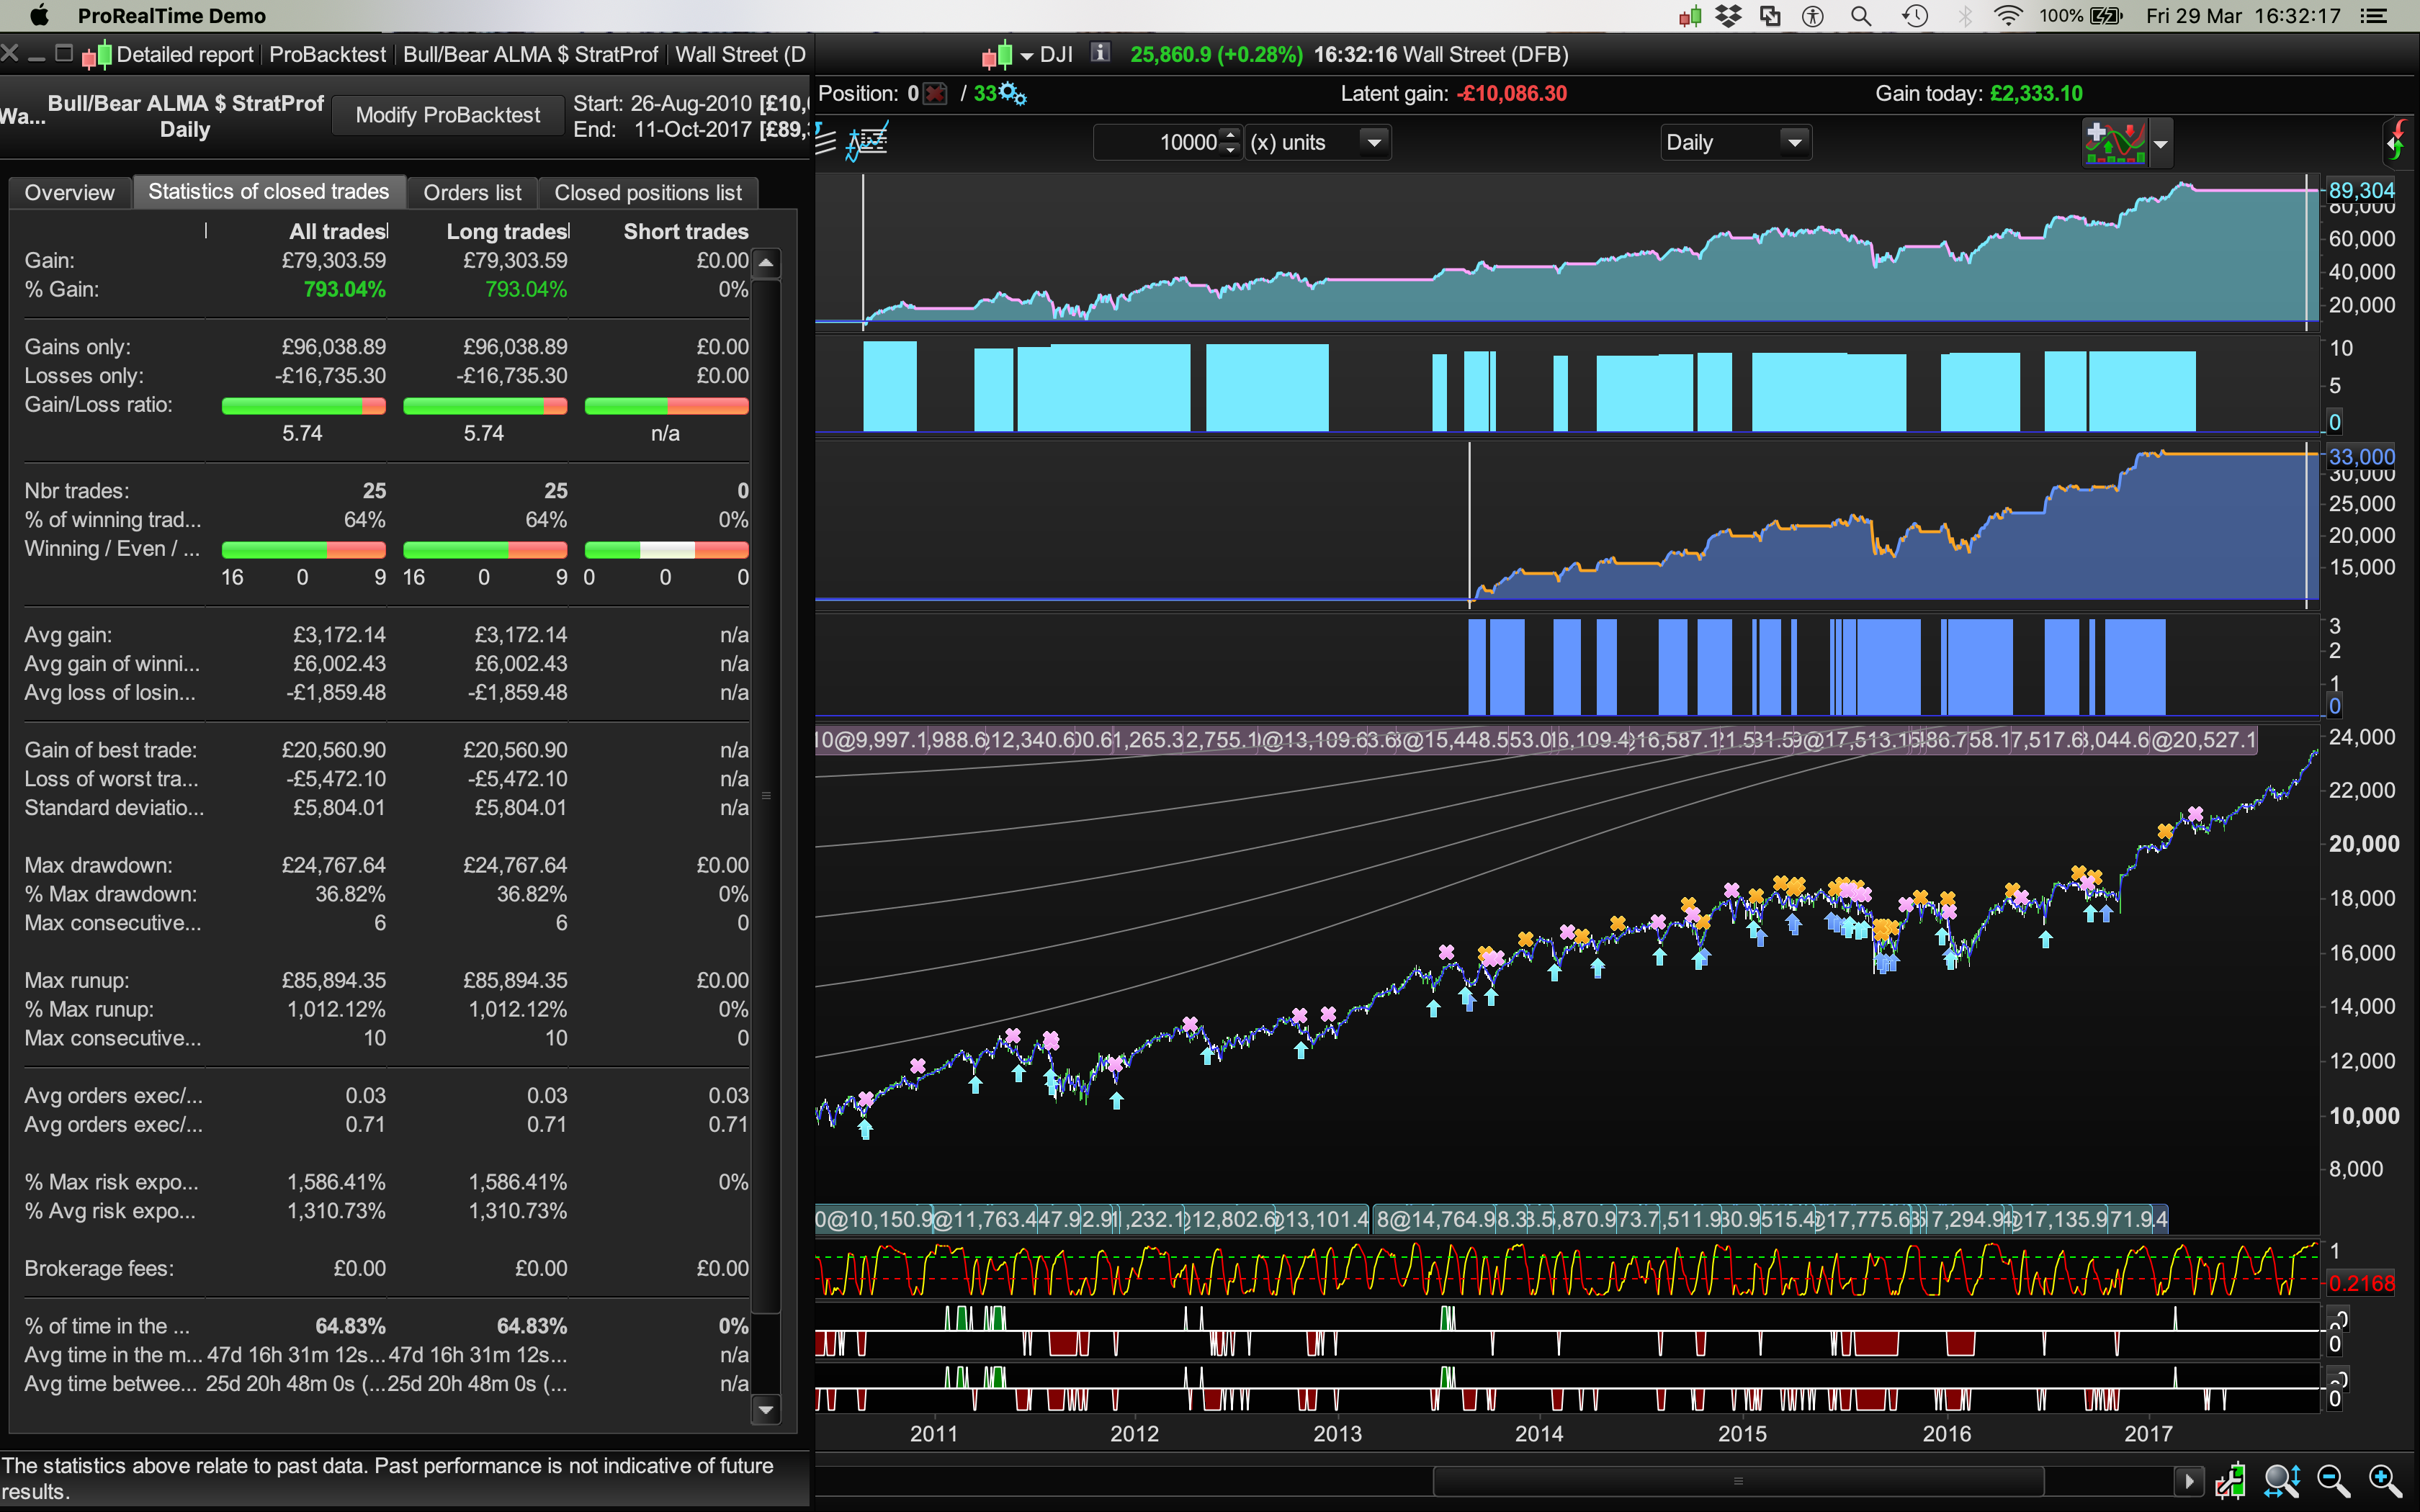
It acts as a good contrarian indicator if you use those short term (couple of days) Bear Spikes as long entries: Dow Jones
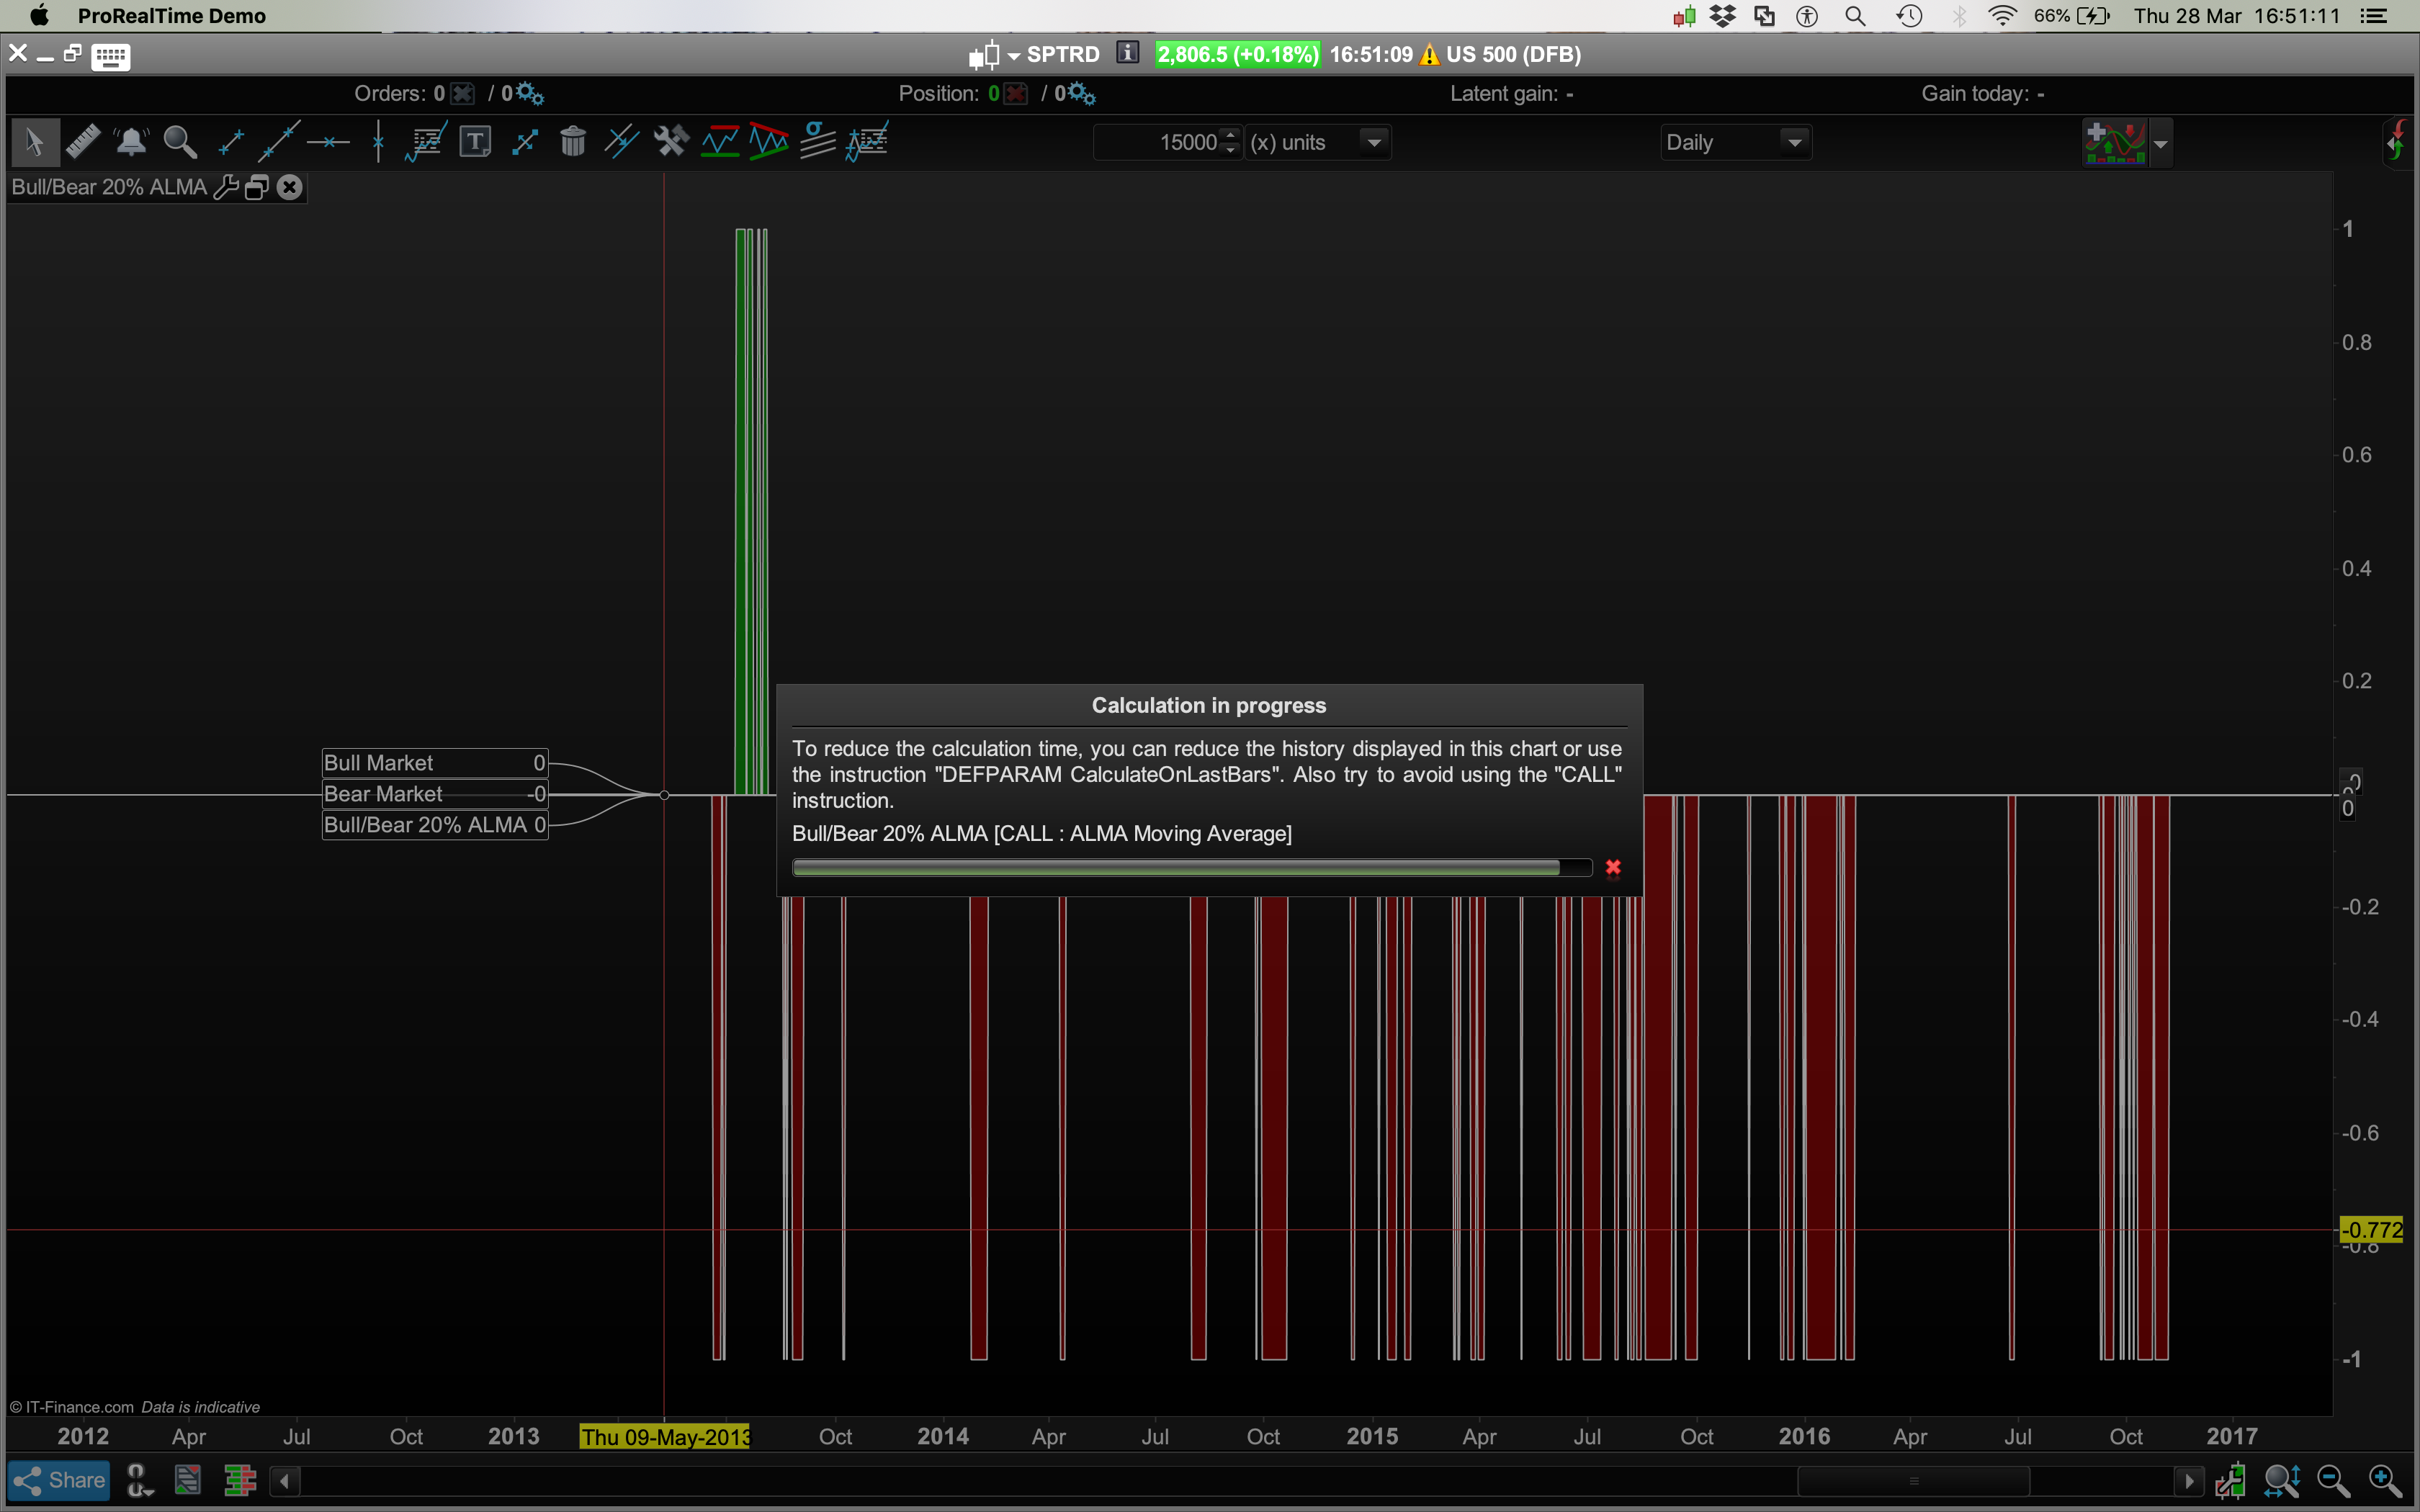
Pls see images (this indicator is the bottom of the two Bull/Bear indicators being used, the top one is just a regular 50, 100, 200 SMA).
Dow Jones Daily/3.8 Spread/Random Dates: 26th Aug 2010 – 12 Oct 2017.
Dev Stop 6.0 worked “best.” Everyones risk/drowdown profile is different.
// Definition of code parameters
DEFPARAM CumulateOrders = False // Cumulating positions deactivated
capital = 100000 + strategyprofit //Current profit made by the closed trades of the running strategy.
n = capital / close
// Conditions to enter long positions
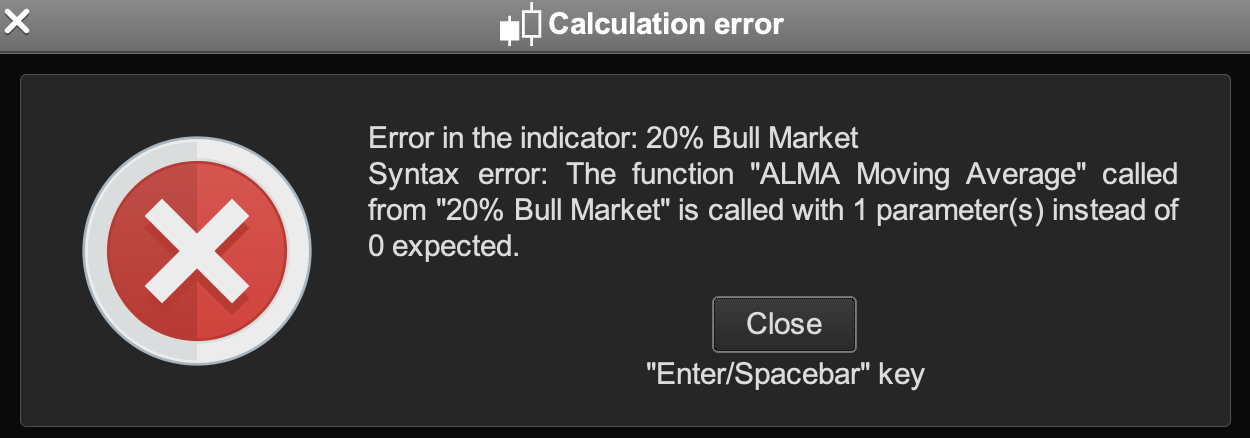
ignored, indicator1, ignored = CALL "Bull/Bear 20% ALMA"(close)
c1 = (indicator1 = -1)
ignored, indicator2, ignored = CALL "Bull/Bear 20% ALMA"(close)
c2 = (indicator2[1] = -1)
ignored, indicator3, ignored = CALL "Bull/Bear 20% ALMA"(close)
c3 = (indicator3[2] = -1)
IF c1 AND c2 AND c3 THEN
BUY n PERPOINT AT MARKET
ENDIF
// Conditions to exit long positions
ignored, ignored, ignored, ignored, ignored, DEV = CALL "Kase Dev Stop Lisse+SAR+4.5/6"
c4 = (close CROSSES UNDER DEV)
IF c4 THEN
SELL AT MARKET
ENDIF
//Voici le code en version SAR : plus WITH DEV STOP 4.5 + 6.0
//Settings
n=30
p1=1.0
p2=2.2
p3=3.6
p4=4.5
p5=6.0
difference=0
Hg=highest[2](high)
Lw=lowest[2](low)
DTR=max(max(Hg-Lw,abs(Hg-close[2])),abs(Lw-close[2]))
aDTR=average[n](DTR)
for i=0 to n-1 do
difference=difference+square(DTR[i]-aDTR)
next
difference=difference/n
sdev=sqrt(difference)
dev0=close-aDTR
dev1=close-aDTR-p1*sdev
dev2=close-aDTR-p2*sdev
dev3=close-aDTR-p3*sdev
dev4=close-aDTR-p4*sdev
dev5=close-aDTR-p5*sdev
if dev0<dev0[1] and close>dev5[1] then
dev0=dev0[1]
endif
if dev1<dev1[1] and close>dev5[1] then
dev1=dev1[1]
endif
if dev2<dev2[1] and close>dev5[1] then
dev2=dev2[1]
endif
if dev3<dev3[1] and close>dev5[1] then
dev3=dev3[1]
endif
if dev4<dev4[1] and close>dev5[1] then
dev4=dev4[1]
endif
if dev5<dev5[1] and close>dev5[1] then
dev5=dev5[1]
endif
dev6=close+aDTR
dev7=close+aDTR+p1*sdev
dev8=close+aDTR+p2*sdev
dev9=close+aDTR+p3*sdev
dev10=close+aDTR+p4*sdev
dev11=close+aDTR+p5*sdev
if dev6>dev6[1] and close<dev11[1] then
dev6=dev6[1]
endif
if dev7>dev7[1] and close<dev11[1] then
dev7=dev7[1]
endif
if dev8>dev8[1] and close<dev11[1] then
dev8=dev8[1]
endif
if dev9>dev9[1] and close<dev11[1] then
dev9=dev9[1]
endif
if dev10>dev10[1] and close<dev11[1] then
dev10=dev10[1]
endif
if dev11>dev11[1] and close<dev11[1] then
dev11=dev11[1]
endif
if close>dev11[1] then
flag=-1
else
if close<dev5[1] then
flag=1
endif
endif
if flag=-1 then
ind0=dev0
ind1=dev1
ind2=dev2
ind3=dev3
ind4=dev4
ind5=dev5
//k=1 Blue
r=0
g=191
b=255
else
ind0=dev6
ind1=dev7
ind2=dev8
ind3=dev9
ind4=dev10
ind5=dev11
//k=-1 Orange
r=255
g=128
b=0
endif
//ORIG return ind0 COLOURED BY k,ind1 coloured by k,ind2 coloured by k,ind3 coloured by k//
//ORANGE AND LIGHT BLUE
return ind0 coloured(r,g,b) style(dottedline,2) as "Warning Line", ind1 coloured(r,g,b) style(dottedline,2) as "Dev Stop 1.0", ind2 coloured(r,g,b) style(dottedline,2) as "Dev Stop 2.2", ind3 coloured(r,g,b) style(line,2) as "Dev Stop 3.6", ind4 coloured(r,g,b) style(dottedline,2) as "Dev Stop 4.5", ind5 coloured(r,g,b) style(line,2) as "Dev Stop 6.0"
//NO CHANGE OF COLOUR FOR TREND CHANGE return ind0 coloured(2, 118, 253) style(dottedline,2) as "Warning Line" ,ind1 coloured(2, 118, 253) style(dottedline,2) as "Dev Stop 1.0", ind2 coloured(2, 118, 253) style(dottedline,2) as "Dev Stop 2.2", ind3 coloured(2, 118, 253) style(line,2) as "Dev Stop 3.6", ind4 coloured(2, 118, 253) style(dottedline,2) as "Dev Stop 4.5", ind5 coloured(2, 118, 253) style(line,2) as "Dev Stop 6.0"
//Bear 20% w. ALMA
// 20% Bull Market increase in Prices
//DEFPARAM CalculateOnLastBars = 5000
Period  = 50              //start with 50 periods
Series  = customclose
FOR j = 1 TO 3
   Sigma  = 6
   Offset = 0.85
   m = ROUND(Offset * (Period - 1))
   s = Period / Sigma
   WtdSum = 0
   CumWt  = 0
   FOR k = 0 TO Period - 1 DO
      Wtd = EXP(-((k - m) * (k - m)) / (2 * s * s))
      WtdSum = WtdSum + Wtd * Series[Period - 1 - k]
      CumWt = CumWt + Wtd
   NEXT
   IF CumWt <= 0 THEN
      AFR = Series
   ELSE
      AFR = WtdSum / CumWt
   ENDIF
   IF j = 1 THEN
      ShortMA = AFR
   ELSIF j = 2 THEN
      MediumMA = AFR
   ELSE
      LongMA = AFR
   ENDIF
   Period = Period * 2    //double periods
NEXT
BullC1 = Close[0] > ShortMA
BullC2 = Close[0] > MediumMA
BullC3 = Close[0] > LongMA
BullC4 = Close[0] >= (Close[200] * 1.2)
// 20% Bear Market decrease in Prices
BearC5 = Close[0] < ShortMA
BearC6 = Close[0] < MediumMA
BearC7 = Close[0] < LongMA
BearC8 = Close[0] <= (Close[200] * 1.2)
Return BullC1 and BullC2 and BullC3 and BullC4 as "Bull Market", -(BearC5 and BearC6 and BearC7 and BearC8) as "Bear Market",0
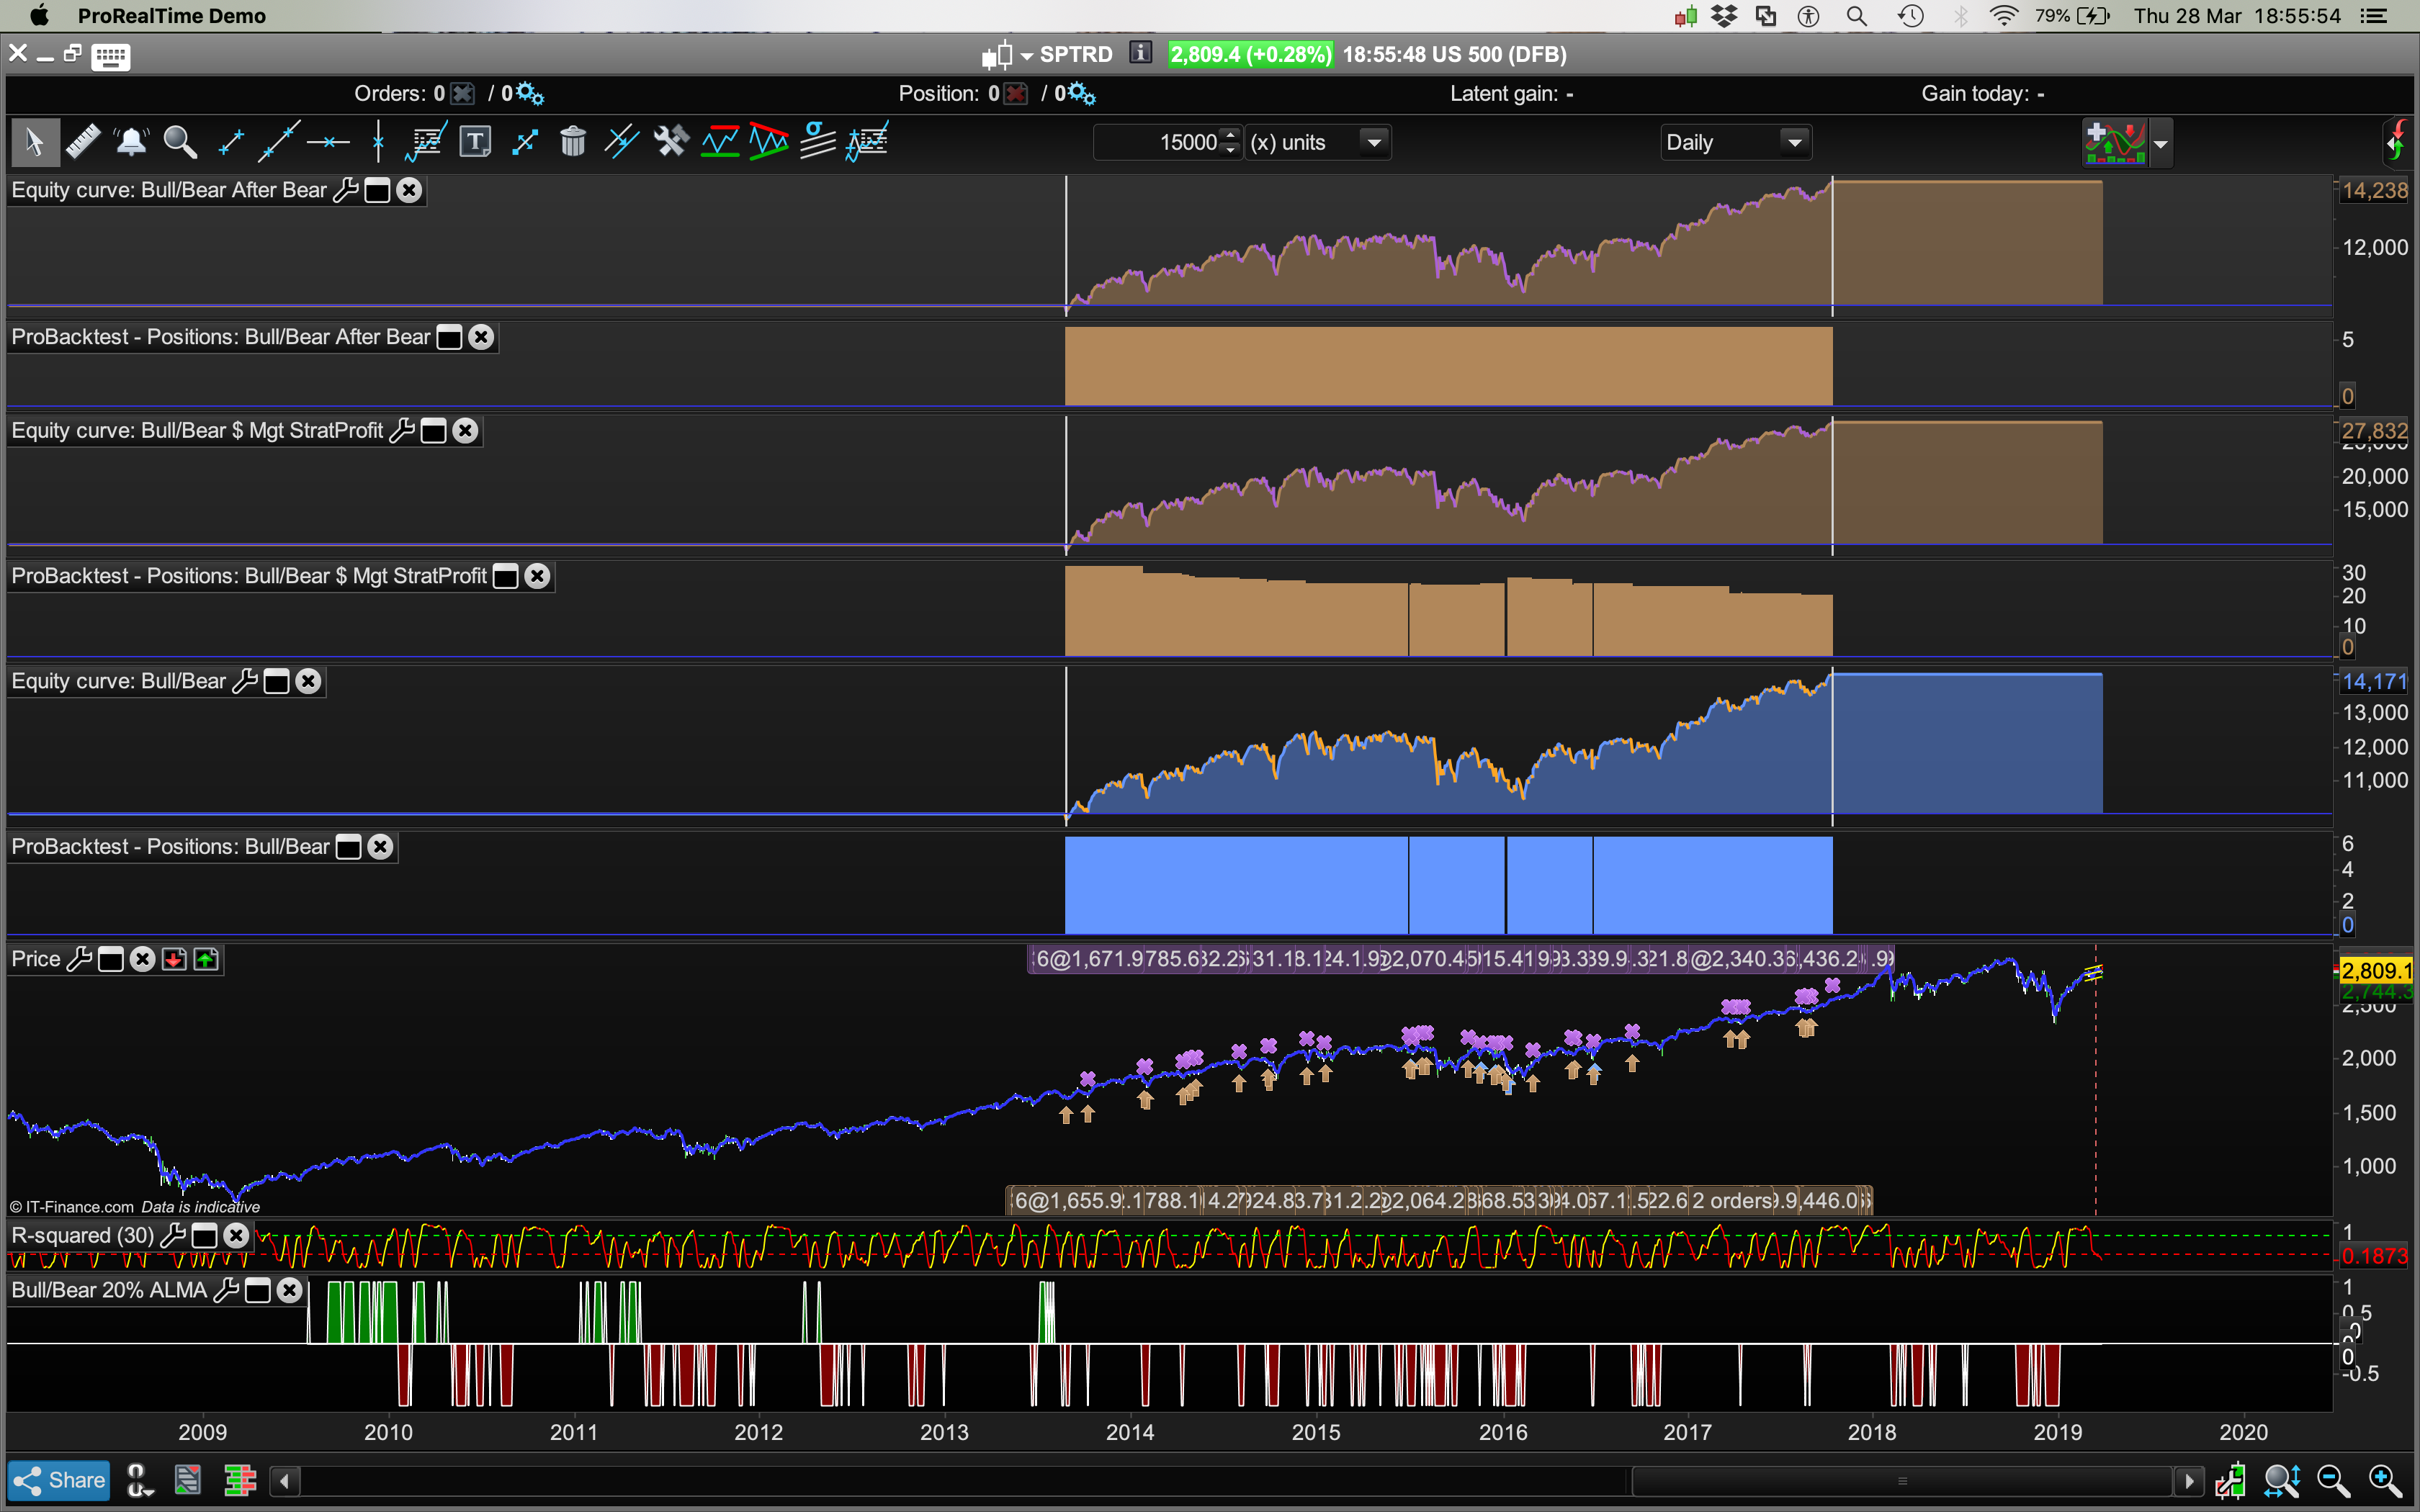
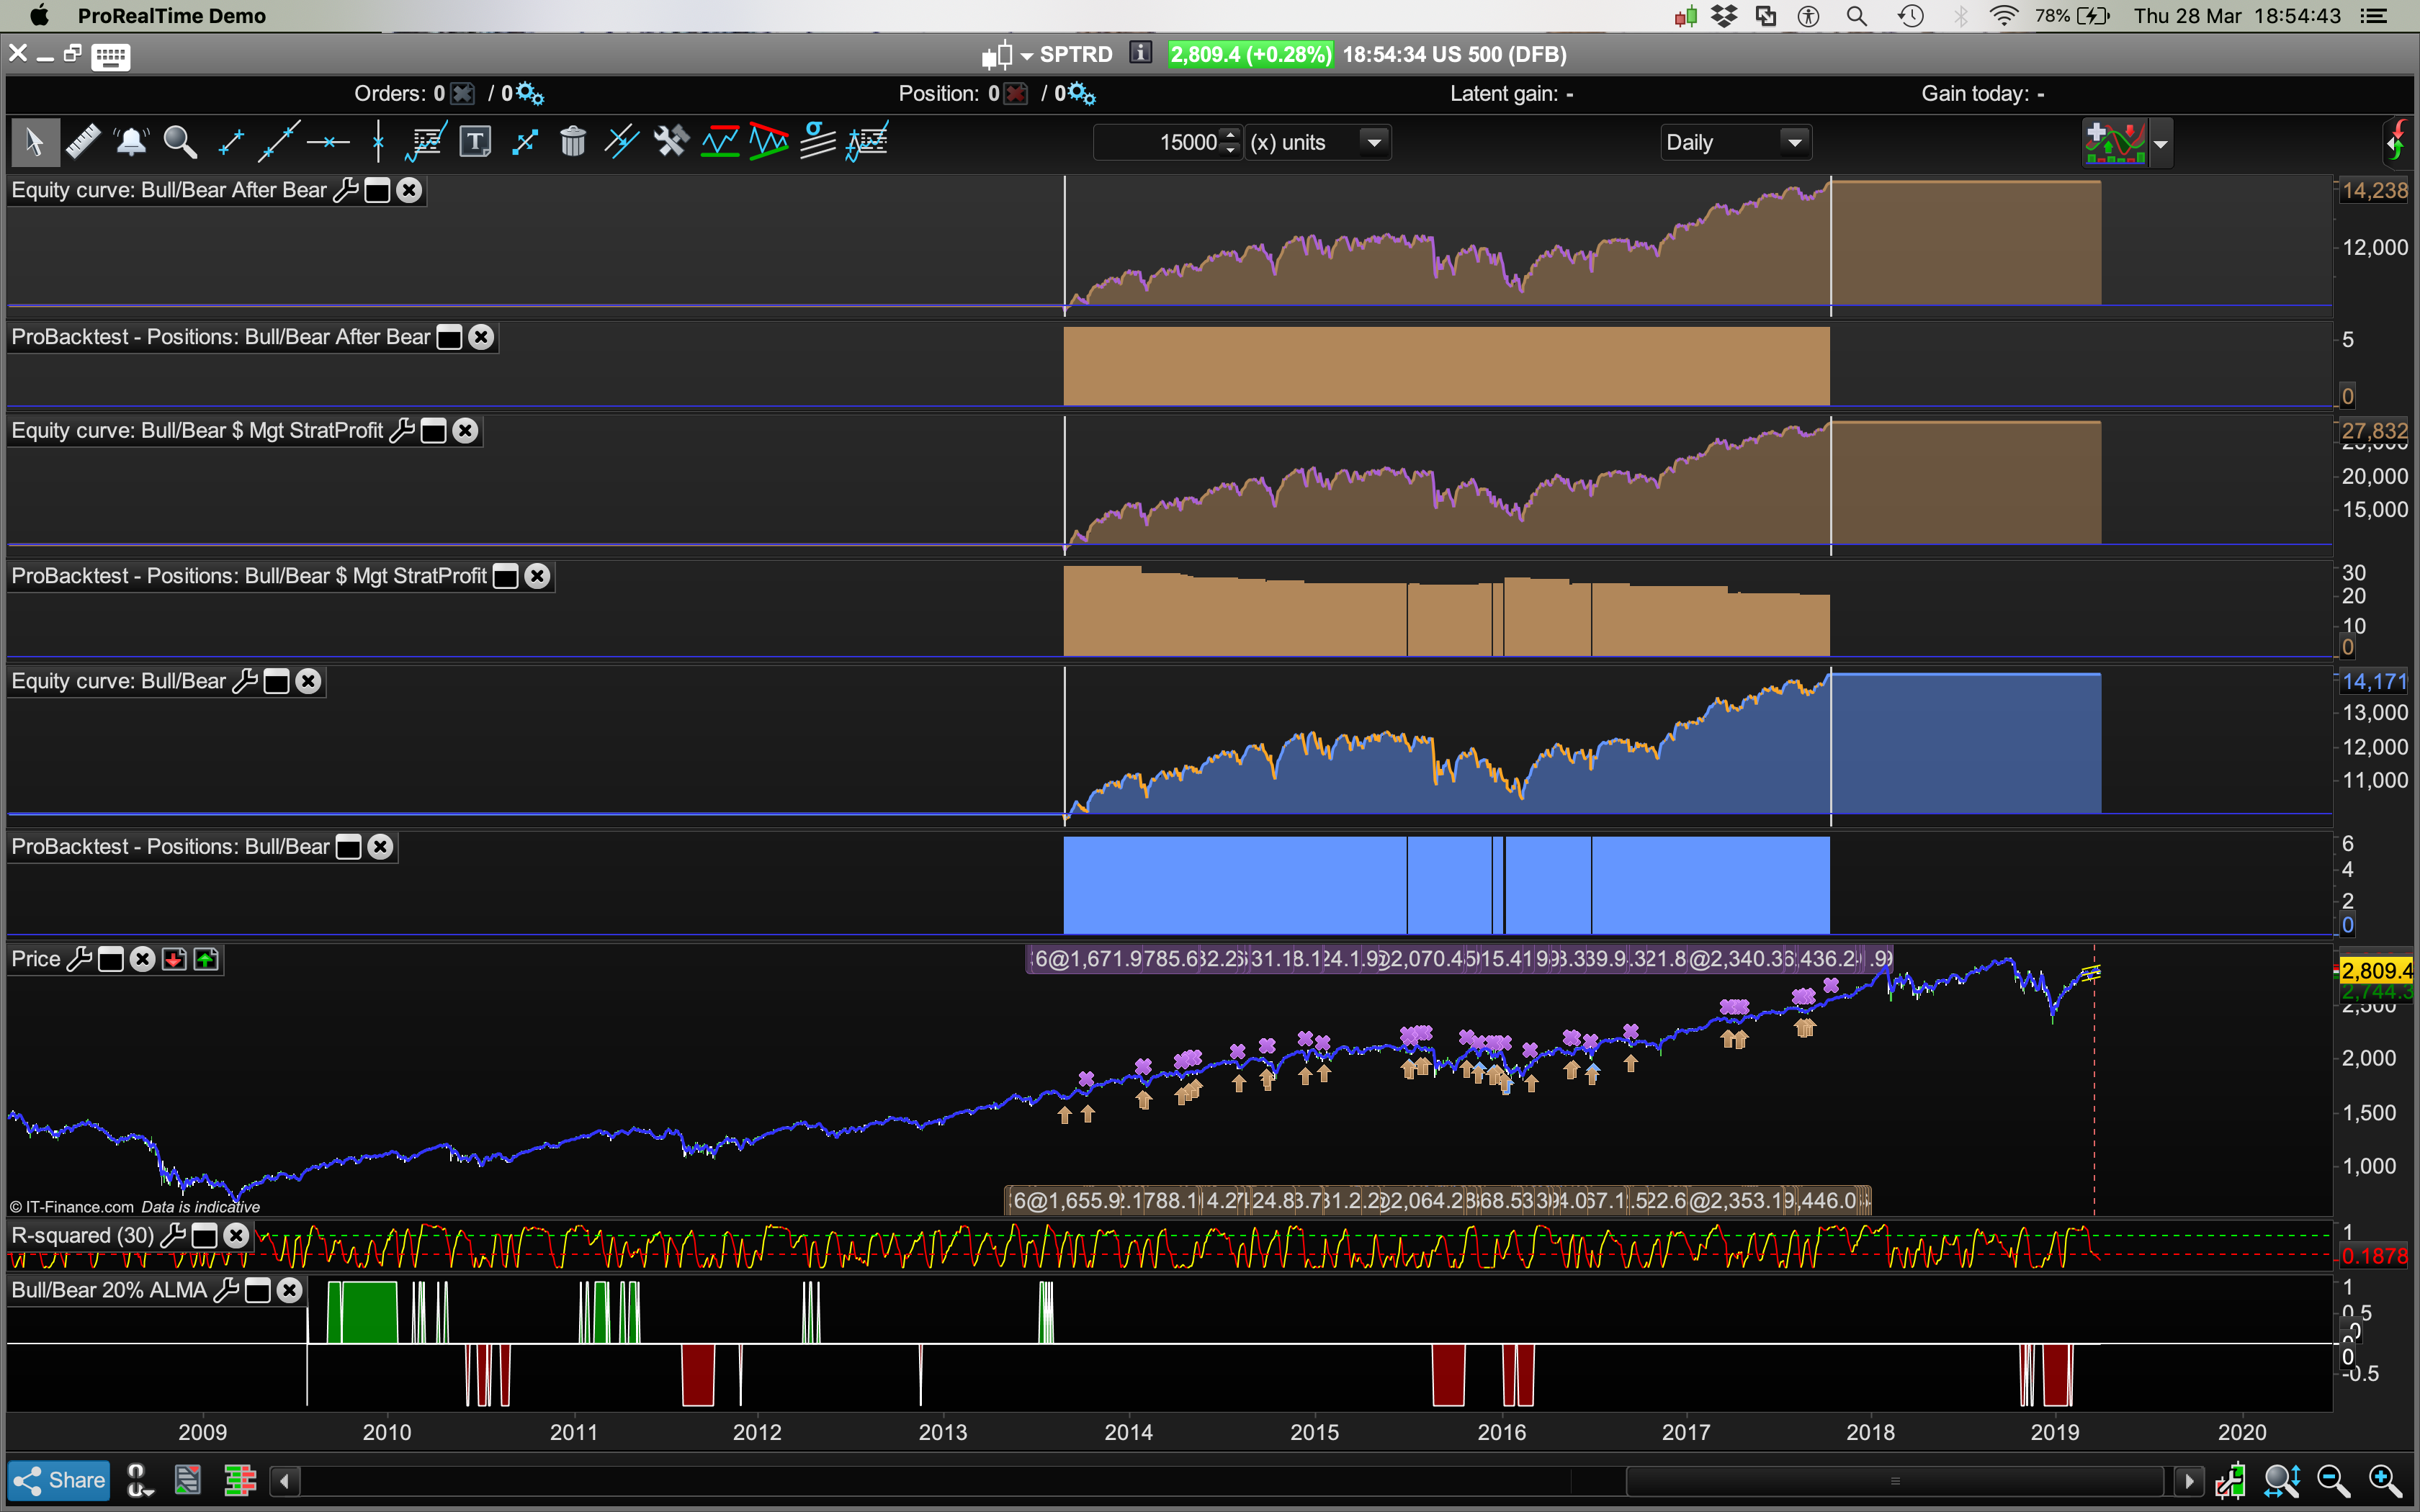
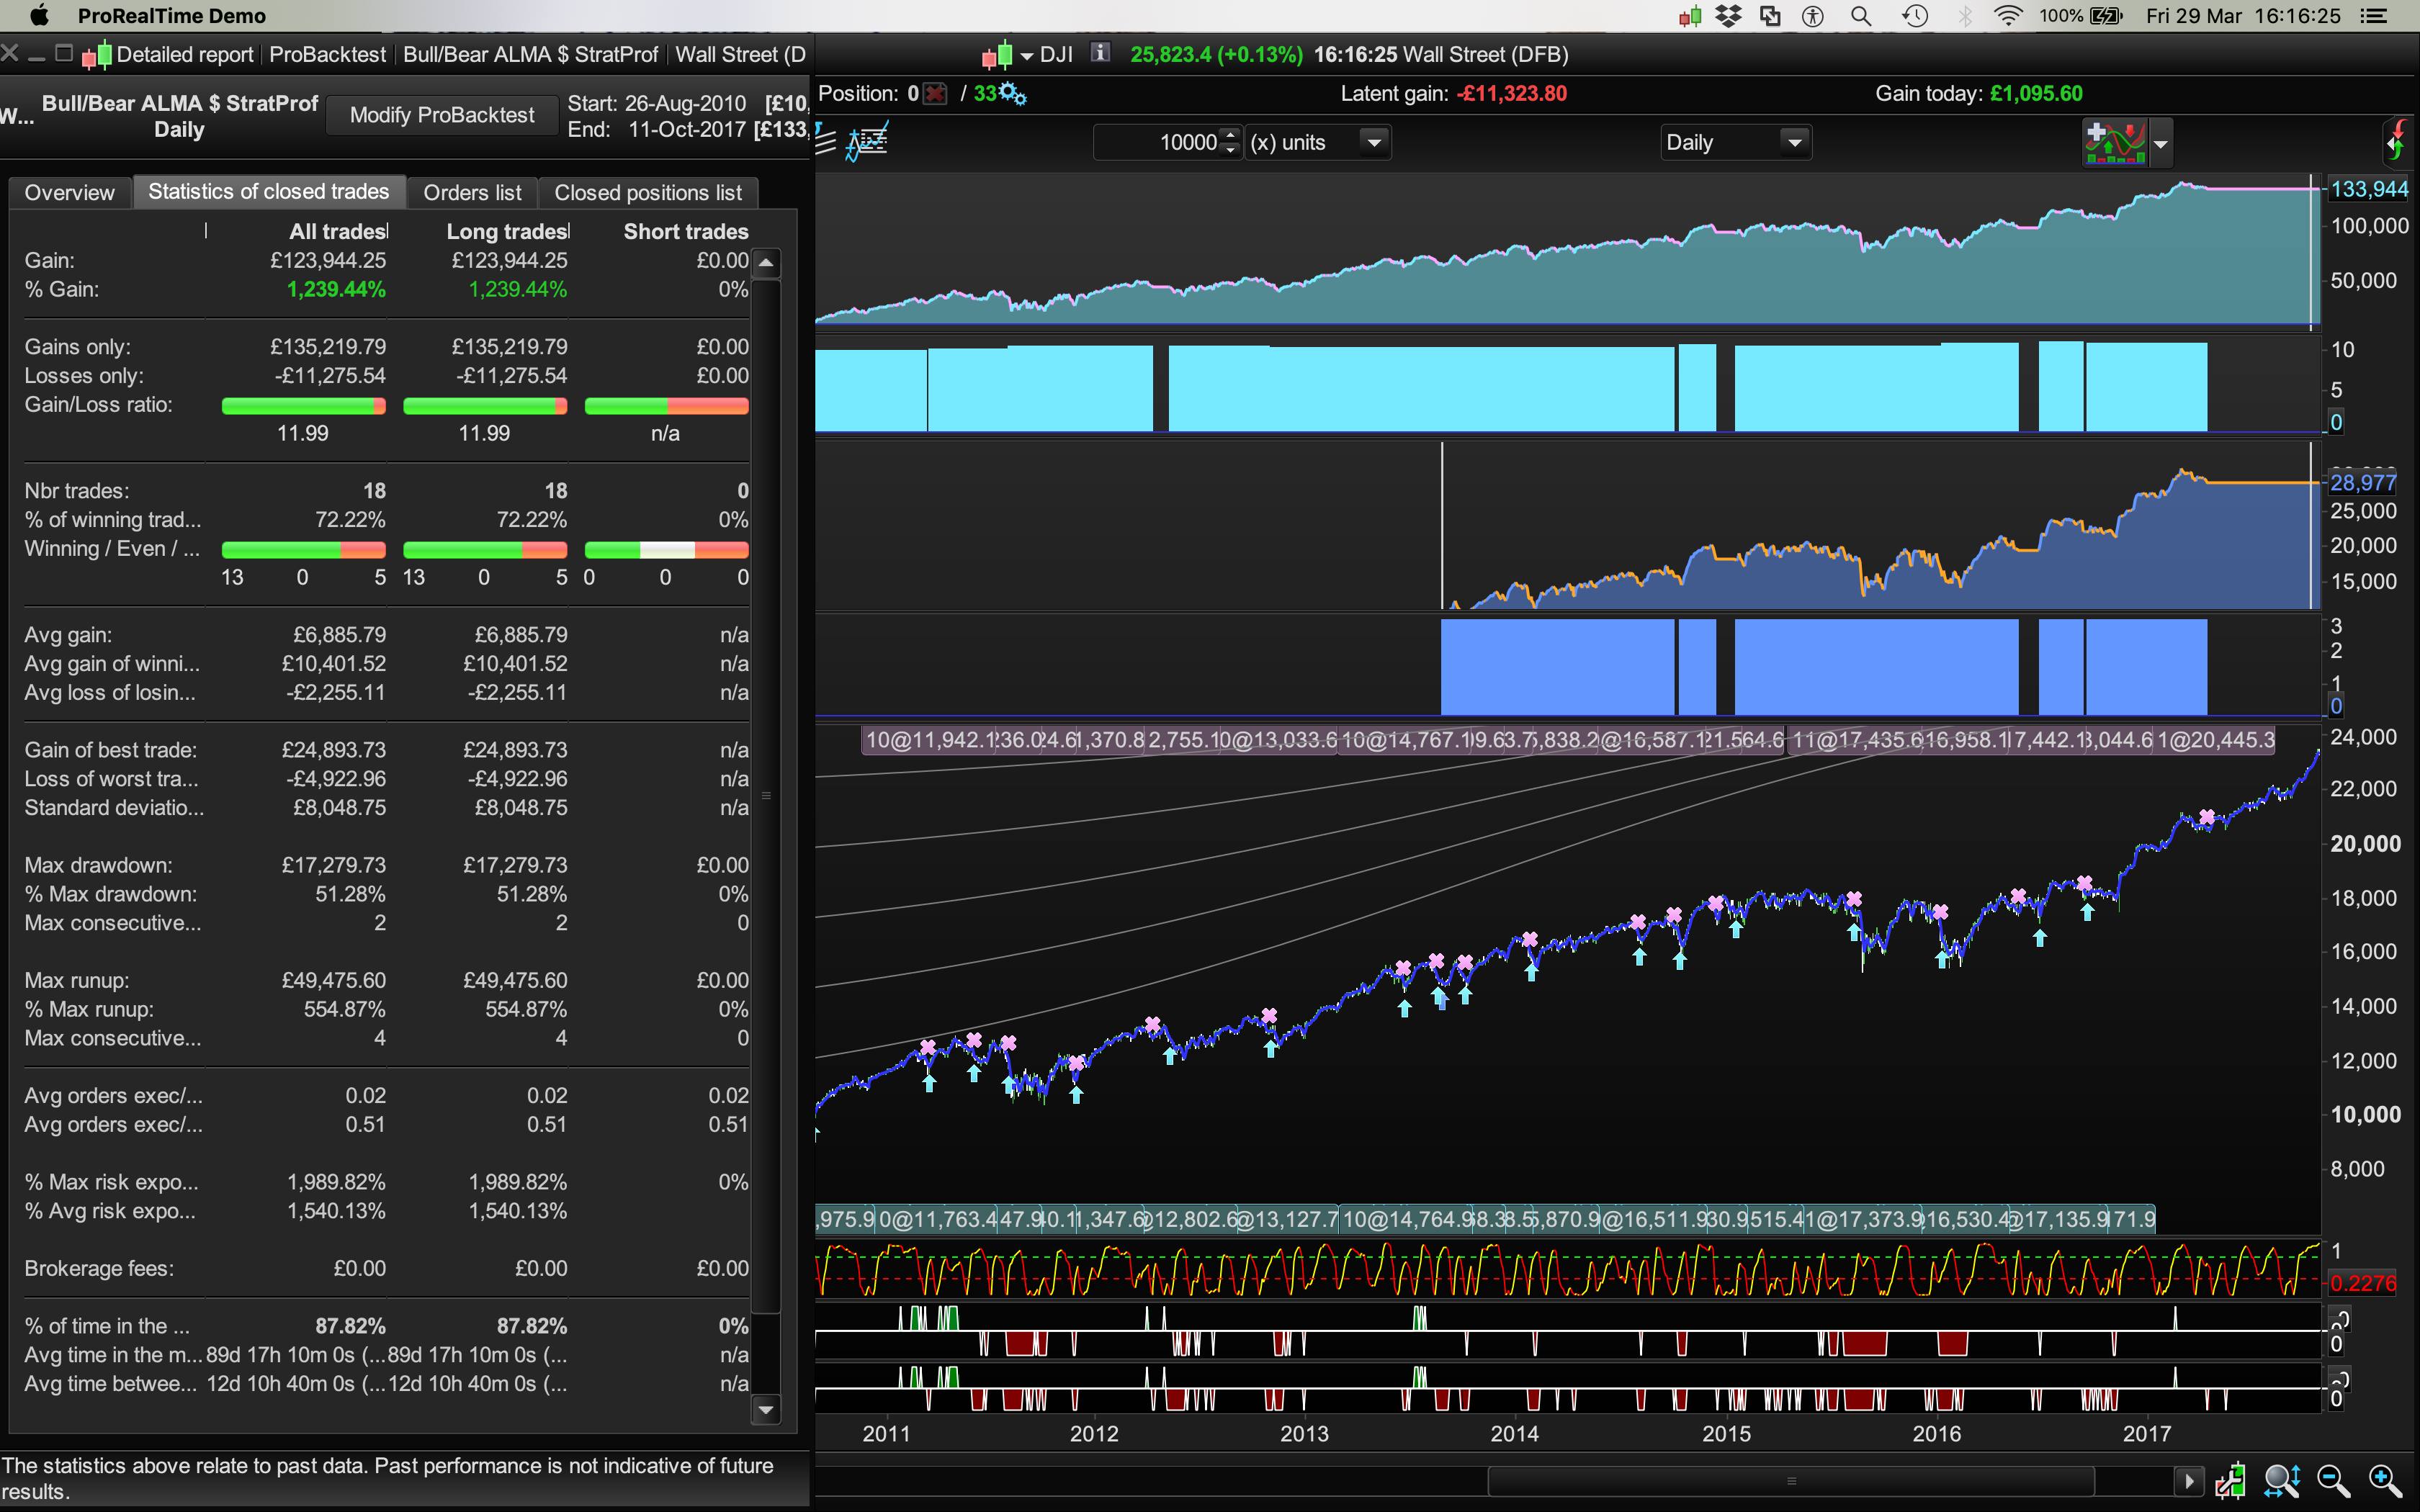
I was actually trying to enter Long AFTER a 3 day Bear Spike Pullback ENDS. The code above is a random accident in an attempt to code it as just described.
Instinctively that’s where I feel the drawdowns can be reduced more through better entry timing. Hooking onto the price after it has plummeted and is already safe and returning back north not heading for possibly more falls as per the system as it currently stands.
So now look at the Drawdown with a wild Dev Stop 6.0 and how it maintains the profits when using this entry:
// Conditions to enter long positions
ignored, indicator1, ignored = CALL "Bull/Bear 20% ALMA"(close)
c1 = (indicator1 = 0) // Bear = -1
ignored, indicator2, ignored = CALL "Bull/Bear 20% ALMA"(close)
c2 = (indicator2[1] = -1)
ignored, indicator3, ignored = CALL "Bull/Bear 20% ALMA"(close)
c3 = (indicator3[2] = -1)
Cheers
Bard