A few observations since posting earlier:
A few small errors have been fixed like making sure all the a1, a2’s have been utilised in the Draw Text code.
I’m not sure the effect of have two sets of a1= etc and a2= etc, and t1= t2= etc overlapping conditions for two different patterns (Abandoned Baby’s and Three Line Strikes) both patterns appear on chart (and when applied as a separate indicator below the price chart) but I have reposted the amended code below with different conditional letters.
I think it’s better to strike out // the Trend Rules to produce more patterns and you can use your own judgement as to the direction of trend. I’ve left the Trend code in with strikes.
Note: 7. Abandoned Baby had two x TrendDown’s.
The Morning Star rules can be relaxed as I see in my code I included a more extreme LongCandle = Body > (RangeSize * 0.9) when I was testing it.
0.7 is fine.
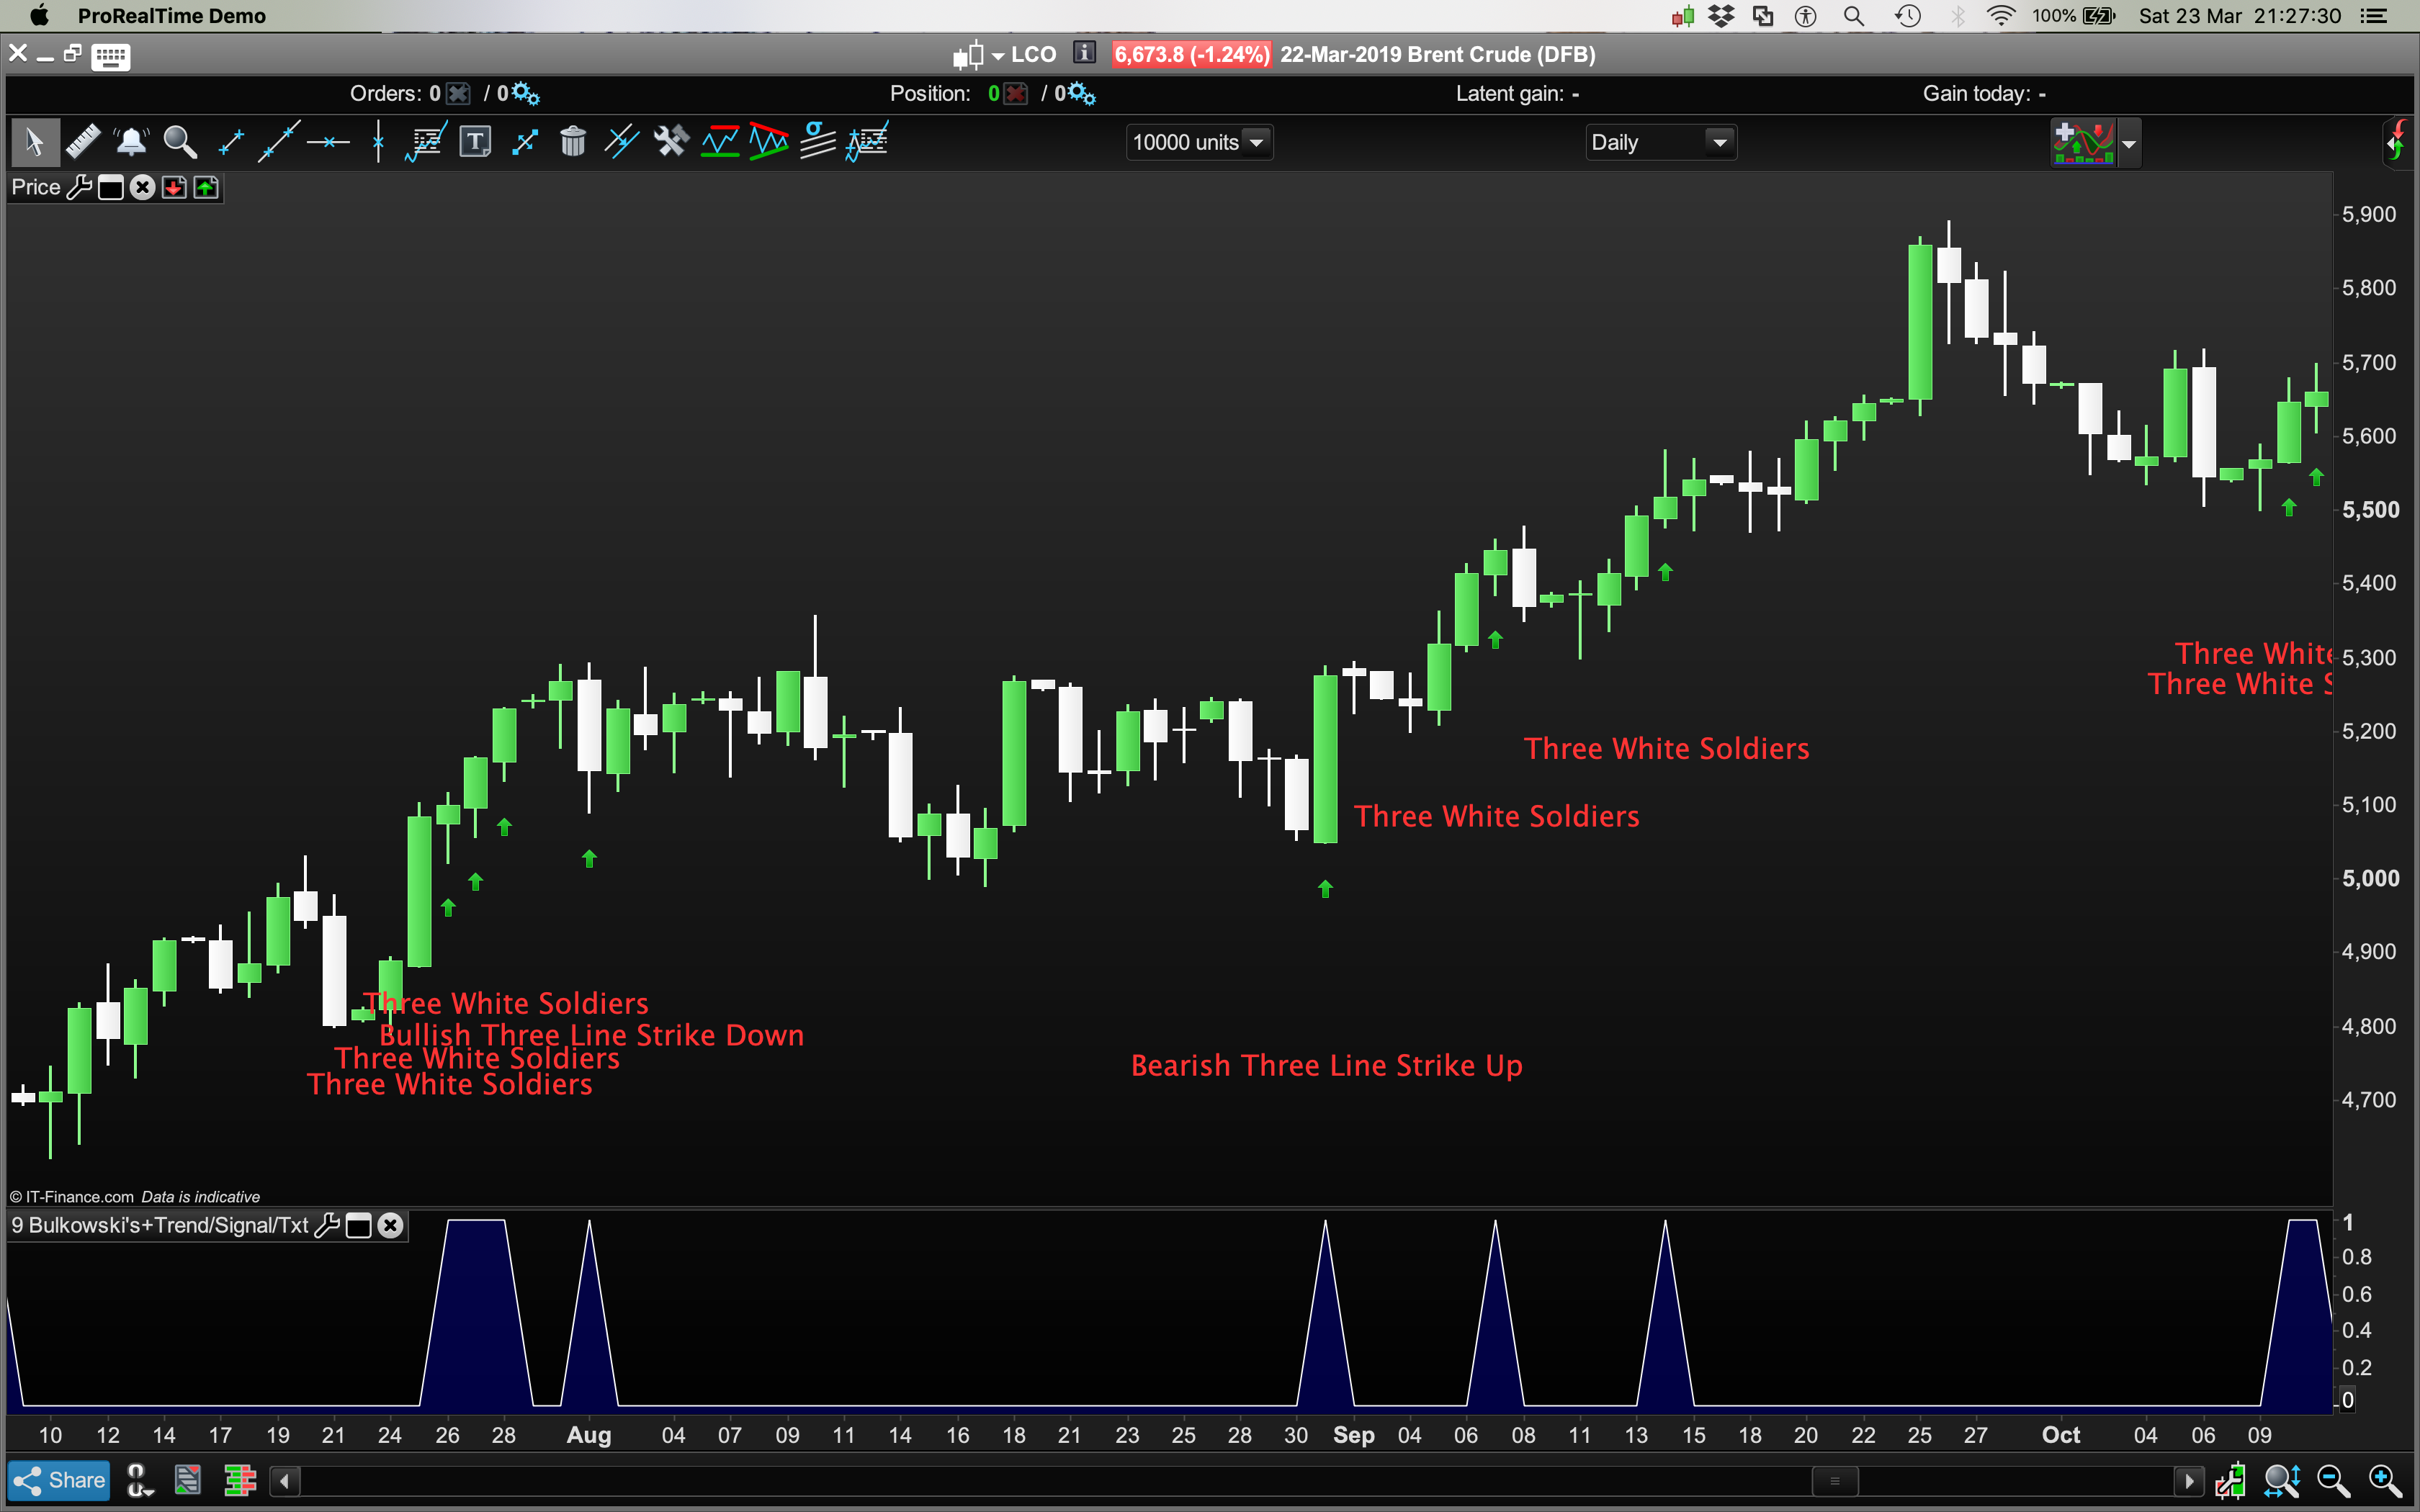
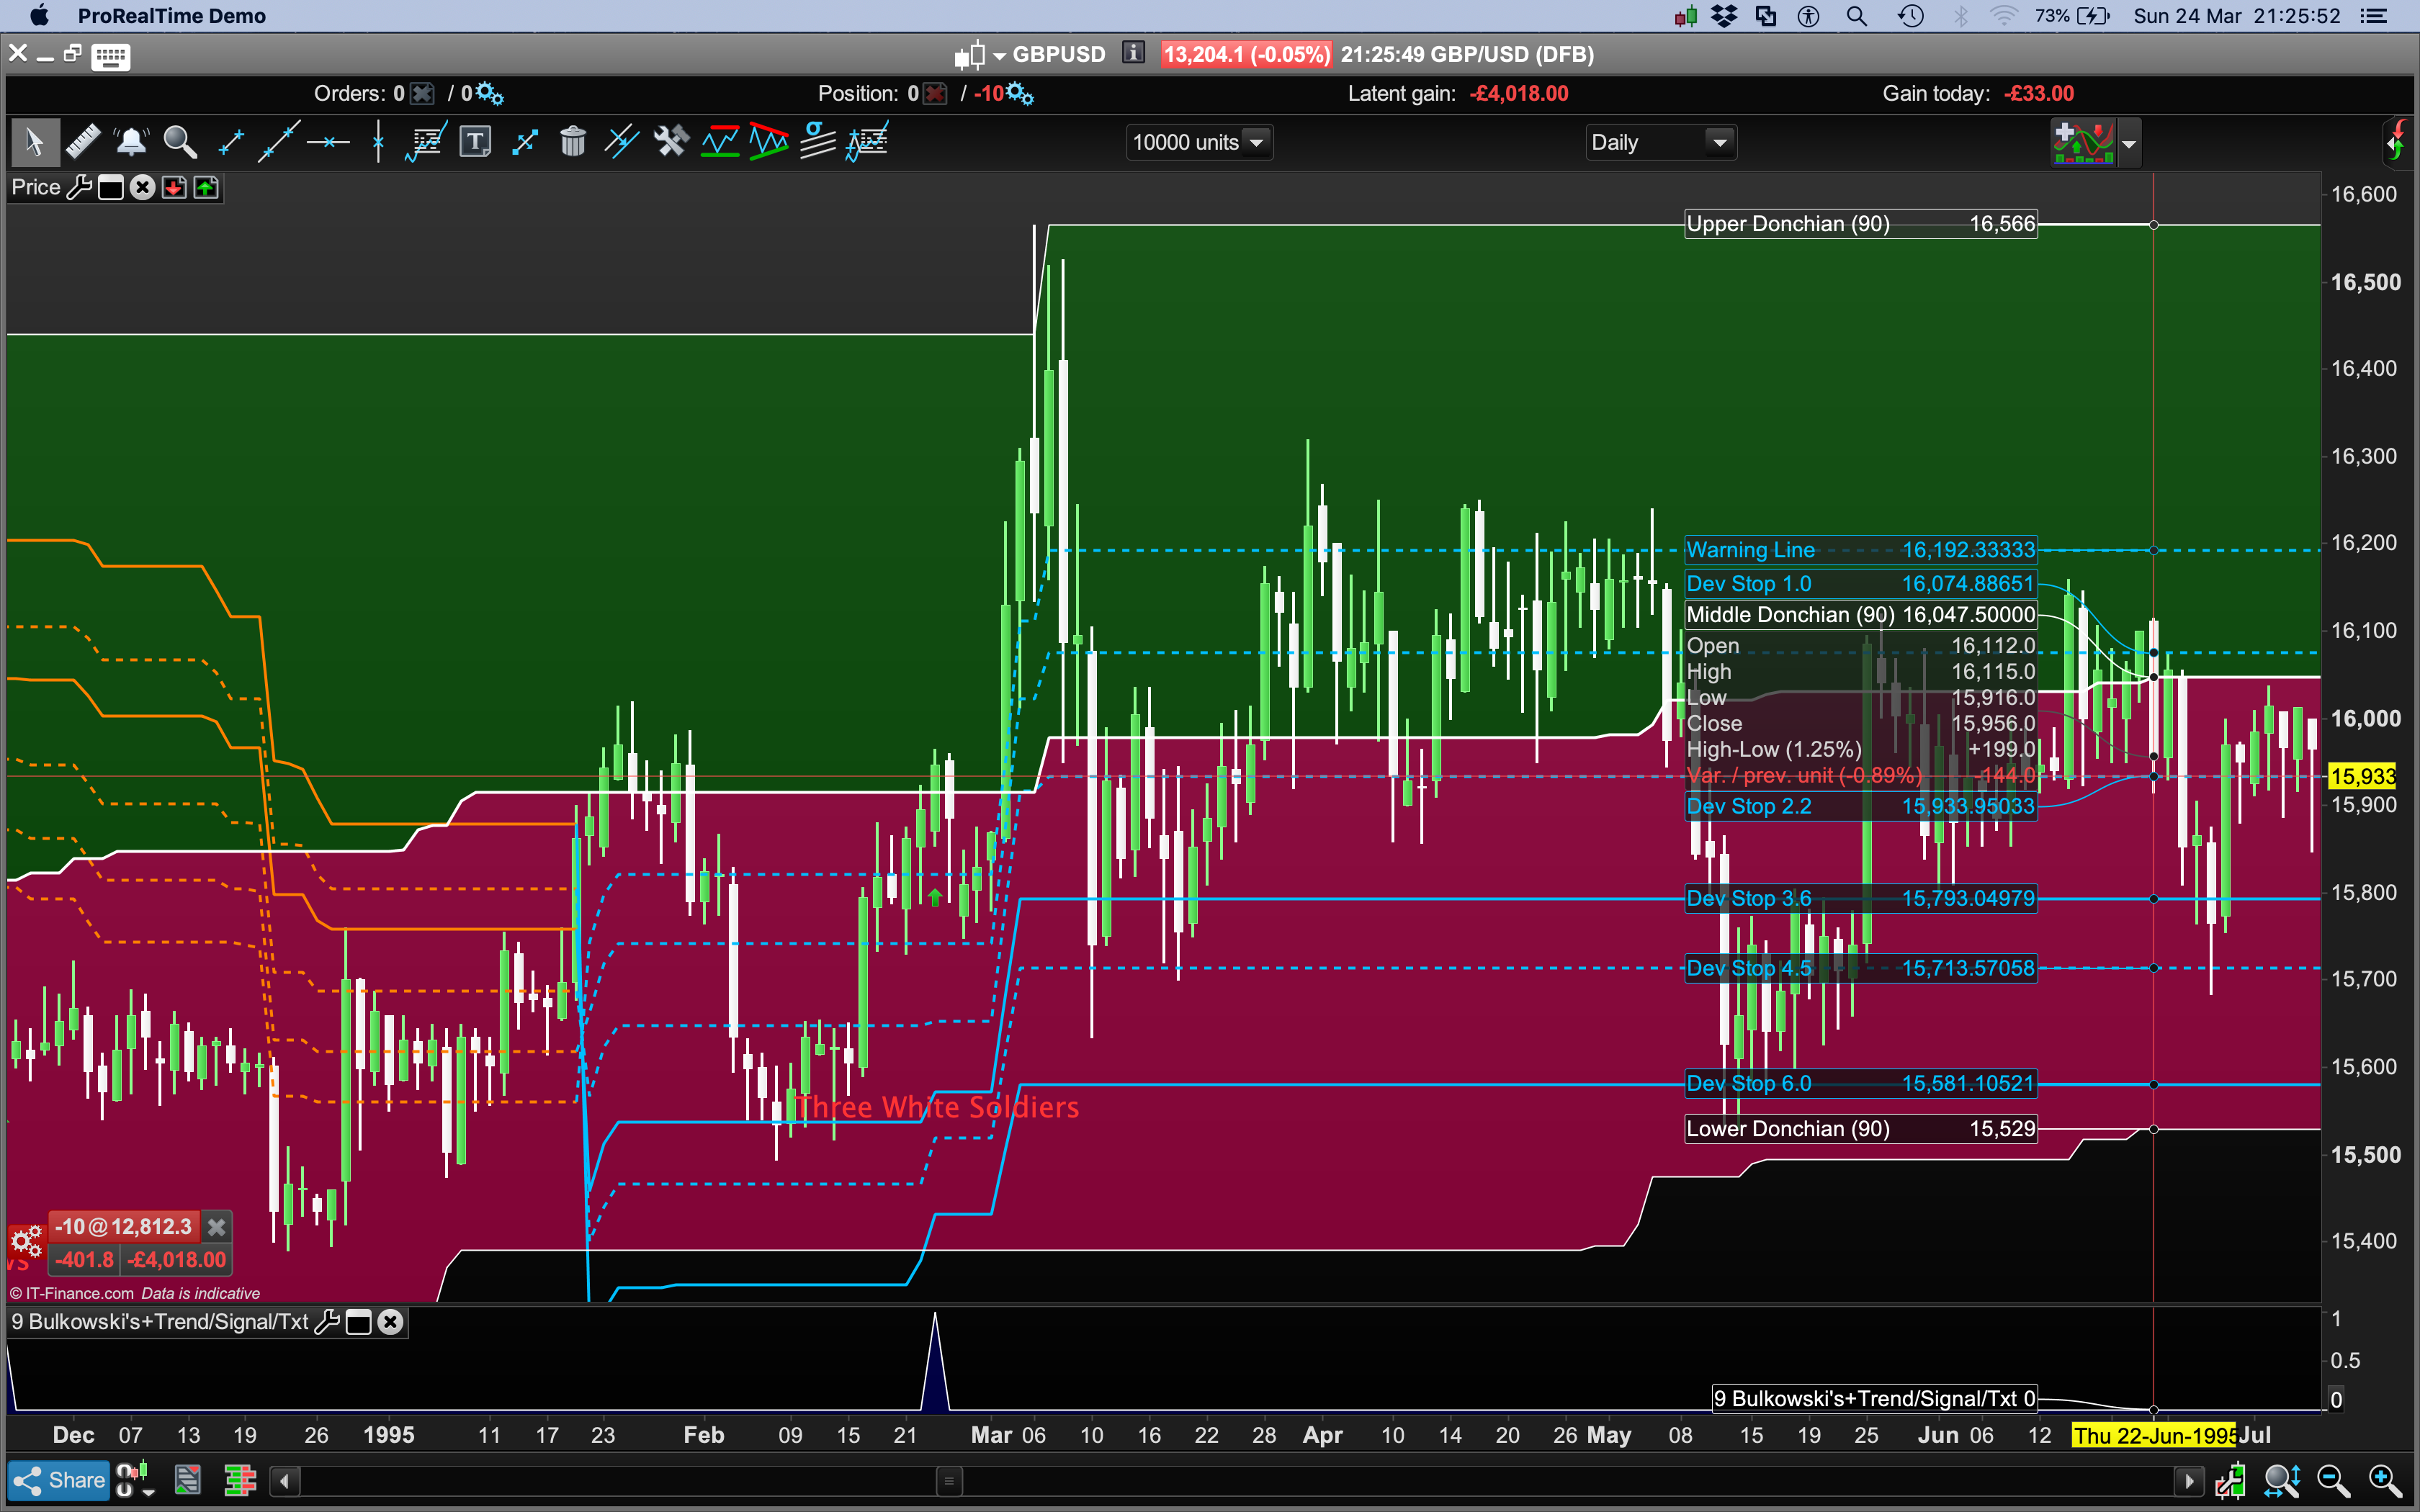
Another addition has been added (that I spotted from my Dropbox pdf link) : Three White Soldiers.
It has strong directional probabilities although performance isn’t always strong post pattern.. better for Scalpers.
(Note: In the Top Movers Screener there are Candlestick pattern and you can set the “Criteria” from “Completed” to “Current.” I can’t vouch for their accuracy in construction/coding or Bulkowski’s performance statistics).
Bulkowski’s Candlestick Descriptions and Performance Statistics can be found on his site:
http://thepatternsite.com
// 9 High Probability Bulkowski Candlestick Patterns
//
// The 9 most powerful classical Candlestick Patterns
// Trend reversal and continuation patterns

// Coded by Violet/Additions by Bard
// 4-12-2017 /23/03/2019
//
// Based on the work of Thomas Bulkowski in his book: "Encyclopedia of Candlestick Charts", 2008
// Read a summary here: https://www.investopedia.com/articles/active-trading/092315/5-most-powerful-candlestick-patterns.asp
//
// This *market-wide screener* works along similar lines as this *fund-specific indicator* in the PRC library list: "Candlestick patterns recognition"

//text color
r = 255
g = 51
b = 51

// DrawText
offset1 = 50 * pipsize
offset2 = offset1 * 6

// Trend direction identification
//(choose 0=No Trend check, 1=MACD, 2=SAR[default], 3=Directional Movement, 4=Moving Averagea crossing)
//TDS=3

//Trend Detection
//if TDS=0 then
//TrendUp=3
//TrendDown=3
//else
//if TDS=1 then
//TrendUp=(MACDline[12,26,9](close)>0 AND MACD[12,26,9](close)>0)
//TrendDown=(MACDline[12,26,9](close)<0 AND MACD[12,26,9](close)<0)
//else
//if TDS=2 then
//TrendUp=(SAR[0.02,0.02,0.2]<low)
//TrendDown=(SAR[0.02,0.02,0.2]>high)
//else
//if TDS=3 then
//TrendUp=(ADX[30]>25 AND DI[30](close)>0) //Default =[14] & >23
//TrendDown=(ADX[30]>25 AND DI[30](close)<0)
//else
//if TDS=4 then
//TrendUp=(Average[3](close)>Average[12](close))
//TrendDown=(Average[3](close)<Average[12](close))
//endif
//endif
//endif
//endif
//endif


//
// Signal codes and pattern types
//**************************************************************************
// Name of pattern                 Type     Direction    Accuracy rate               Bulkowski's Occurrence
//
// -------                         ------------          ------------                ----------
// 1 = BearishThreeLineStrikeUp    Bullish  Reversal     84% Bull Mkt/77% Bear Mkt   truly rare
// 2 = BullishThreeLineStrikeDown  Bearish  Reversal     65% Bull Mkt/83% Bear Mkt   truly rare
// 3 = TwoBlackGappingDown         Bearish  Continuation 68% Bull Mkt/69% Bear Mkt   common
// 4 = ThreeBlackCrows             Bearish  Continuation 78% Bull Mkt/79% Bear Mkt   abody
// 5 = MorningStar                 Bullish  Reversal     78% Bull Mkt/65% Bear Mkt   very low
// 6 = EveningStar                 Bearish  Reversal     72% Bull Mkt/72% Bear Mkt   very low
// 7 = AbandonedBabyBull           Bullish  Reversal     70% Bull Mkt/55% Bear Mkt   low
// 8 = AbandonedBabyBear           Bearish  Reversal     69% Bull Mkt/52% Bear Mkt Bull Continuation low low
// 9 = Three White Soldiers        Bullish  Reversal     82% Bull Mkt/84% Bear Mkt   low
//**************************************************************************

//

BearishThreeLineStrikeUp    = 0 //(s)
BullishThreeLineStrikeDown  = 0 //(t)
TwoBlackGappingDown         = 0 //(b)
ThreeBlackCrows             = 0 //(c)
MorningStar                 = 0 //(m)
EveningStar                 = 0 //(e)
AbandonedBabyBull           = 0 //(d)
AbandonedBabyBear           = 0 //(a)
ThreeWhiteSoldiers          = 0 //(w)

signal                      = 0


//Best Probability in Bull Markets


// 1 - (Three Bears then Up) Bearish Three Line Strike Up *************************************
// Bulkowski accuracy rate 84% in Bull Mkt, 77% in a Bear Mkt, frequency: very rare
s1 = close[3] < open[3]   // candle 4 = red candle
s2 = close[2] < open[2] and low[2] < low[3] and open[2] < open[3] // candle 3 = red candle, lower low & open than previous candle
s3 = close[1] < open[1] and low[1] < low[2] and open[1] < open[2] // candle 2 = red candle and lower low & open than previous candle
s4 = open[0] < low[1]  and close[0] > open[3] // candle 1 = green candle, opens lower than previous candle and closes above open of 4th candle. The candle engulfs the bodies of the three preceding black candles

//if  s1 and s2 and s3 and s4 then //TrendDown[3] AND
////BearishThreeLineStrikeUp = 1
//endif

if s1 and s2 and s3 and s4 then //TrendUp[3] AND
BearishThreeLineStrikeUp = 1
endif

if s1 and s2 and s3 and s4 then //TrendDown[3] AND
DRAWTEXT("Bearish Three Line Strike Up", barindex,low-offset2, Dialog, Standard, 20) COLOURED(R,G,B)
DRAWARROWUP(barindex,low-offset1) COLOURED(0,155,10)
endif

//if  s1 and s2 and s3 and s4 then //TrendUp[3] AND
//DRAWTEXT("Bearish Three Line Strike Up", barindex, high, Dialog, Standard, 20) COLOURED(R,G,B)
//DRAWARROWUP(barindex,low-offset1) COLOURED(0,155,10)
//endif


// 5 Morning Star **************************************************
// Bullish reversal of the downward price trend 78% of the (in a longer term up trend). 65% in a Bear Mkt. Size of price move better in downtrends if time limit of 10 days otherwise uptrends that are left to run are better. Ranked 6th for performance.

//Bearish Pinbar
bearishbody = ABS(open-close)
bearishwick = ABS(high-close)
//bearishnose = ABS(close-low)

Body = abs(close - open) //definition of body
RangeSize = average[50,0](range) //average of the range size of the last 50 candles
LongCandle = Body > (RangeSize * 0.9) //LongCandle is true if the size exceeds a percentage of the average RangeSize
LongCandle2 = Body > (RangeSize * 0.6) //LongCandle is true if the size exceeds a percentage of the average RangeSize
m1 = close[2] < open[2] AND LongCandle // red candle
m2 = open[1] < close[2] and close[1] < close[2] and low[1] < close[2] // candle entirely below predecessor’s body
m3 = close[0] > open[0] and open[0] > open[1] and low[0] < high[1] and LongCandle2 // green candle with a gap
m4 = range[1] < (range[2] / 2 ) // morning star’s range is small compared to preceding candle
m5 = bearishwick/bearishbody < 30/100 // Small Bullish Pinbar/No exhaustion

if  m1 and m2 and m3 and m4 and m5 then //TrendDown[3] AND
MorningStar = 1
endif

//if  m1 and m2 and m3 and m4 and m5 then //TrendUp[3] AND
//MorningStar = 1
//endif

if  m1 and m2 and m3 and m4 and m5 then //TrendDown[3] AND
DRAWTEXT("Morning Star", barindex,low-offset2, Dialog, Standard, 20) COLOURED(R,G,B)
DRAWARROWUP(barindex,low-offset1) COLOURED(0,155,10)
endif

//if  m1 and m2 and m3 and m4 and m5 then //TrendUp[3] AND
//DRAWTEXT("Morning Star", barindex,low-offset2, Dialog, Standard, 20) COLOURED(R,G,B)
//DRAWARROWUP(barindex,low-offset1) COLOURED(0,155,10)
//endif


// 7 - Abandoned baby, Bullish Reversal aka Morning Star but without the flatline of a doji ***********************
// Bulkowski accuracy rate 70%, 55% in a Bear Mkt, frequency: low

d1 = close[2] < open[2]  // red candle
d2 = open[1]  < close[2] and close[1] < close[2] and high[1] < low[2] // candle entirely below predecessor's body
d3 = close[0] > open[0] and low[0] > high[1]  // green candle with a gap
d4 = range[1] > (range[2] / 16 )   // morning star's range is small compared to preceding candle // Default (range[2] / 8 )

if  d1 and d2 and d3 and d4 then //TrendDown[3] AND
AbandonedBabyBull = 1
endif

if  d1 and d2 and d3 and d4 then //TrendDown[3] AND
DRAWTEXT("Abandoned Baby Bull", barindex,low-offset2, Dialog, Standard, 20) COLOURED(R,G,B)
DRAWARROWUP(barindex,low-offset1) COLOURED(0,155,10)
endif


//Best Probability in Bear Markets


// 2 - (Three Bulls then Down) Bullish Three Line Strike Down *************************************
// Bulkowski accuracy rate - bearish reversal 65% of the time in Bull and 83% in Bear, frequency: very rare
t1 = close[3] > open[3]  // candle 4 = green candle
t2 = close[2] > open[2] and high[2] > high[3] and open[2] > open[3] // candle 3 = green candle, higher low & open than previous candle
t3 = close[1] > open[1] and high[1] > high[2] and open[1] > open[2] // candle 2 = green candle and higher low & open than previous candle
t4 = open[0] > low[1]  and close[0] < open[3] // candle 1 = red candle, opens higher than previous candle and closes below open of 4th candle. The candle engulfs the bodies of the three preceding green candles

//if  t1 and t2 and t3 and t4 then //TrendUp[3] AND
//BullishThreeLineStrikeDown = 1
//endif

if  t1 and t2 and t3 and t4 then //TrendDown[3] AND
BullishThreeLineStrikeDown = 1
endif

if t1 and t2 and t3 and t4 then //TrendUp[3] AND
DRAWTEXT("Bullish Three Line Strike Down", barindex,low-offset2, Dialog, Standard, 20) COLOURED(R,G,B)
DRAWARROWUP(barindex,low-offset1) COLOURED(0,155,10)
endif

//if  t1 and t2 and t3 and t4 then //TrendDown[3] AND
////DRAWTEXT("Bullish Three Line Strike Down", barindex, high, Dialog, Standard, 20) COLOURED(R,G,B)
//DRAWARROWUP(barindex,low-offset1) COLOURED(0,155,10)
//endif


// 3 - Bearish Two Black Gapping *************************
// Bulkowski accuracy rate 69% in Bear Mkt, 68% in Bull Mkt, frequency: common
b1 = close[1] < open[1]  // red candle
b2 = close[0] < open[0]  // followed by another red candle
b3 = high[0]  < low[1]   // with a down gap in between

//if   b1 and b2 and b3 then //TrendUp[3] AND
//TwoBlackGappingDown = 1
//endif

if  b1 and b2 and b3 then //TrendDown[3] AND
TwoBlackGappingDown = 1
endif

//if  b1 and b2 and b3 then //TrendUp[3] AND
//DRAWTEXT("Two Black Gapping Down", barindex,low-offset2, Dialog, Standard, 20) COLOURED(R,G,B)
//DRAWARROWUP(barindex,low-offset1) COLOURED(0,155,10)
//endif

if  b1 and b2 and b3 then //TrendDown[3] AND
DRAWTEXT("Two Black Gapping Down", barindex,low-offset2, Dialog, Standard, 20) COLOURED(R,G,B)
DRAWARROWUP(barindex,low-offset1) COLOURED(0,155,10)
endif


// 4 - Three Black Crows *********************************
// Bulkowski accuracy rate 78% in Bull Mkt, 79% Bear Mkt frequency: very common
c1 = close[2] < open[2]
c2 = close[1] < open[1] and close[1] < low[2]
c3 = close[0] < open[0] and close[0] < low[1]
// Closing prices are less than 1/3 from lows
c4 = abs(close[2] -low[2]) < range[2] / 3
c5 = abs(close[1] -low[1]) < range[1] / 3
c6 = abs(close[0] -low[0]) < range[0] / 3

if c1 and c2 and c3 and c4 and c5 and c6 then
ThreeBlackCrows = 1 //TrendDown[3] AND
endif

//if c1 and c2 and c3 and c4 and c5 and c6 then
//ThreeBlackCrows = 1 //TrendUp[3] AND
//endif

//if c1 and c2 and c3 and c4 and c5 and c6 then
//DRAWTEXT("Three Black Crows", barindex,low-offset2, Dialog, Standard, 20) COLOURED(R,G,B)
//DRAWARROWUP(barindex,low-offset1) COLOURED(0,155,10) //TrendUp[3] AND
//endif

if c1 and c2 and c3 and c4 and c5 and c6 then
DRAWTEXT("Three Black Crows", barindex,low-offset2, Dialog, Standard, 20) COLOURED(R,G,B)
DRAWARROWUP(barindex,low-offset1) COLOURED(0,155,10) // TrendDown[3] AND
endif


// 6 Evening Star **************************************************
// Bulkowski accuracy rate 72% in Bull and 72% Bear Mkt, frequency low
e1 = close[2] > open[2]  // green candle
e2 = open[1] > close[2] and close[1] > close[2] and low[1] > close[2] // candle entirely above predecessor's body
e3 = close[0] < open[0] and high[0] < low[1]  // red candle with a gap
e4 = range[1] < (range[2] / 2 )   // evening star's range is small compared to preceding candle

if  e1 and e2 and e3 and e4 then //TrendDown[3] AND
EveningStar = 1
endif

//if  e1 and e2 and e3 and e4 then //TrendUp[3] AND
//endif

//if  e1 and e2 and e3 and e4 then //TrendUp[3] AND
//DRAWTEXT("Evening Star", barindex,low-offset2, Dialog, Standard, 20) COLOURED(R,G,B)
//DRAWARROWUP(barindex,low-offset1) COLOURED(0,155,10)
//endif

if  e1 and e2 and e3 and e4 then //TrendDown[3] AND
DRAWTEXT("Evening Star", barindex,low-offset2, Dialog, Standard, 20) COLOURED(R,G,B)
DRAWARROWUP(barindex,low-offset1) COLOURED(0,155,10)
endif


// 8 - Abandoned baby, Bearish Reversal aka Evening Star but with the flatline of a doji. Trend doesn't last long ***********************
// Bulkowski accuracy rate in Bull Mkt 69%, 52% in a Bear Mkt, frequency: low
a1 = close[2] > open[2]  // green candle
a2 = open[1] > close[2] and close[1] > close[2] and low[1] > high[2] // candle entirely above predecessor's body
a3 = close[0] < open[0] and low[1] > high[0]  // red candle with a gap
a4 = range[1] > (range[2] / 16 )   // range is small compared to preceding candle // Default (range[2] / 8 )

if  a1 and a2 and a3 and a4 then //TrendDown[3] AND
AbandonedBabyBear = 1
endif

//if a1 and a2 and a3 and a4 then //TrendUp[3] AND
//DRAWTEXT("Abandoned Baby Bear", barindex,low-offset2, Dialog, Standard, 20) COLOURED(R,G,B)
//DRAWARROWUP(barindex,low-offset1) COLOURED(0,155,10)
//endif


// 9 - Three White Soldiers, Bullish Reversal. Price does not trend all that well after the breakout. Performance after formation not strong ***********************
// Bulkowski accuracy rate in Bull Mkt 82%, 84% in a Bear Mkt, frequency: low
body=close-open
w1 = body[2]>0 and body[1]>0 and body>0
w2 = high[1]>high[2] and high>high[1]
w3 = close[1]>close[2] and close>close[1]
w4 = open[1]>open[2] and open[1]<close[2] and open>open[1] and open<close[1]

if  w1 and w2 and w3 and w4 then //TrendDown[3] AND
ThreeWhiteSoldiers = 1
endif

if  w1 and w2 and w3 and w4 then
DRAWTEXT("Three White Soldiers", barindex,low-offset2, Dialog, Standard, 20) COLOURED(R,G,B)
DRAWARROWUP(barindex,low-offset1) COLOURED(0,155,10)
endif


// Results ******************
if BearishThreeLineStrikeUp then
signal = 1
elsif BullishThreeLineStrikeDown then
signal = 2
elsif TwoBlackGappingDown then
signal = 3
elsif ThreeBlackCrows then
signal = 4
elsif MorningStar then
signal = 5
elsif EveningStar then
signal = 6
elsif AbandonedBabyBull then
signal = 7
elsif AbandonedBabyBear then
signal = 8
elsif ThreeWhiteSoldiers then
signal = 9
endif


//
// Pattern types
//**************************
//Type = Name of pattern
//----   -------------------
//   1 = BearishThreeLineStrikeUp
//   2 = BullishThreeLineStrikeDown
//   3 = TwoBlackGappingDown
//   4 = ThreeBlackCrows
//   5 = MorningStar
//   6 = EveningStar
//   7 = AbandonedBabyBull
//   8 = AbandonedBabyBear
//   9 = ThreeWhiteSoldiers
//**************************
//

Return signal > 0