Screener breakout swing tie highs and lows in 1 min

Viewing 15 posts - 1 through 15 (of 31 total)
  • Author
    Posts
  • #252624 quote
    TheMik
    Participant
    Junior

    Hello, I’m new to ProRealTime and already see how powerful it is. I’d like help creating a breakout screener to find symbols that may be ready to break out. Maybe such an indicator already exists or something close that I can build on.

    Goal: detect setups where price forms equal swing highs or lows (potential breakout zones).

    This would be used for stocks.

    Requirements:

    • Scan on 1-minute timeframe
    • Use only today’s session, starting from premarket
    • Define a swing point (“peak”):
    • High peak: highest high vs 3 bars left and right
    • Low peak: lowest low vs 3 bars left and right
    • Confirm after 3 bars to the right (detection delay)
    • Equal high/low detection:
    • Round prices to 2 decimals (e.g. 216.351 → 216.35)
    • Group peaks by rounded price
    • Plot horizontal lines where 2 or more equal peaks occur
    • Detect only unbroken grouped peaks (price hasn’t crossed the line yet)


    There could be 3 or even more equal swings, which I would want to screen for, but for now just start with 2My goal is to automatically identify symbols on the chart that have unbroken equal highs or lows, which could signal potential future breakouts if the setup is valid — without manually checking too many symbols on a such small timeframe.

    This is how pattern look like visually what screener must find ( attached screenshots)

    example2-.png example2-.png example4.png example4.png example3.png example3.png 3-candles-left.png 3-candles-left.png
    #252645 quote
    robertogozzi
    Moderator
    Master
    This is the indicator that plots GEEN and RED arrows:
    N          = 0.02 * Pipsize
    Peak1      = (high[3] > high[4]) AND (high[4] > high[5]) AND (high[5] > high[6])
    Peak2      = (high < high[1]) AND (high[1] < high[2]) AND (high[2] < high[3])
    Peak       = Peak1 AND Peak2
    PeakSignal = 0
    IF Peak THEN
       PeakHigh = high[3]
       PeakhBar = BarIndex[3*2]
       IF round(abs(PeakHigh - PeakHigh[1]),2) <= N THEN
          PeakSignal = max(PeakHigh,PeakHigh[1])
       ENDIF
    ENDIF
    Trough1      = (low[3] < low[4]) AND (low[4] < low[5]) AND (low[5] < low[6])
    Trough2      = (low > low[1]) AND (low[1] > low[2]) AND (low[2] > low[3])
    Trough       = Trough1 AND Trough2
    TroughSignal = 0
    IF Trough THEN
       TroughLow = low[3]
       TroughBar = BarIndex[3*2]
       IF round(abs(TroughLow - TroughLow[1]),2) <= N THEN
          TroughSignal = min(TroughLow,TroughLow[1])
       ENDIF
    ENDIF
    IF PeakSignal THEN
       DrawArrowDOWN(BarIndex[3],PeakSignal + Range[2])     coloured("Red")
       DrawSegment(BarIndex,PeakSignal,PeakhBar,PeakSignal) style(line,2) coloured("Red")
    ELSIF TroughSignal THEN
       DrawArrowUP(BarIndex[3],TroughSignal - Range[2]) coloured("Green")
       DrawSegment(BarIndex,TroughSignal,TroughBar,TroughSignal) style(line,2) coloured("Green")
    ENDIF
    RETURN
    please check whether the arrows are plotted correctly. This is the screener:
    N          = 0.02 * Pipsize
    Peak1      = (high[3] > high[4]) AND (high[4] > high[5]) AND (high[5] > high[6])
    Peak2      = (high < high[1]) AND (high[1] < high[2]) AND (high[2] < high[3])
    Peak       = Peak1 AND Peak2
    Signal     = 0
    IF Peak THEN
       PeakHigh = high[3]
       IF round(abs(PeakHigh - PeakHigh[1]),2) <= N THEN
          Signal = 2
       ENDIF
    ENDIF
    Trough1      = (low[3] < low[4]) AND (low[4] < low[5]) AND (low[5] < low[6])
    Trough2      = (low > low[1]) AND (low[1] > low[2]) AND (low[2] > low[3])
    Trough       = Trough1 AND Trough2
    IF Trough THEN
       TroughLow = low[3]
       IF round(abs(TroughLow - TroughLow[1]),2) <= N THEN
          Signal = 1
       ENDIF
    ENDIF
    SCREENER[Signal AND (high <> low)](Signal AS "1=Up,2=Down")
    Iván González thanked this post
    #257870 quote
    TheMik
    Participant
    Junior

    Hello, thanks for your reply.

    I first tried the indicator, but most of the time it doesn’t show anything on the chart. I even select charts with equal highs or lows on purpose, but the indicator doesn’t detect them. It only shows levels occasionally, and when it does, they don’t look correct or make sense. ( i atached screnshot)

    I also tried the screener. Sometimes it finds one or two stocks, but I’m scanning all NASDAQ stocks — so that can’t be right, since there should always be some stocks with equal highs or lows.

    so something wrong with indicator and screener.

    I’m also not a professional programmer, and when I code I usually do it with the help of Claude. That’s how I was able to create indicators in TradingView, but i have limitations with TV, so this is why i try to use PRT here. To see if I can create screener there.

    I would send a little longe explanation about what is my requirements, maybe someone can help here:

    Understood: your core goal is only the screener.

    Here is a very short spec you can paste that focuses purely on the screener side.

    Goal

    Create a ProScreener that, on a 1‑minute timeframe, finds symbols which today have at least one unbroken equal swing high or equal swing low at exact 1‑cent precision.

    Swing logic (inside screener)

    • Work on 1‑minute intraday data.
    • Only use bars where day == today (new calendar day = fresh start).
    • Swing high at bar X:
    • high[X] > high[X‑1], high[X‑2], high[X‑3]
    • high[X] > high[X+1], high[X+2], high[X+3]
    • Confirm the swing with a 3‑bar delay (central bar is X).
    • Swing low at bar X:
    • low[X] < low[X‑1], low[X‑2], low[X‑3]
    • low[X] < low[X+1], low[X+2], low[X+3]
    • Same 3‑bar confirmation.

    Equal highs / equal lows (strict 1 cent)

    • For each confirmed swing today, compute roundedPrice = round(swingPrice, 2).
    • Equal high: at least 2 swing highs today with the same rounded high.
    • Equal low: at least 2 swing lows today with the same rounded low.
    • No tolerance: prices must be exactly equal after rounding to 2 decimals.

    Unbroken condition (up to “now”)

    • Level price = L.
    • For an equal high level:
    • After the last swing high that formed that level, no bar’s high is allowed to be > L (any wick above L breaks it).
    • For an equal low level:
    • After the last swing low that formed that level, no bar’s low is allowed to be < L (any wick below L breaks it).
    • Broken levels must not count for the screener.

    What the screener should return

    For each symbol, the screener should:

    • Scan today’s intraday data.
    • Detect all 3‑left / 3‑right swings with 3‑bar delay.
    • Identify equal‑price swing groups at 1‑cent precision.
    • Check if at least one equal‑high or equal‑low level is still unbroken now.
    • Output 1 (keep symbol) if there is at least one unbroken equal high or unbroken equal low today according to these rules; otherwise 0.


    How dificult to create such screener in ProRealTime – or is it even possible?


    Zrzut-ekranu-2026-02-11-165025.png Zrzut-ekranu-2026-02-11-165025.png Zrzut-ekranu-2026-02-11-185158.png Zrzut-ekranu-2026-02-11-185158.png Zrzut-ekranu-2026-02-11-185533.png Zrzut-ekranu-2026-02-11-185533.png Zrzut-ekranu-2026-02-11-190452.png Zrzut-ekranu-2026-02-11-190452.png Zrzut-ekranu-2026-02-11-191141.png Zrzut-ekranu-2026-02-11-191141.png Zrzut-ekranu-2026-02-11-191933.png Zrzut-ekranu-2026-02-11-191933.png
    #257886 quote
    robertogozzi
    Moderator
    Master

    It is possible.

    A swing is made by the current bar reversing the direction, while the prior bar was in the opposite direction and one of the two swing bars must have hit a N-period highest/lowest price. If you do not agree with this, please specify it.

    As to “Equal high: at least 2 swing highs today with the same rounded high” (the other way round, as well) do you mean the two swing highs/lows should be consecutive?

    As to “After the last swing high that formed that level“, that level is the CLOSE, or else?


    #257890 quote
    Nicolas
    Keymaster
    Master

    This is below the first draft to find and plot the segments between equal rounded price only in the current day.

    Now I have to detect the breakout above or below to unset those segments.

    DXSXXXX_8-1-second.png DXSXXXX_8-1-second.png
    #257895 quote
    Nicolas
    Keymaster
    Master

    The below code version plot segments between 2 tops or 2 bottoms only if price hasn’t breakout yet.

    Please confirm the tops and bottoms detection before going further.

    defparam drawonlastbaronly=false
    
    if day<>day[1] or intradaybarindex=0 then
       unset($peak)
       unset($peakbar)
       unset($trough)
       unset($troughbar)
       i=0
       j=0
    endif
    
    Peak1      = (high[3] > high[4]) AND (high[3] > high[5]) AND (high[3] > high[6])
    Peak2      = (high[3] > high[2]) AND (high[3] > high[1]) AND (high[3] > high[0])
    Peak       = Peak1 AND Peak2
    if peak then
       // drawpoint(barindex[3],high[3],2) coloured("cyan")
       $peak[i]=high[3]
       $peakbar[i]=barindex[3]
       i=i+1
    endif
    
    Trough1      = (low[3] < low[4]) AND (low[3] < low[5]) AND (low[5] < low[6])
    Trough2      = (low[3] < low[2]) AND (low[3] < low[1]) AND (low[3] < low[0])
    Trough       = Trough1 AND Trough2
    if Trough   then
       //drawpoint(barindex[3],low[3],2) coloured("crimson")
       $trough[j]=low[3]
       $troughbar[j]=barindex[3]
       j=j+1
    endif
    
    if islastbarupdate then
       if i>0 then
          for k = 0 to i-1 do
             drawpoint($peakbar[k], $peak[k],2) coloured("cyan")
             for l = 0 to i-1 do
                if $peakbar[l]<>$peakbar[k] then
                   diff = abs(round($peak[l],2) - round($peak[k],2))
                   if diff = 0 then //equal price
                      //find breakout
                      period = max(1,max($peakbar[l],$peakbar[k]) - min($peakbar[l],$peakbar[k]))
                      decay = max(1,barindex-max($peakbar[l],$peakbar[k]))
                      hh = highest[period](high)[decay]
                      //drawpoint(max($peakbar[l],$peakbar[k]),hh,5) coloured("green")
                      if hh<=max($peak[l],$peak[k]) then //no breakout at that time
                         drawsegment($peakbar[l],$peak[l], $peakbar[k], $peak[k]) coloured("cyan")
                      endif
                   endif
                endif
             next
          next
          
       endif
       
       if j>0 then
          for k = 0 to j-1 do
             drawpoint($troughbar[k], $trough[k],2) coloured("crimson")
             for l = 0 to i-1 do
                if $troughbar[l]<>$troughbar[k] then
                   diff = abs(round($trough[l],2) - round($trough[k],2))
                   if diff = 0 then //equal price
                      //find breakout
                      period = max(1,max($troughbar[l],$troughbar[k]) - min($troughbar[l],$troughbar[k]))
                      decay = max(1,barindex-max($troughbar[l],$troughbar[k]))
                      ll = lowest[period](low)[decay]
                      if ll>=min($trough[l],$trough[k]) then //no breakout at that time
                         drawsegment($troughbar[l],$trough[l], $troughbar[k], $trough[k]) coloured("crimson")
                      endif
                      
                   endif
                endif
             next
          next
       endif
       
    endif
    
    return //period, decay coloured("orange")
    

    Please note that the points and segments are plotted only for the current day. So if any tops or bottoms are not equal (rounded 2 digits) during the day, nothing is plotted. If you have any valid examples please post them.

    robertogozzi thanked this post
    no-breakout-detection.png no-breakout-detection.png
    #257907 quote
    TheMik
    Participant
    Junior

    Hi Roberto,

    Thanks for confirming it’s possible!

    Regarding your questions:

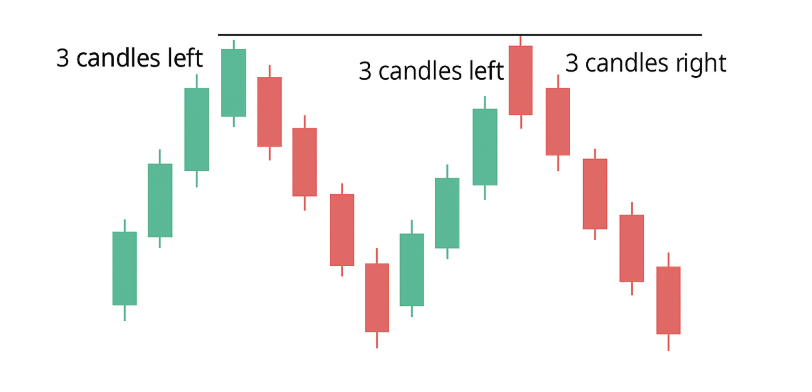
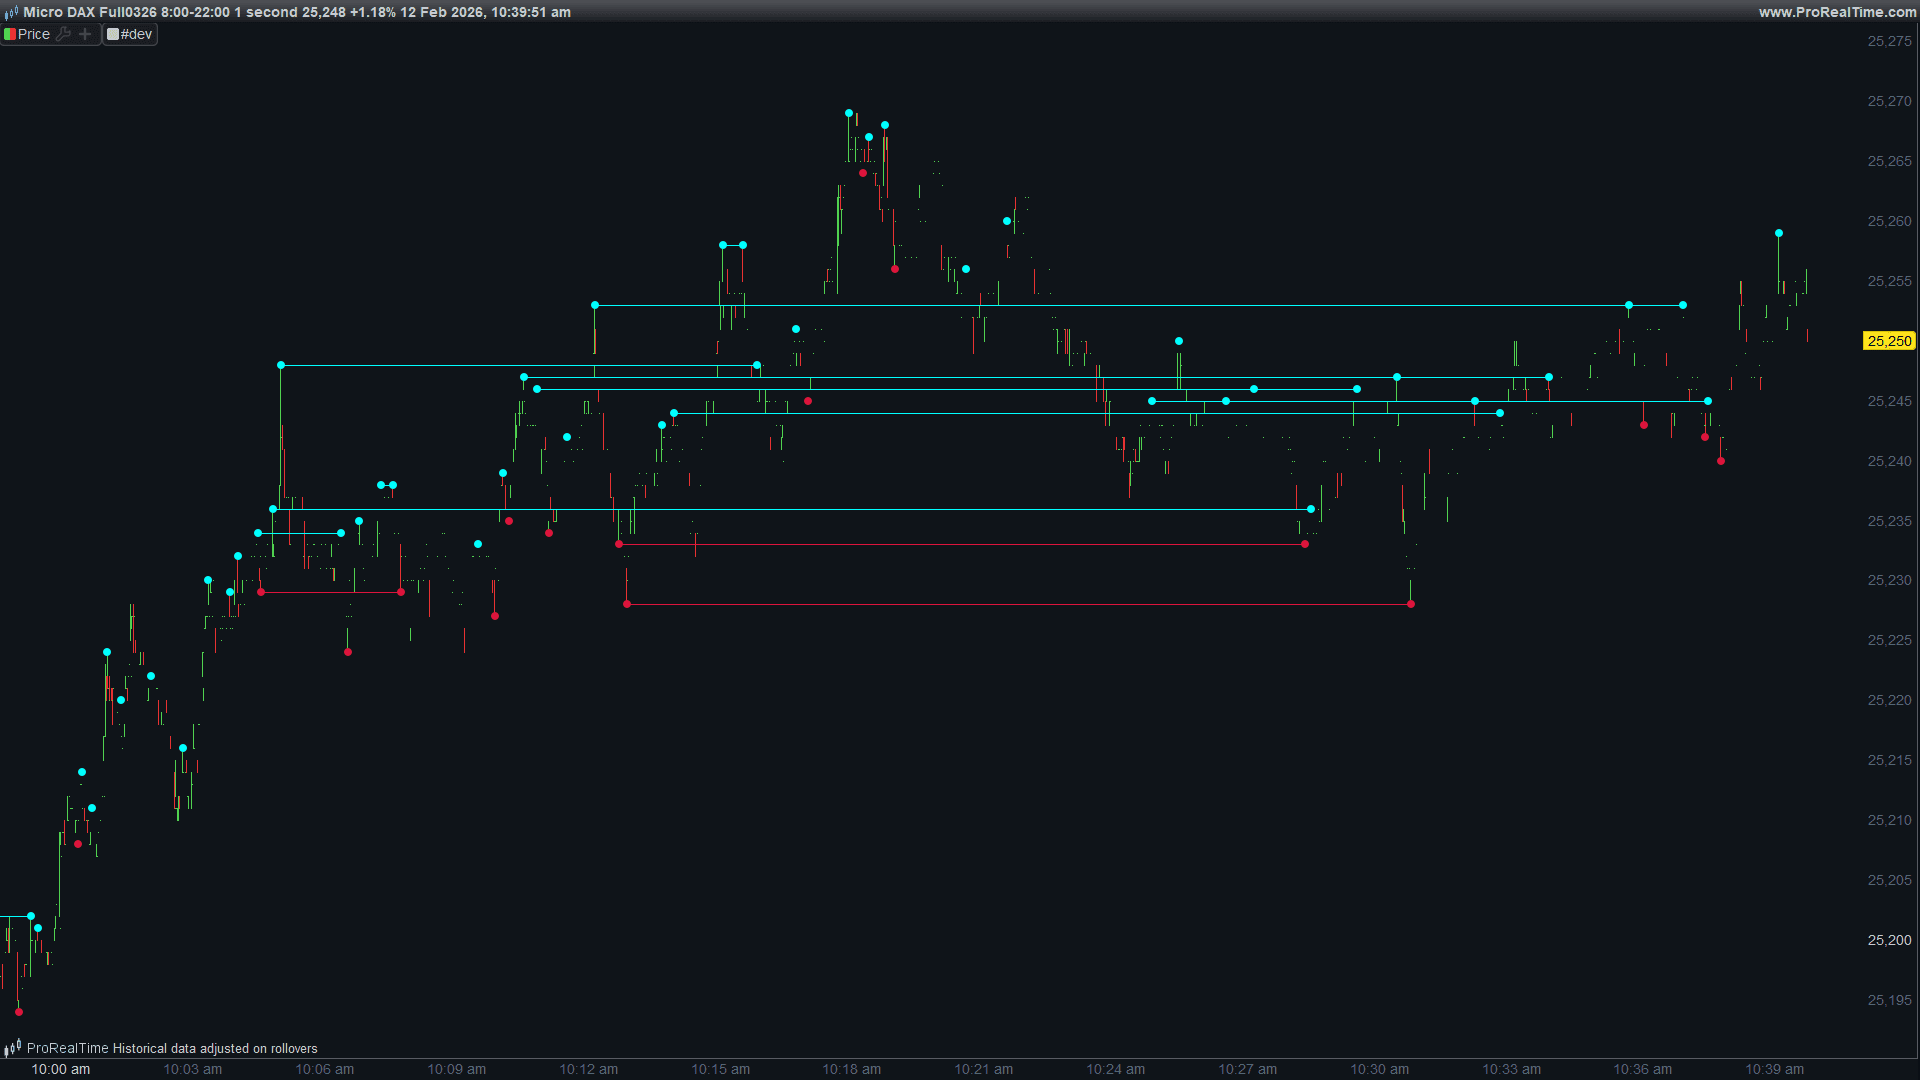
    1- Swing definition: Your definition isn’t quite what I need. I want a 3-left/3-right pattern where:

    • Swing high: The high at bar X must be greater than the highs of the 3 bars to its left AND the 3 bars to its right
    • Swing low: The low at bar X must be lower than the lows of the 3 bars to its left AND the 3 bars to its right

    There is no matter direction of candle, close green or red – doesn’t matter. only highs and lows matter.

    2- No consecutive swings:  the equal swing highs/lows do not need to be consecutive. They can occur anywhere during today’s session.

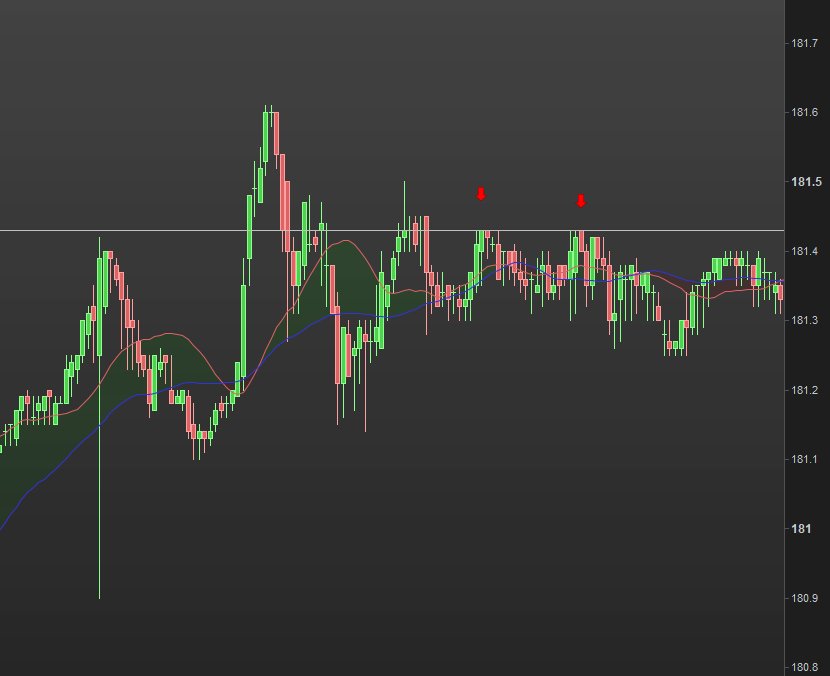
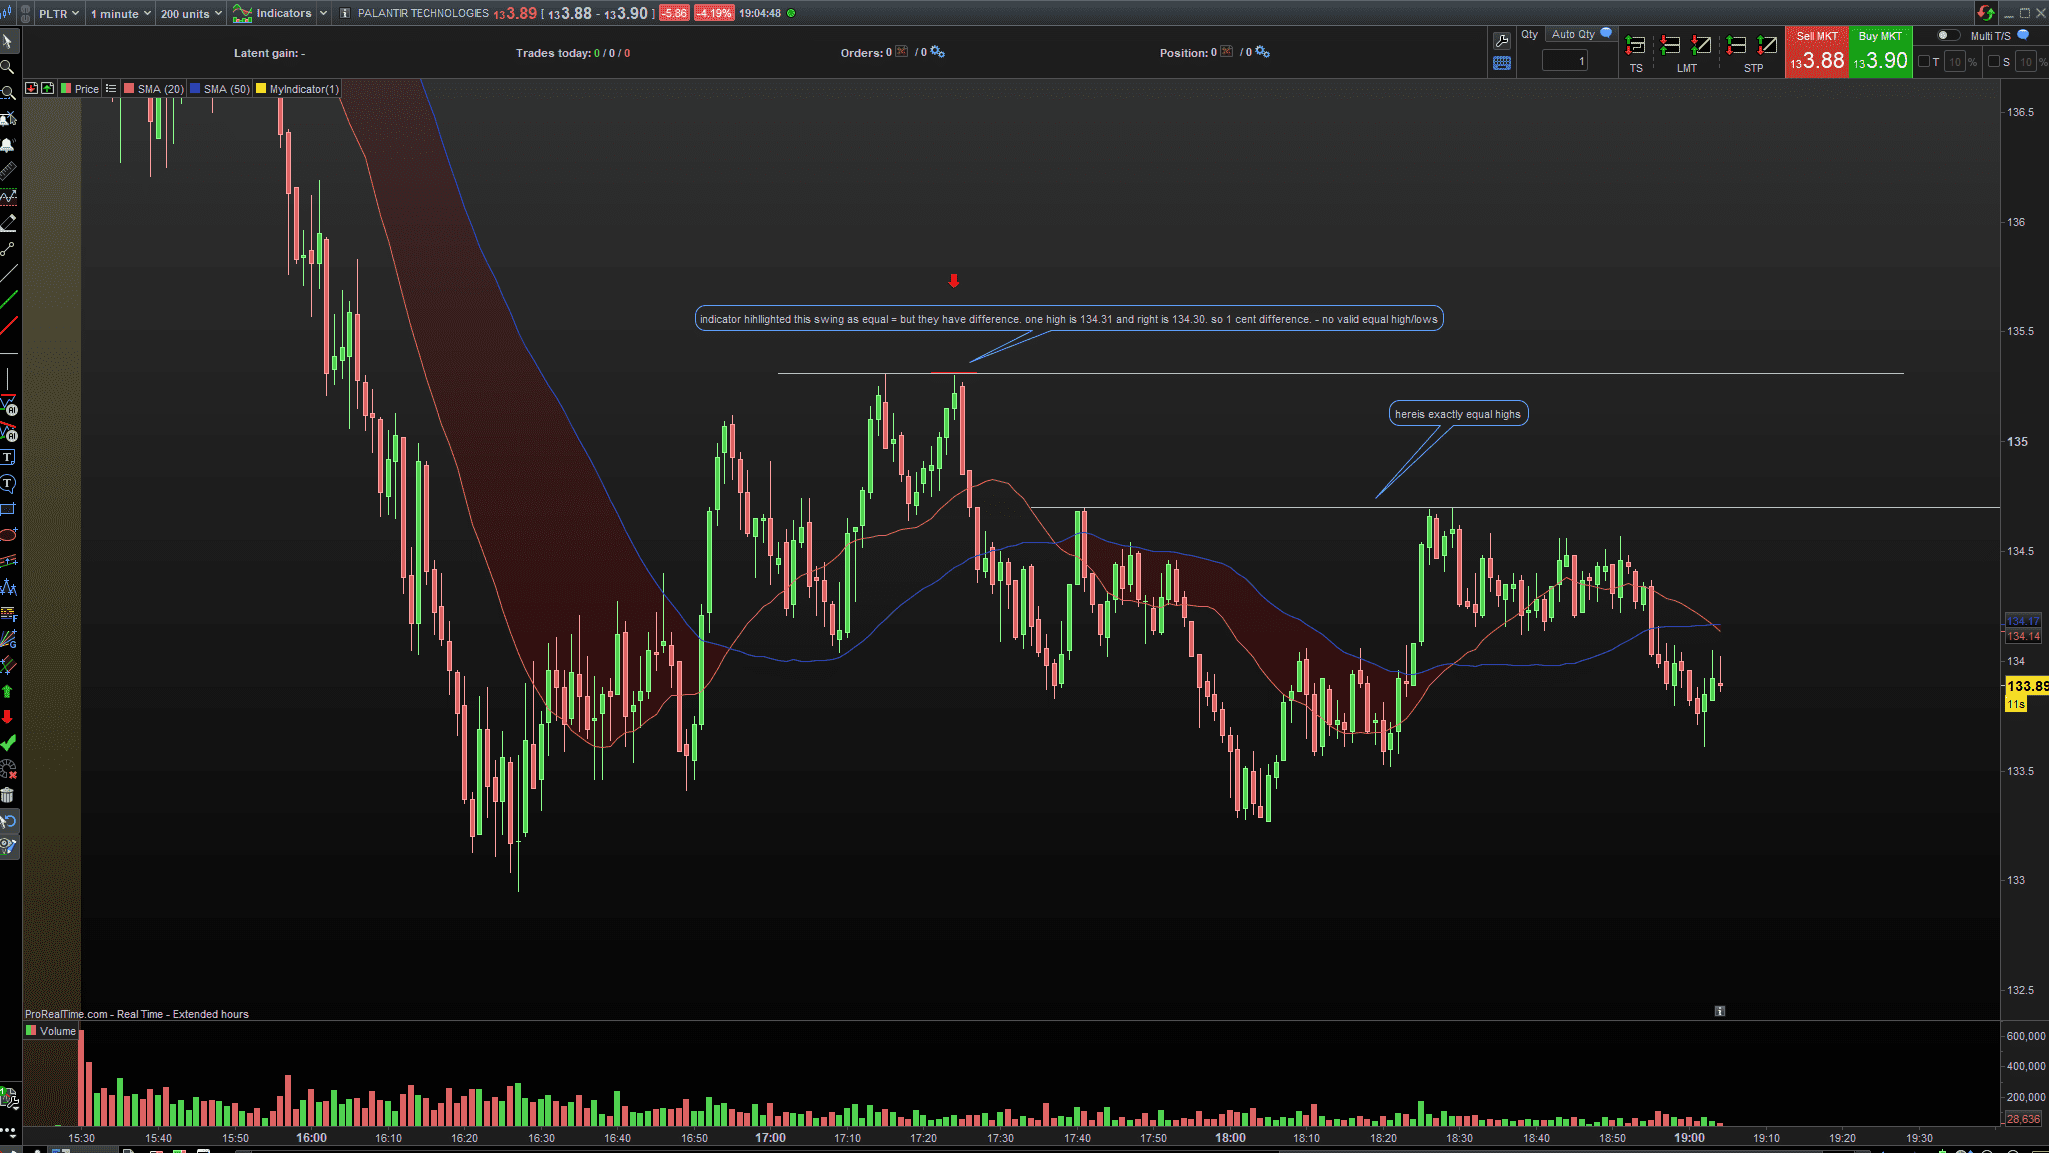
    3- The level is the actual high/low of candles , not the close. So:

    • For an equal high level at 216.35: after the last swing high that touched 216.35, no bar’s high should exceed 216.35
    • For an equal low level at 215.10: after the last swing low that touched 215.10, no bar’s low should go below 215.10


    I will try explain in simpler words, maybe it would be more helpful for me ( to clarify, and for you guys that are helping me)

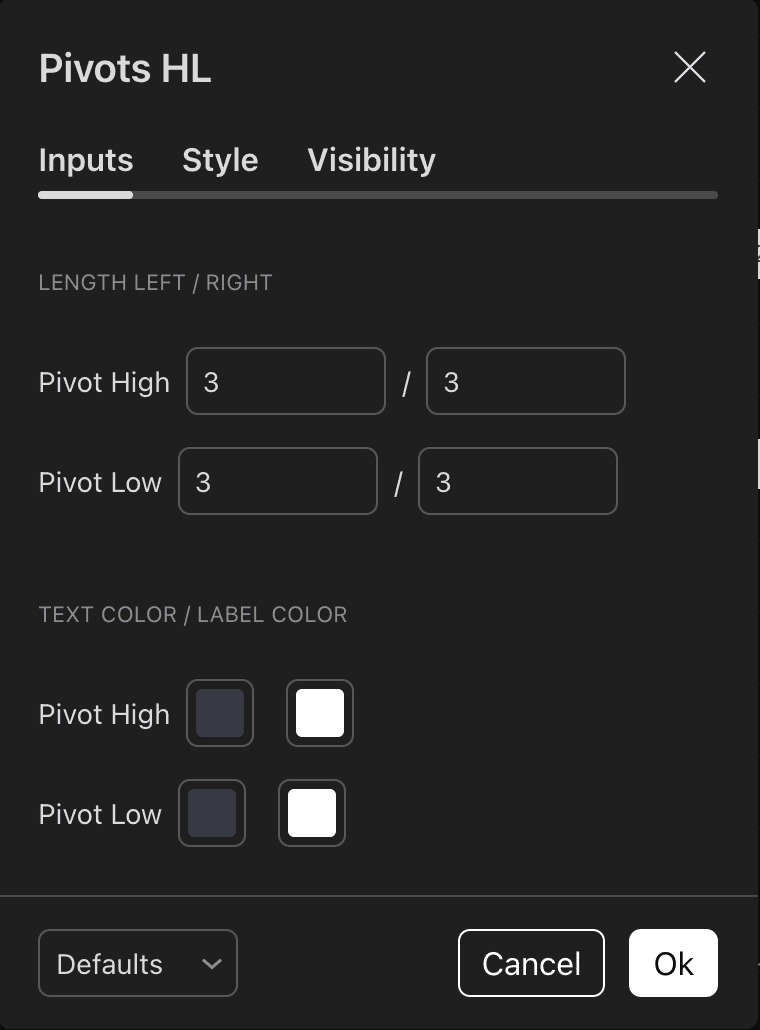
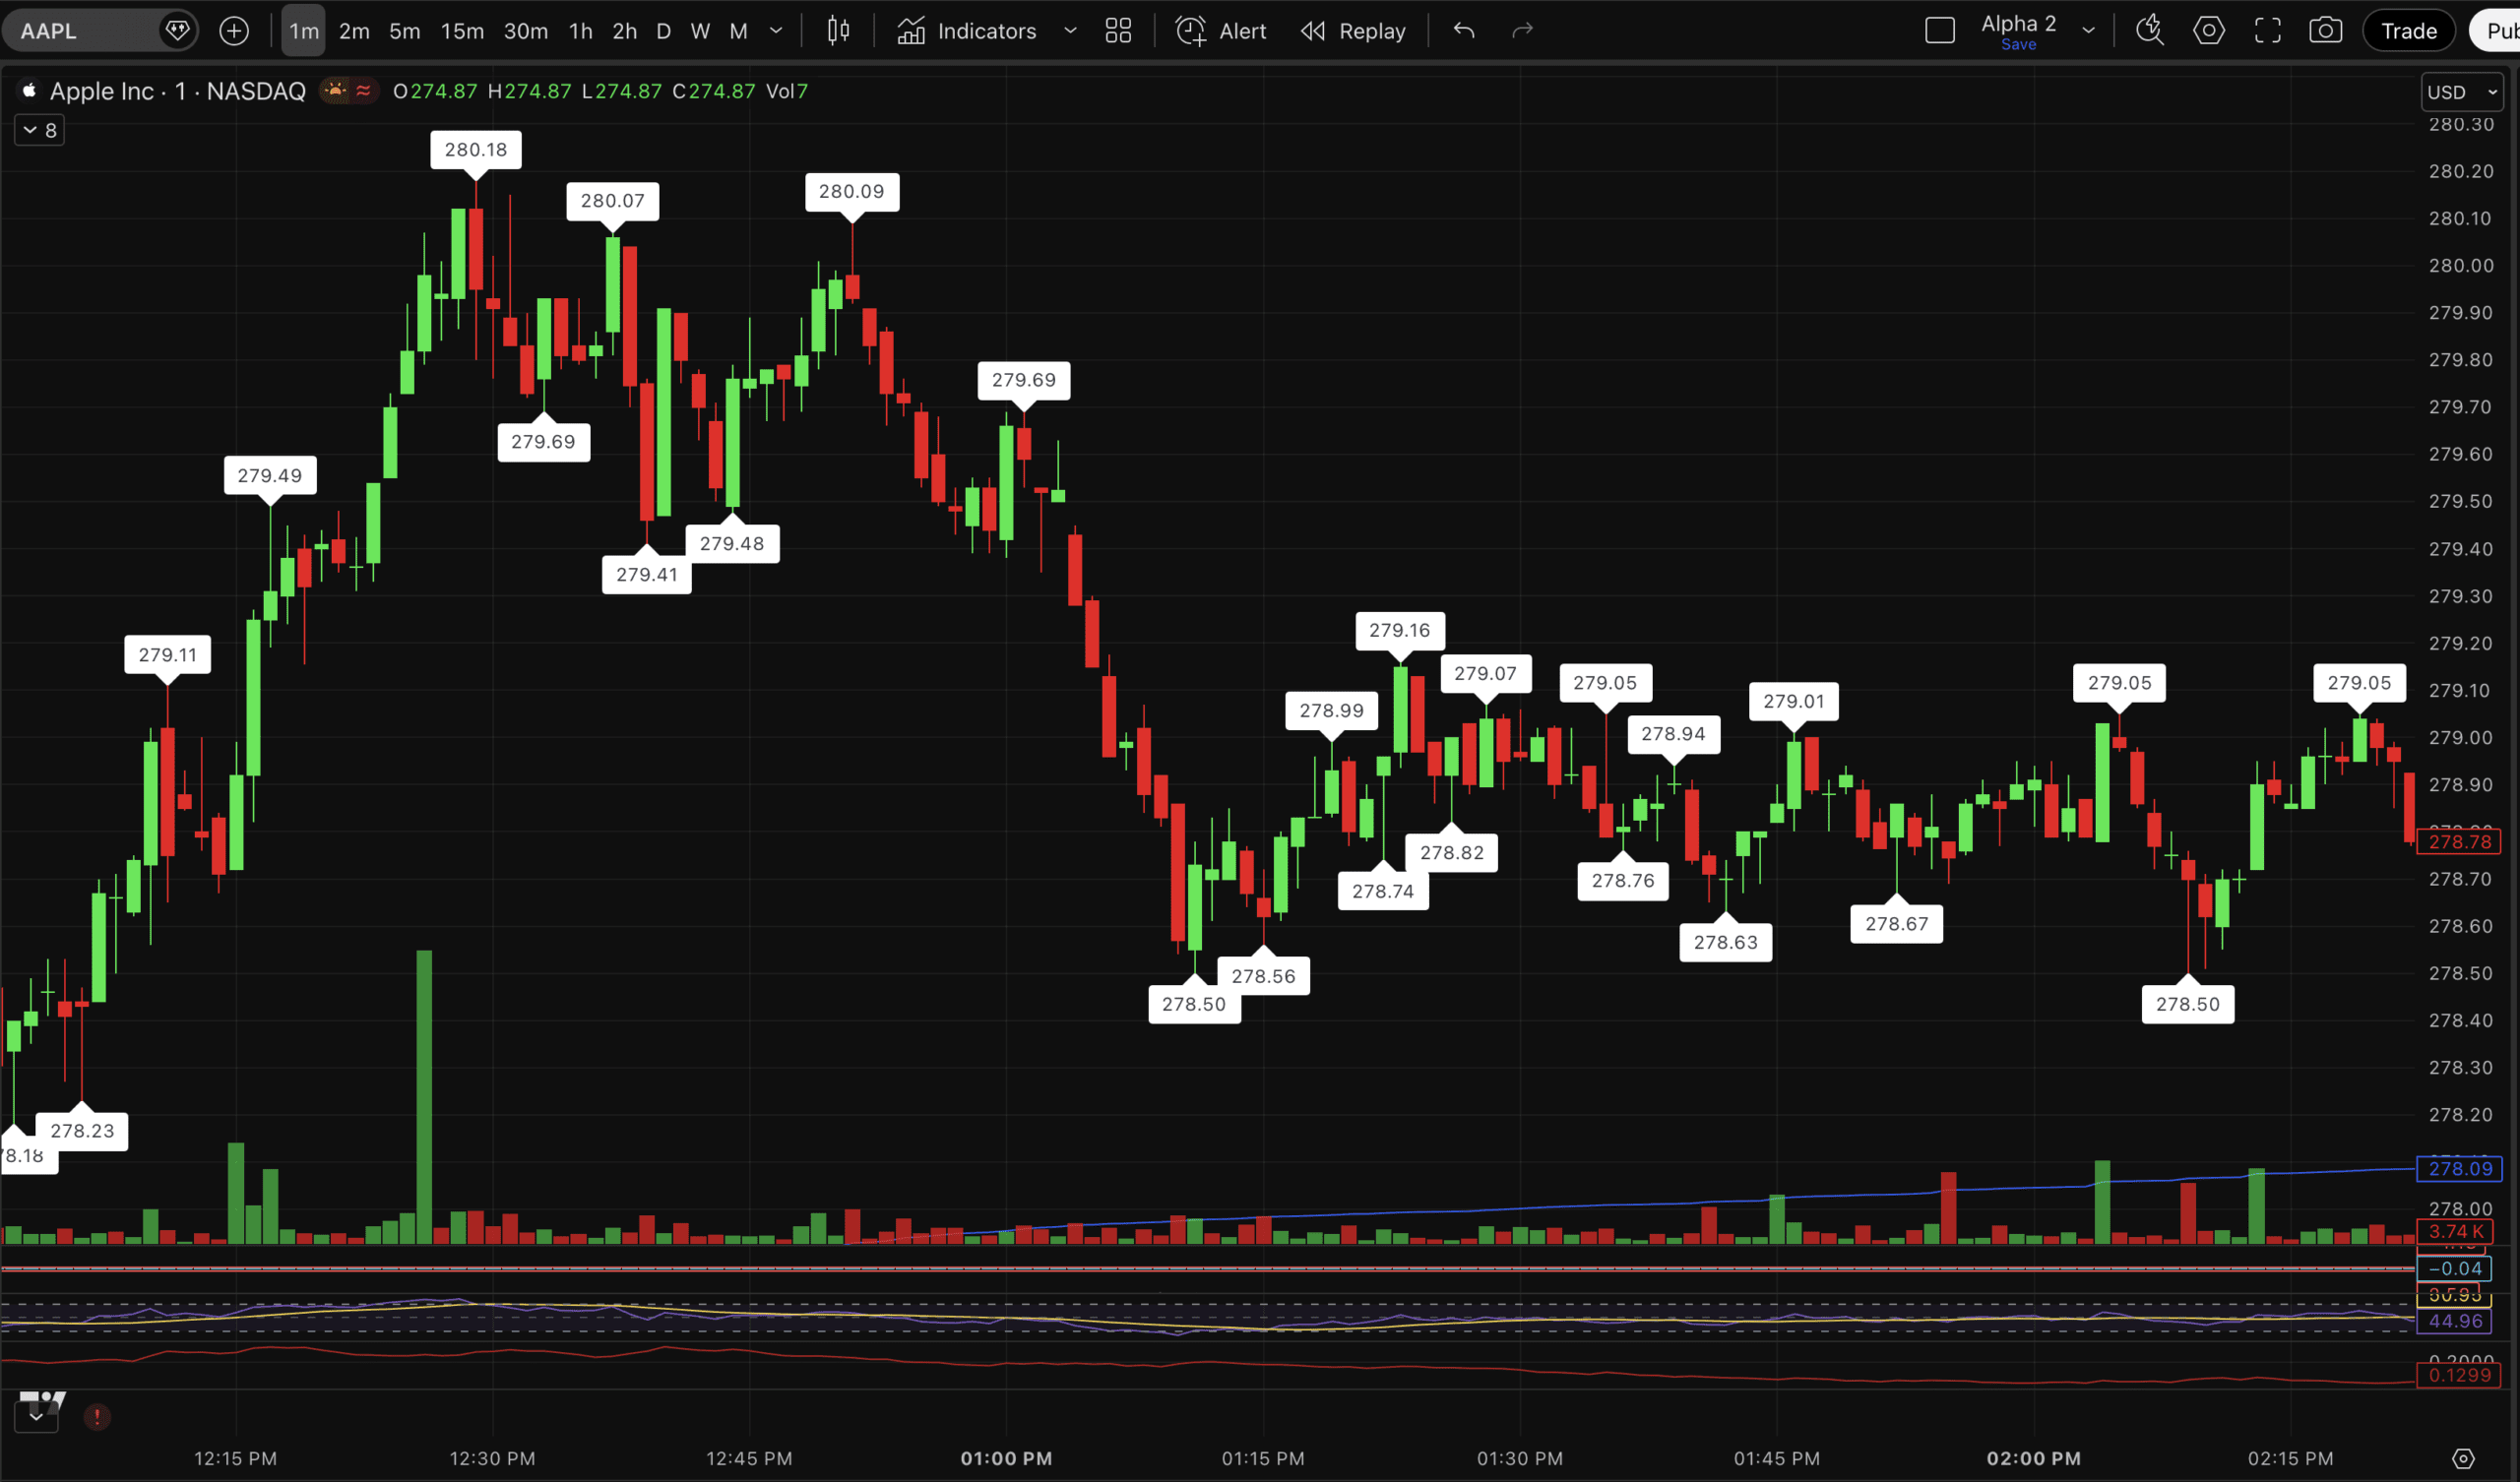
    1- so first is needed is to corectly identify swings( or pivot points) – there is indicator in Tradingview that is great for that it’s called “Pivots Points High Low” and is ideal for identification swings. In the setting I can chose how much left and right i want it to identify swings- i choose 3 and send screnshot how it looks

    This indicator is excatly how i want swing to be identified

    here is code:

     here is code
    //@version=6
    indicator("Pivot Points High Low", shorttitle="Pivots HL", overlay=true, max_labels_count=500)
    
    
    lengthGroupTitle = "LENGTH LEFT / RIGHT"
    colorGroupTitle = "Text Color / Label Color"
    leftLenH = input.int(title="Pivot High", defval=10, minval=1, inline="Pivot High", group=lengthGroupTitle)
    rightLenH = input.int(title="/", defval=10, minval=1, inline="Pivot High", group=lengthGroupTitle)
    textColorH = input(title="Pivot High", defval=color.black, inline="Pivot High", group=colorGroupTitle)
    labelColorH = input(title="", defval=color.white, inline="Pivot High", group=colorGroupTitle)
    
    
    leftLenL = input.int(title="Pivot Low", defval=10, minval=1, inline="Pivot Low", group=lengthGroupTitle)
    rightLenL = input.int(title="/", defval=10, minval=1, inline="Pivot Low", group=lengthGroupTitle)
    textColorL = input(title="Pivot Low", defval=color.black, inline="Pivot Low", group=colorGroupTitle)
    labelColorL = input(title="", defval=color.white, inline="Pivot Low", group=colorGroupTitle)
    
    
    ph = ta.pivothigh(leftLenH, rightLenH)
    pl = ta.pivotlow(leftLenL, rightLenL)
    
    
    drawLabel(_offset, _pivot, _style, _color, _textColor) =>
        if not na(_pivot)
            label.new(bar_index[_offset], _pivot, str.tostring(_pivot, format.mintick), style=_style, color=_color, textcolor=_textColor)
    
    
    drawLabel(rightLenH, ph, label.style_label_down, labelColorH, textColorH)
    drawLabel(rightLenL, pl, label.style_label_up, labelColorL, textColorL)
    

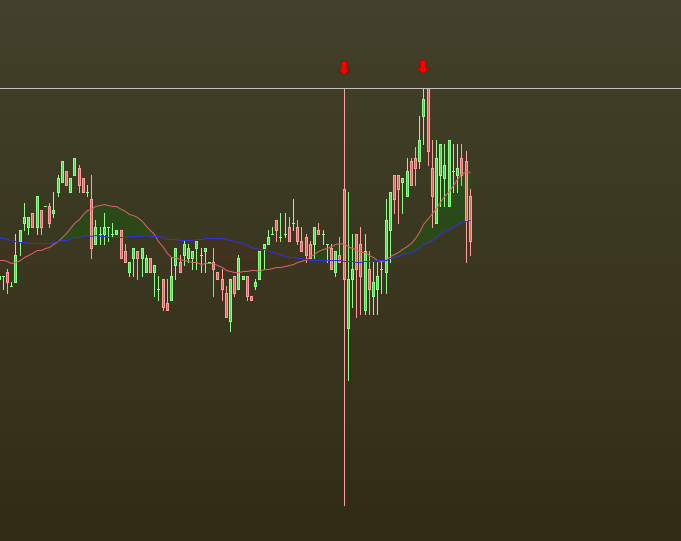
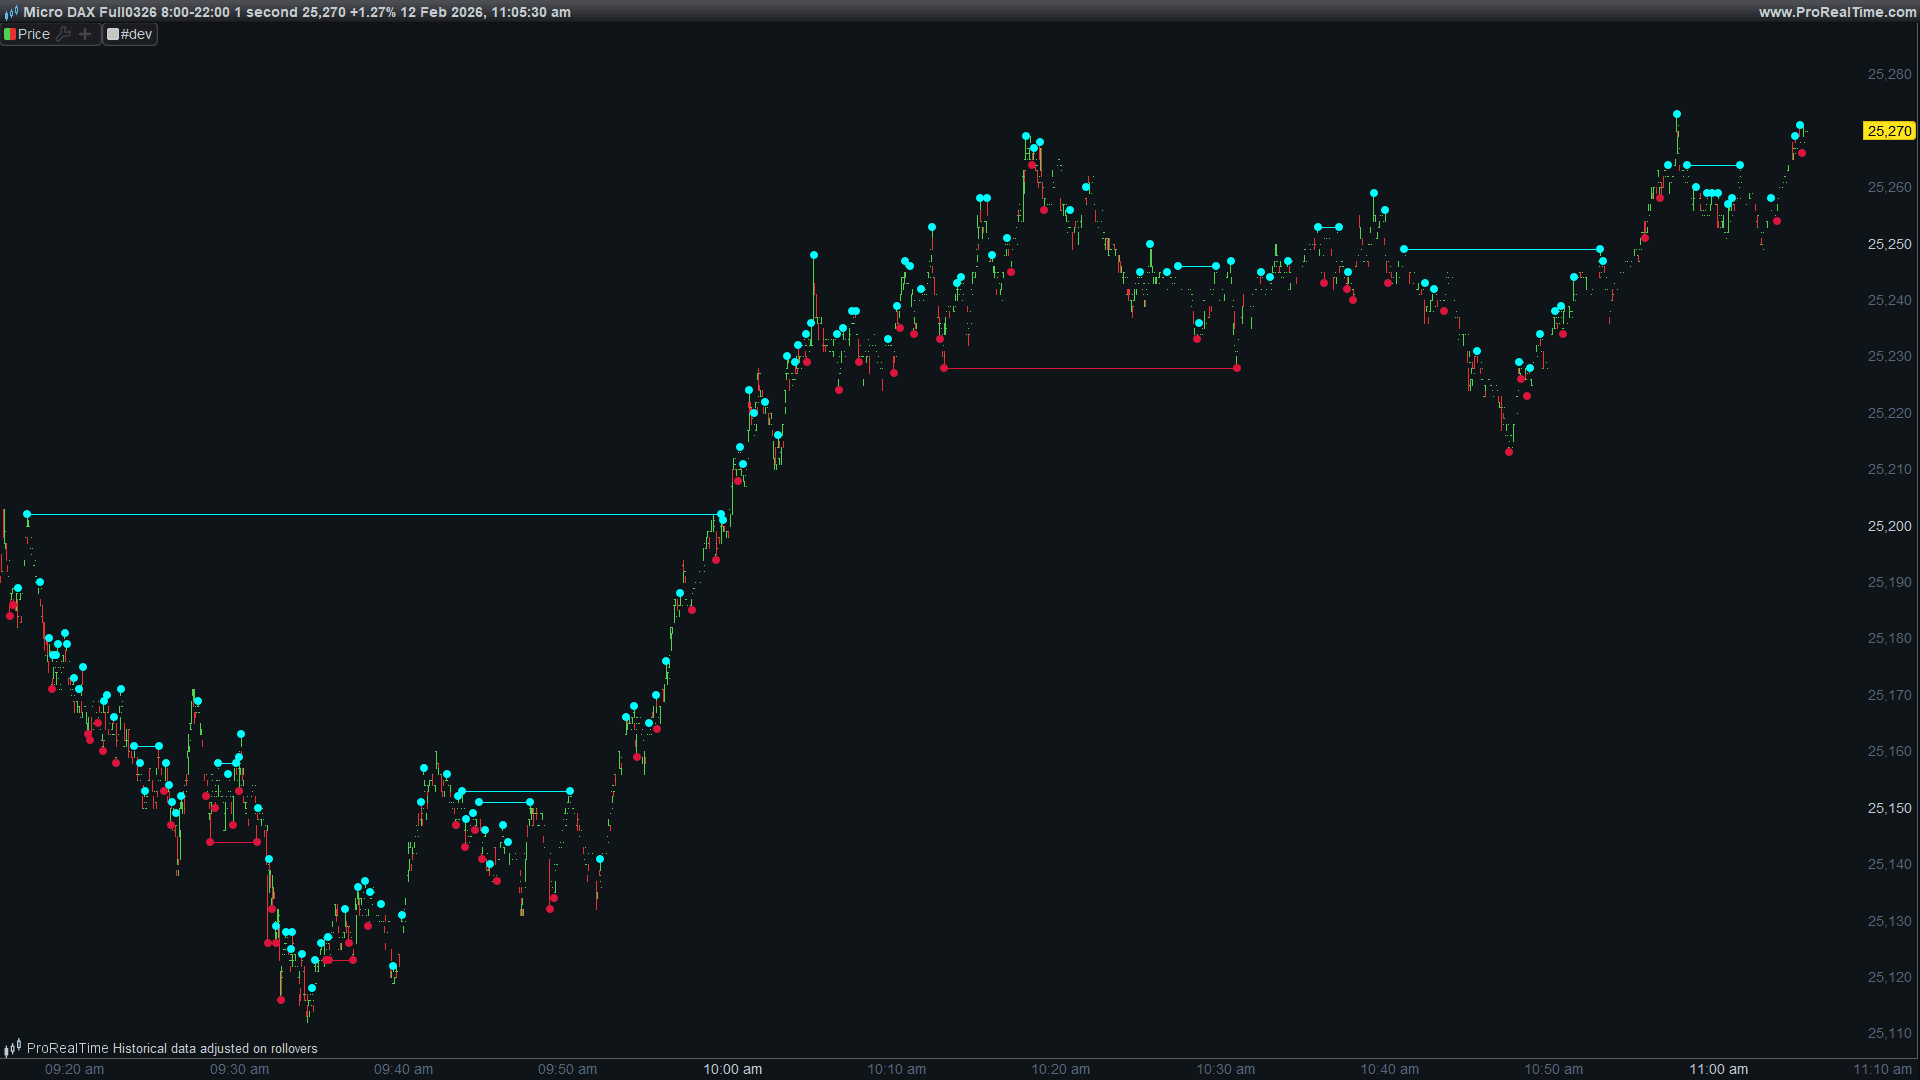
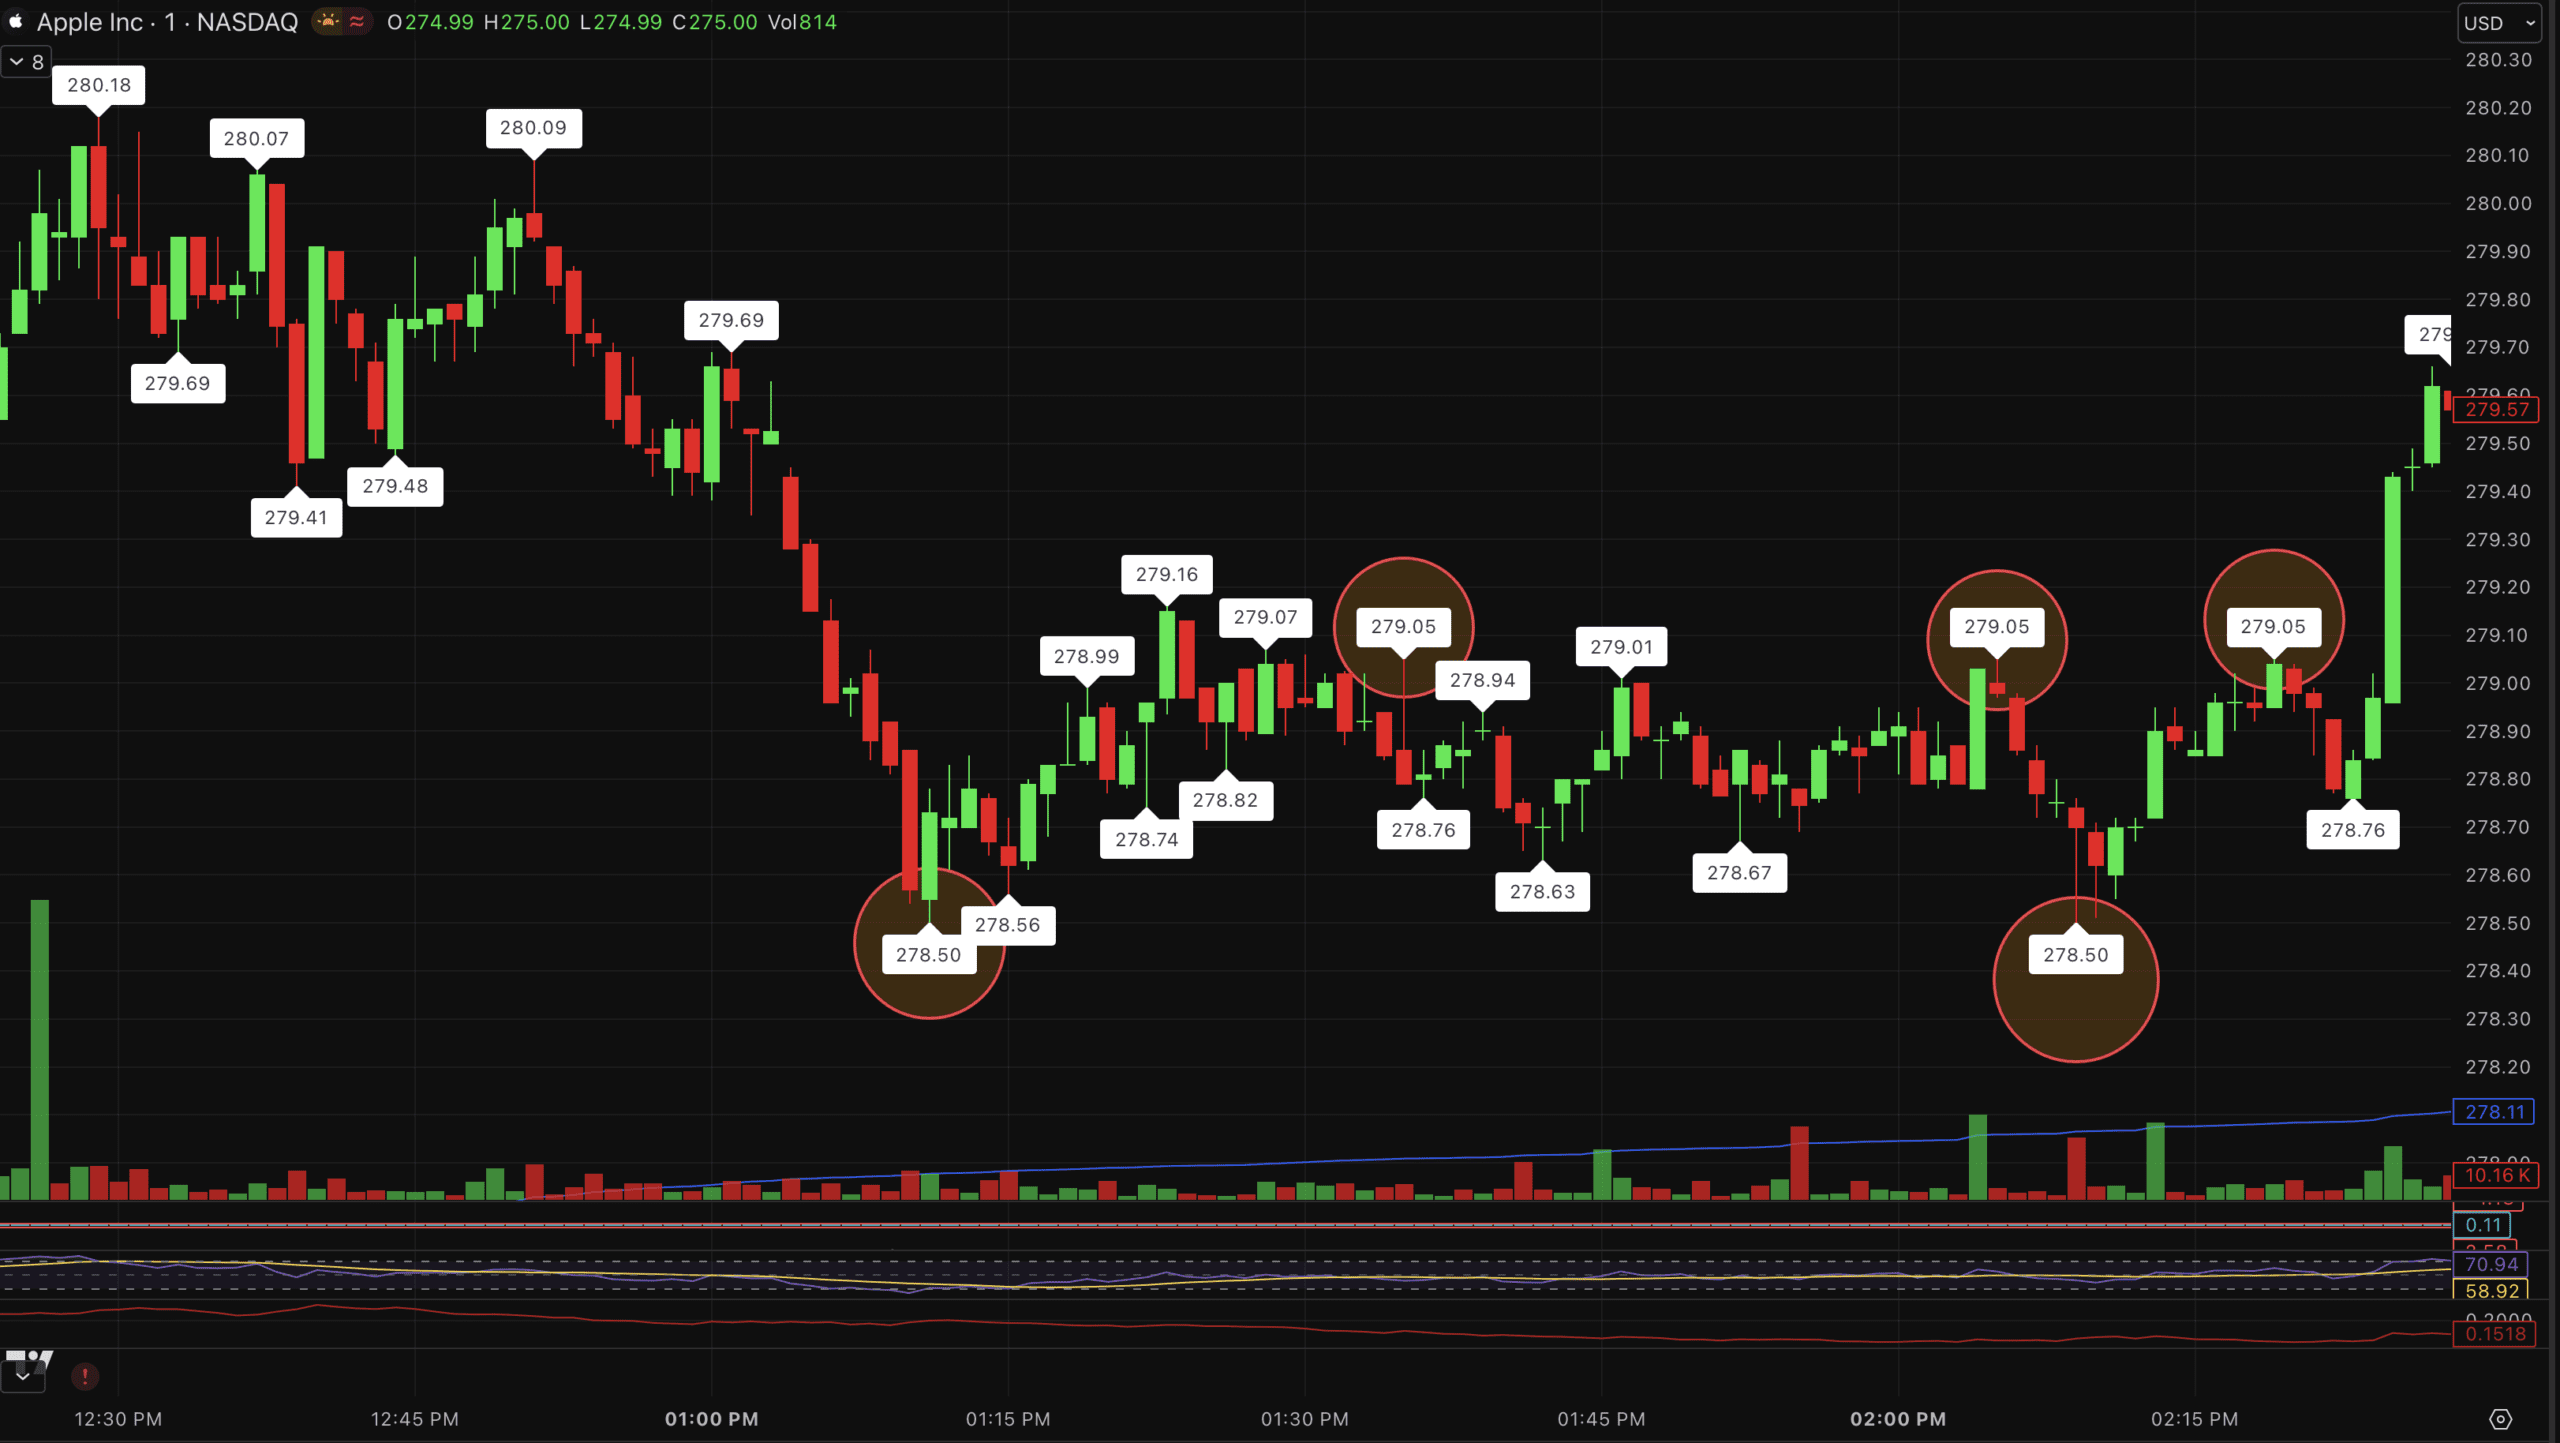
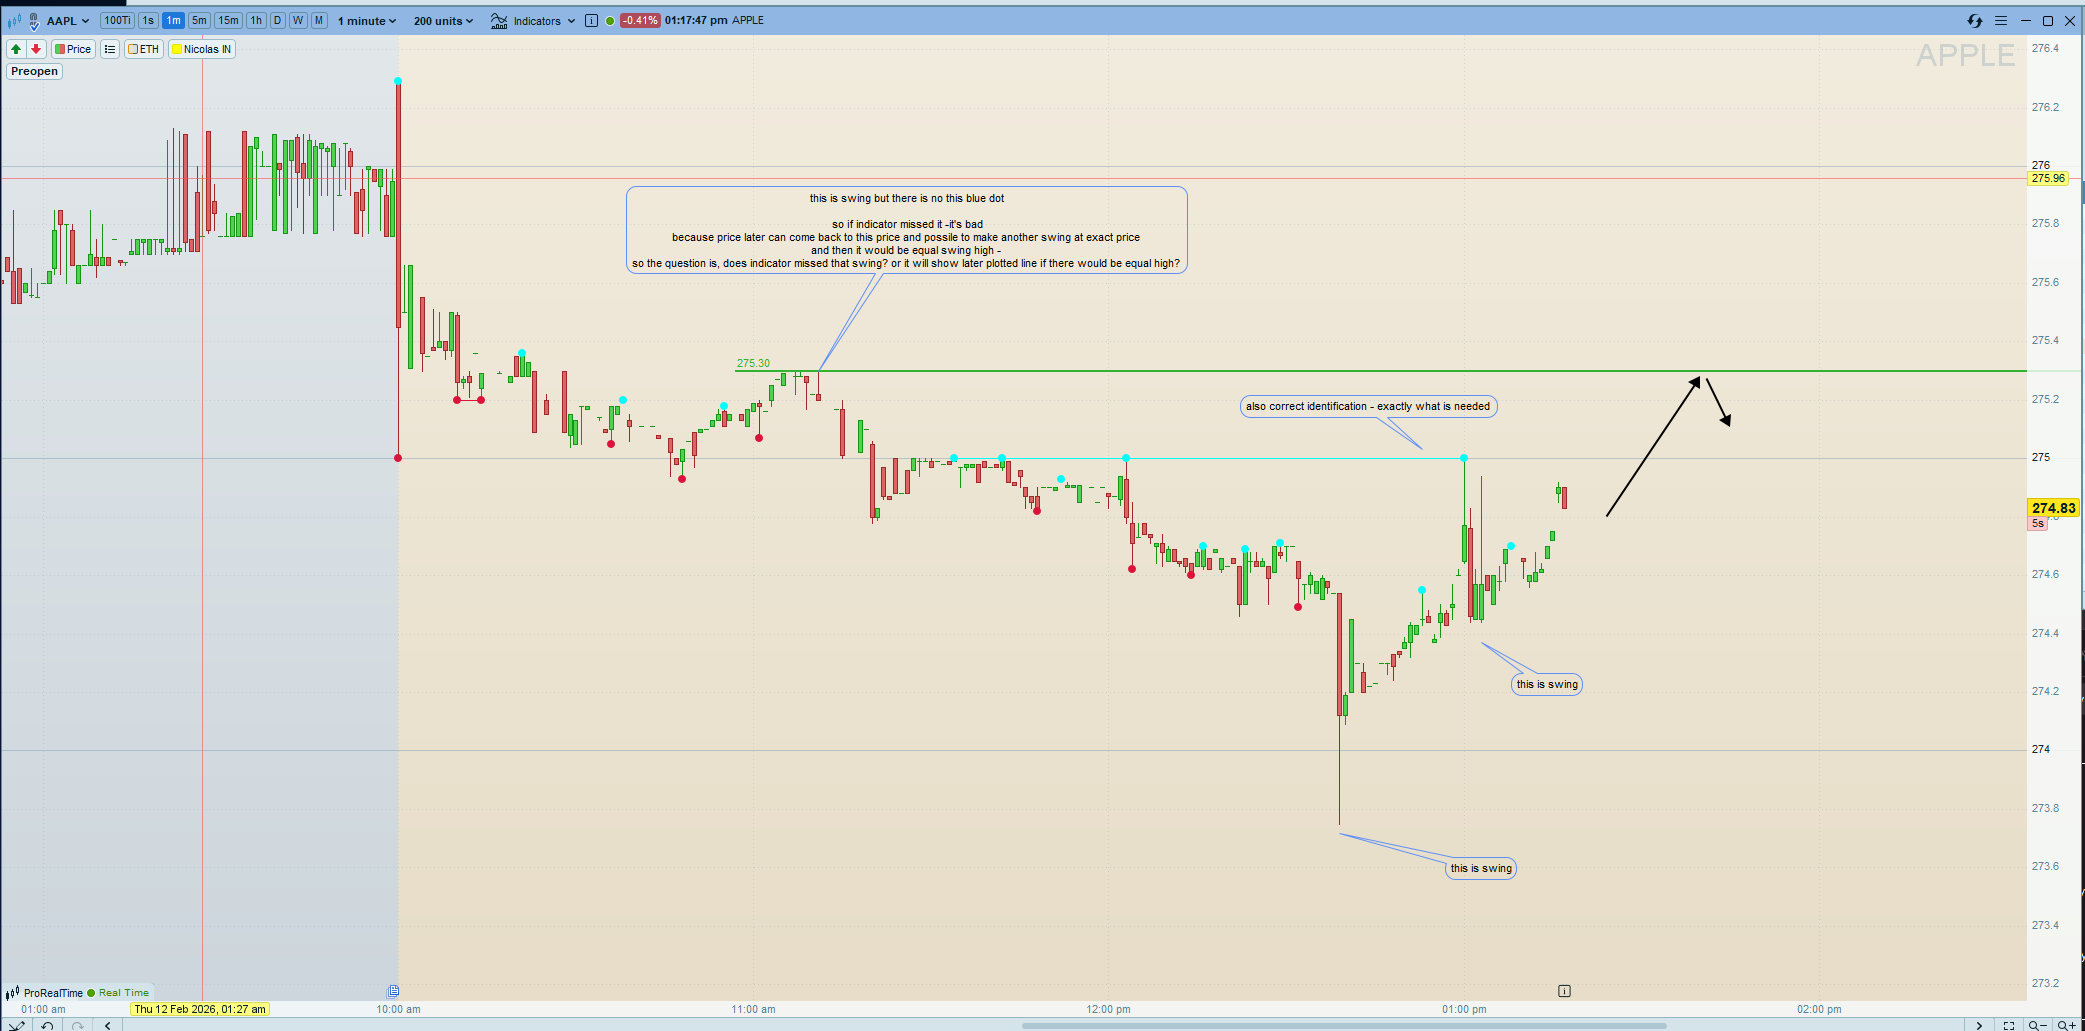
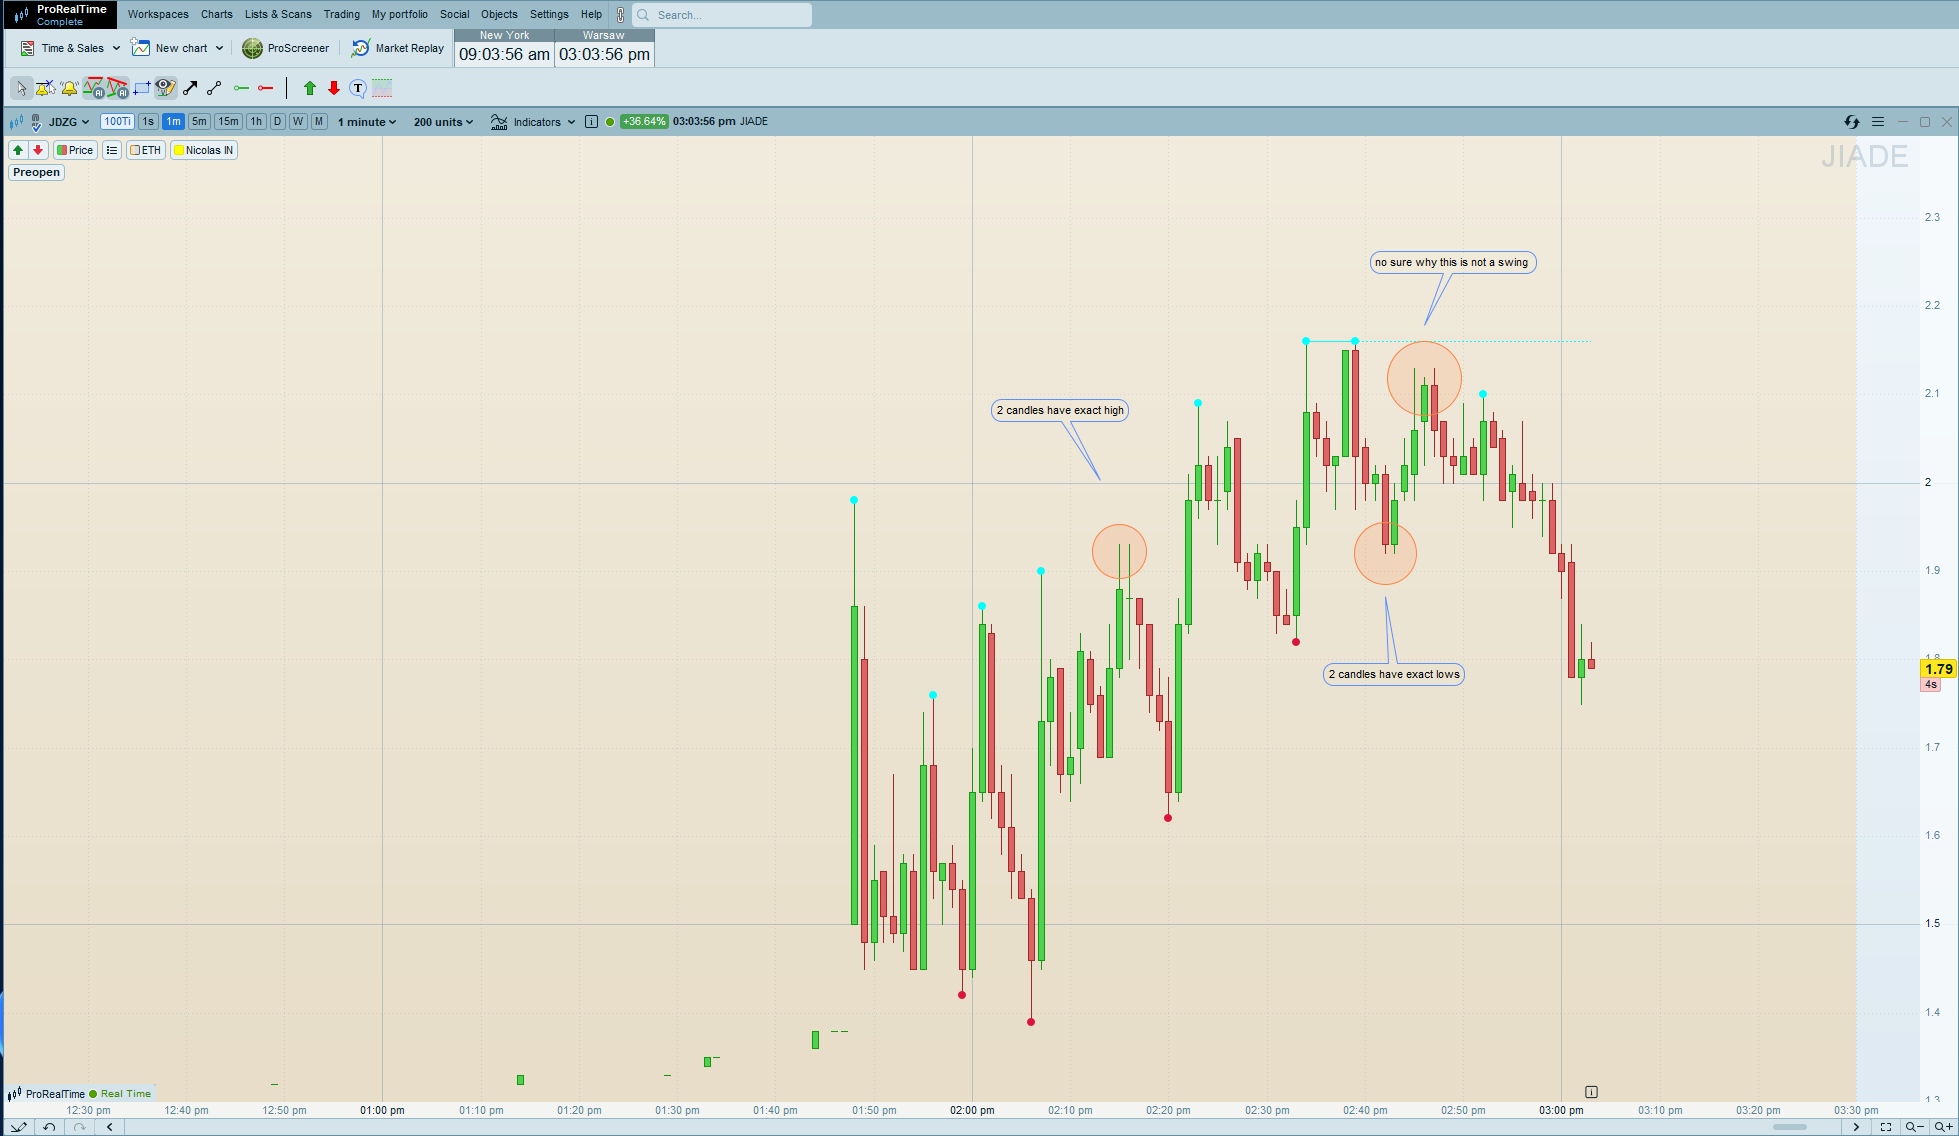
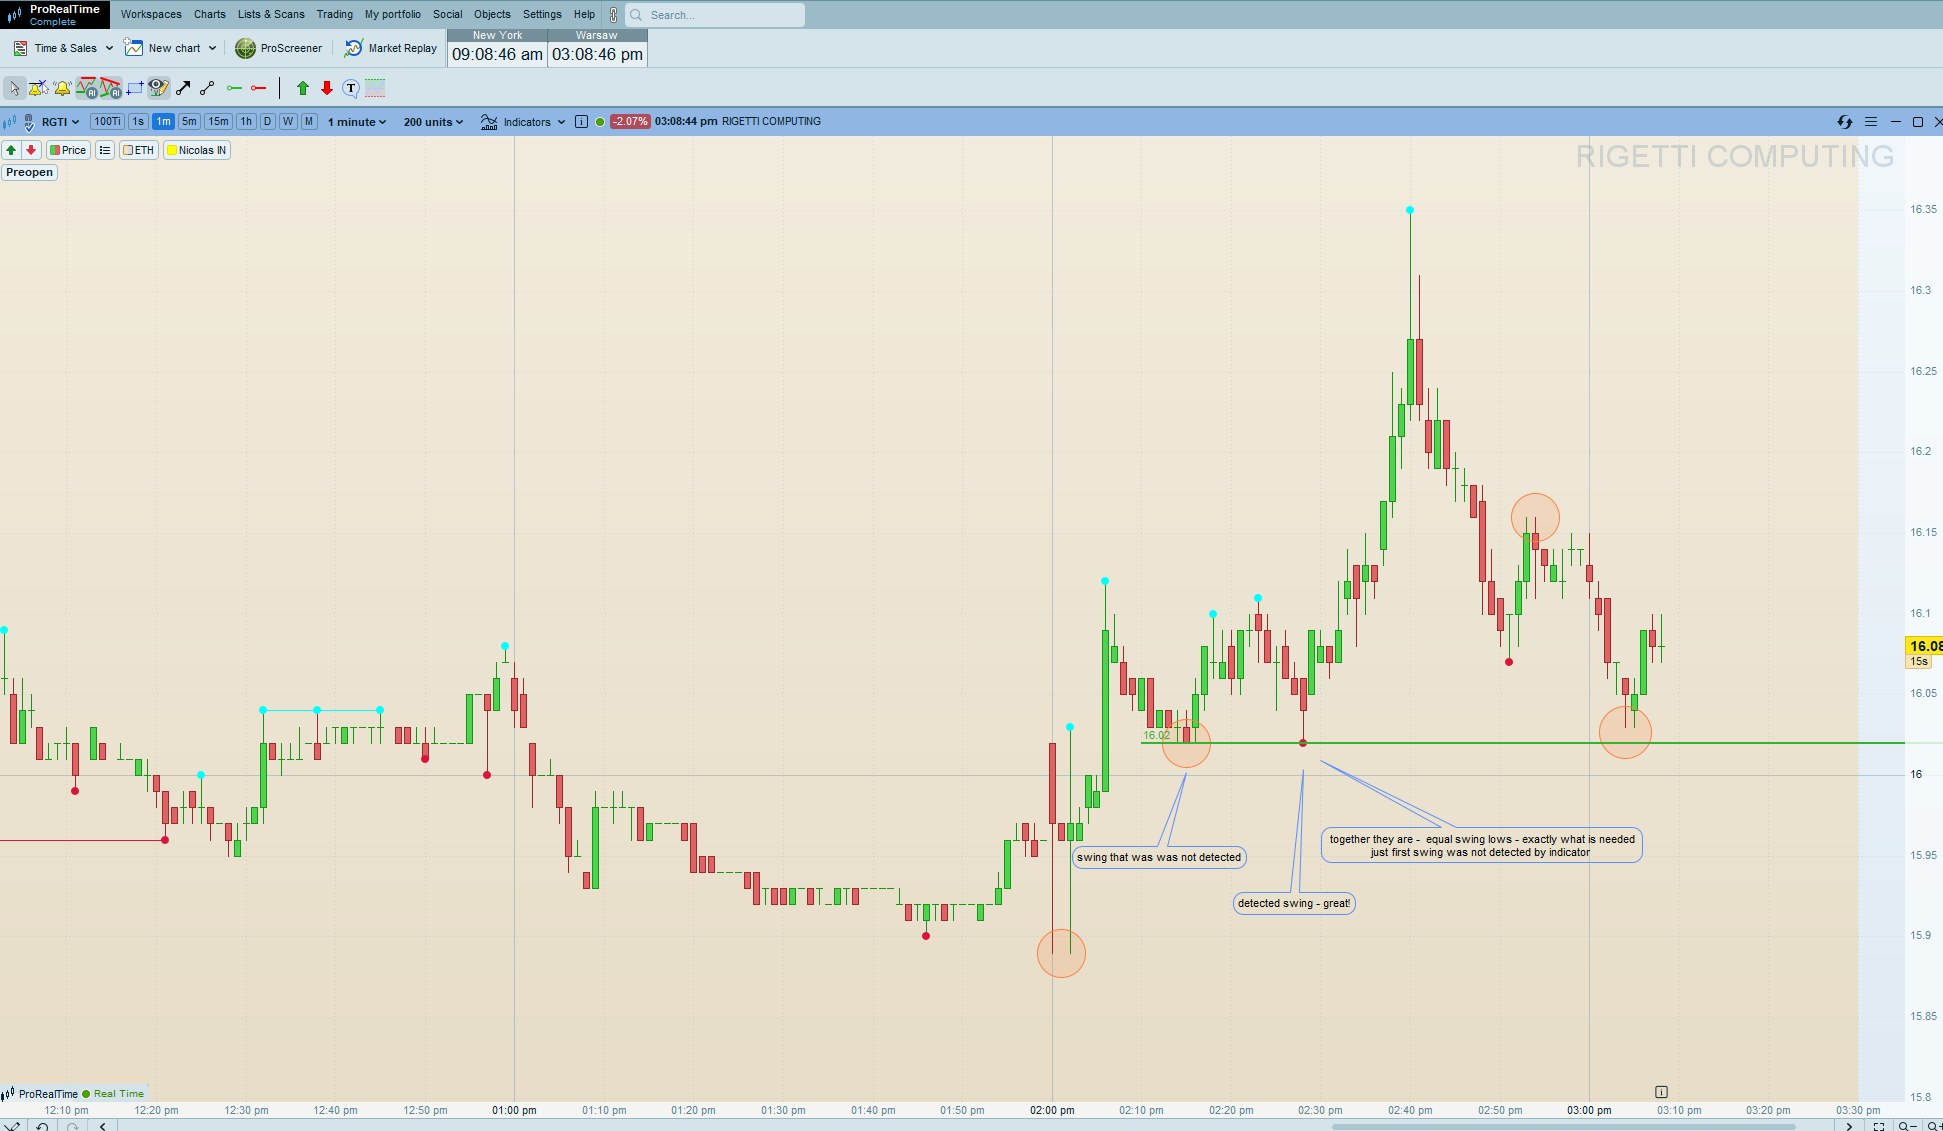
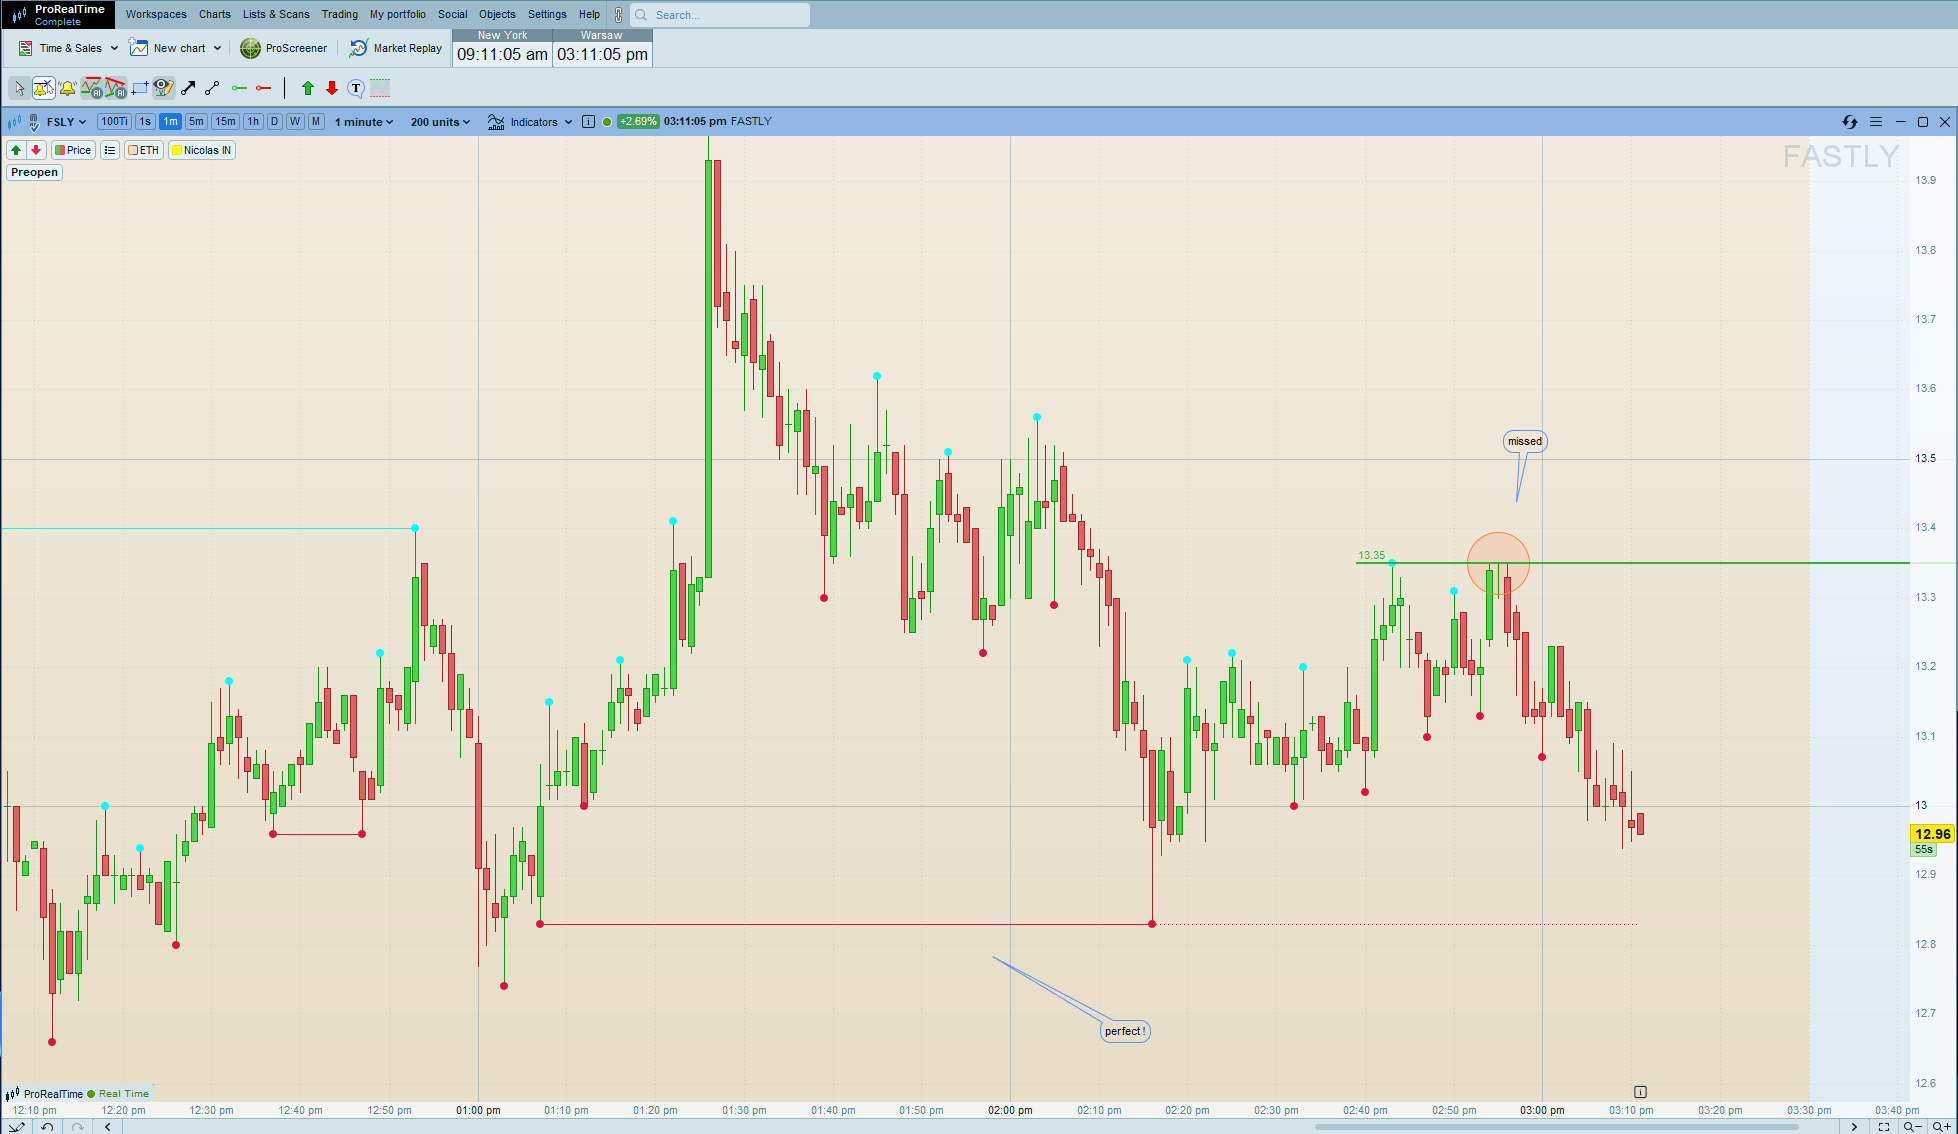
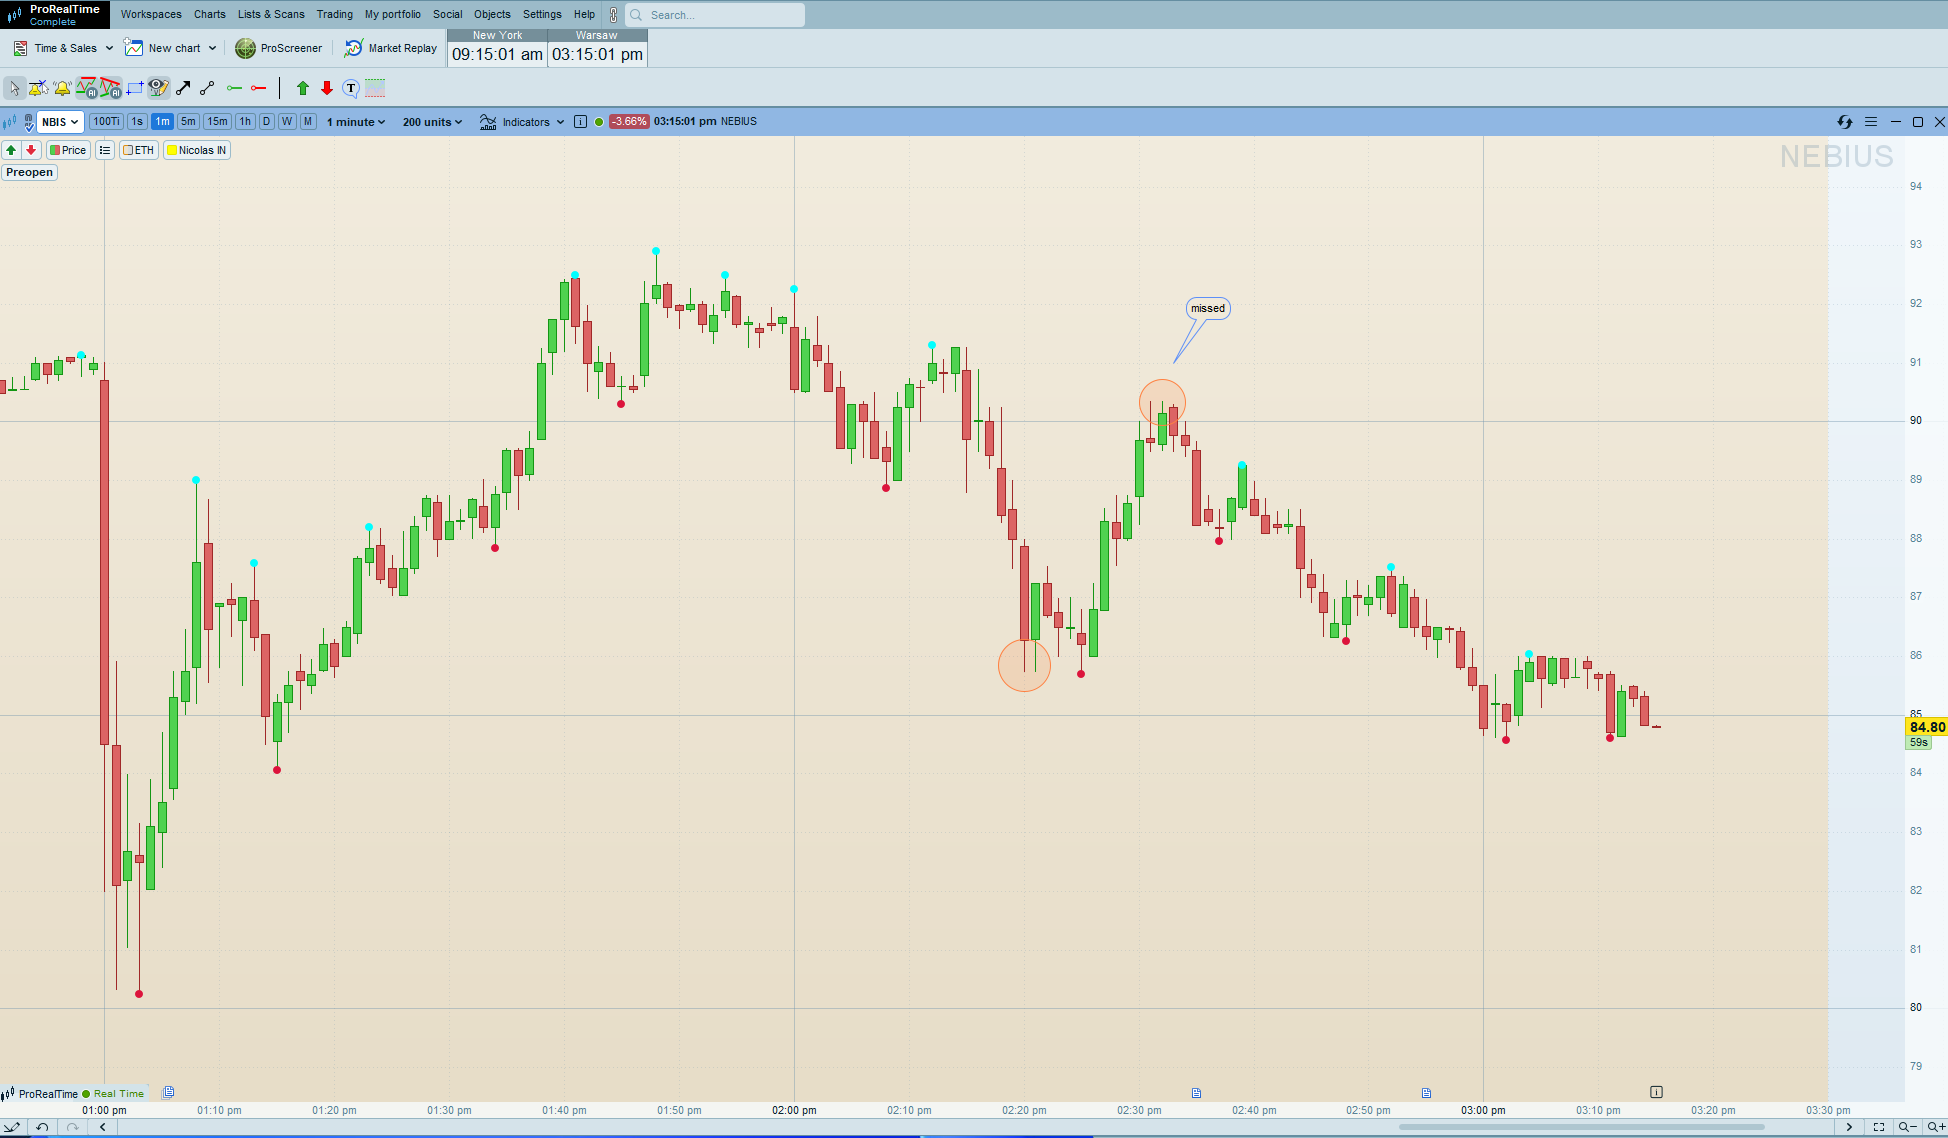
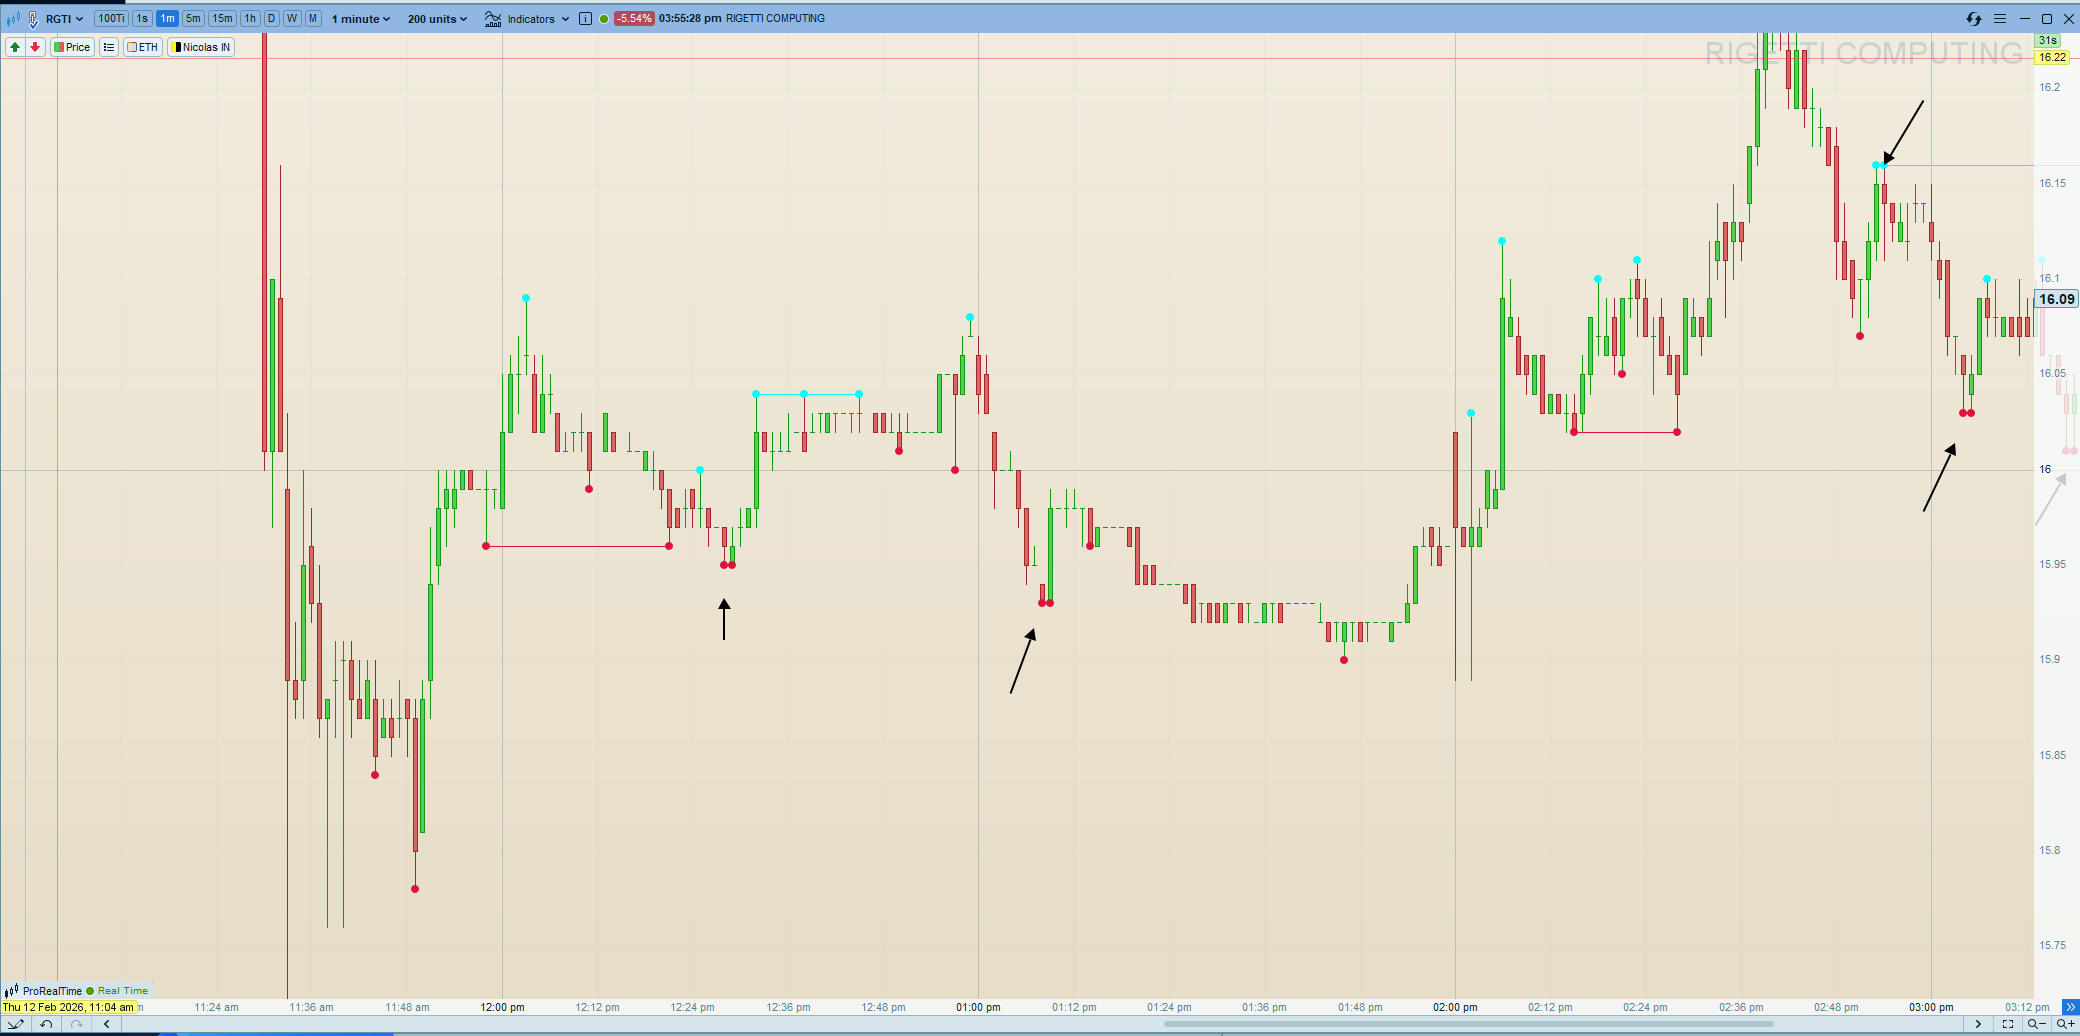
    2- then i want to know ( screener/indicator to identify) is there on chart a pivot points at the same price (2 swings at the same price)

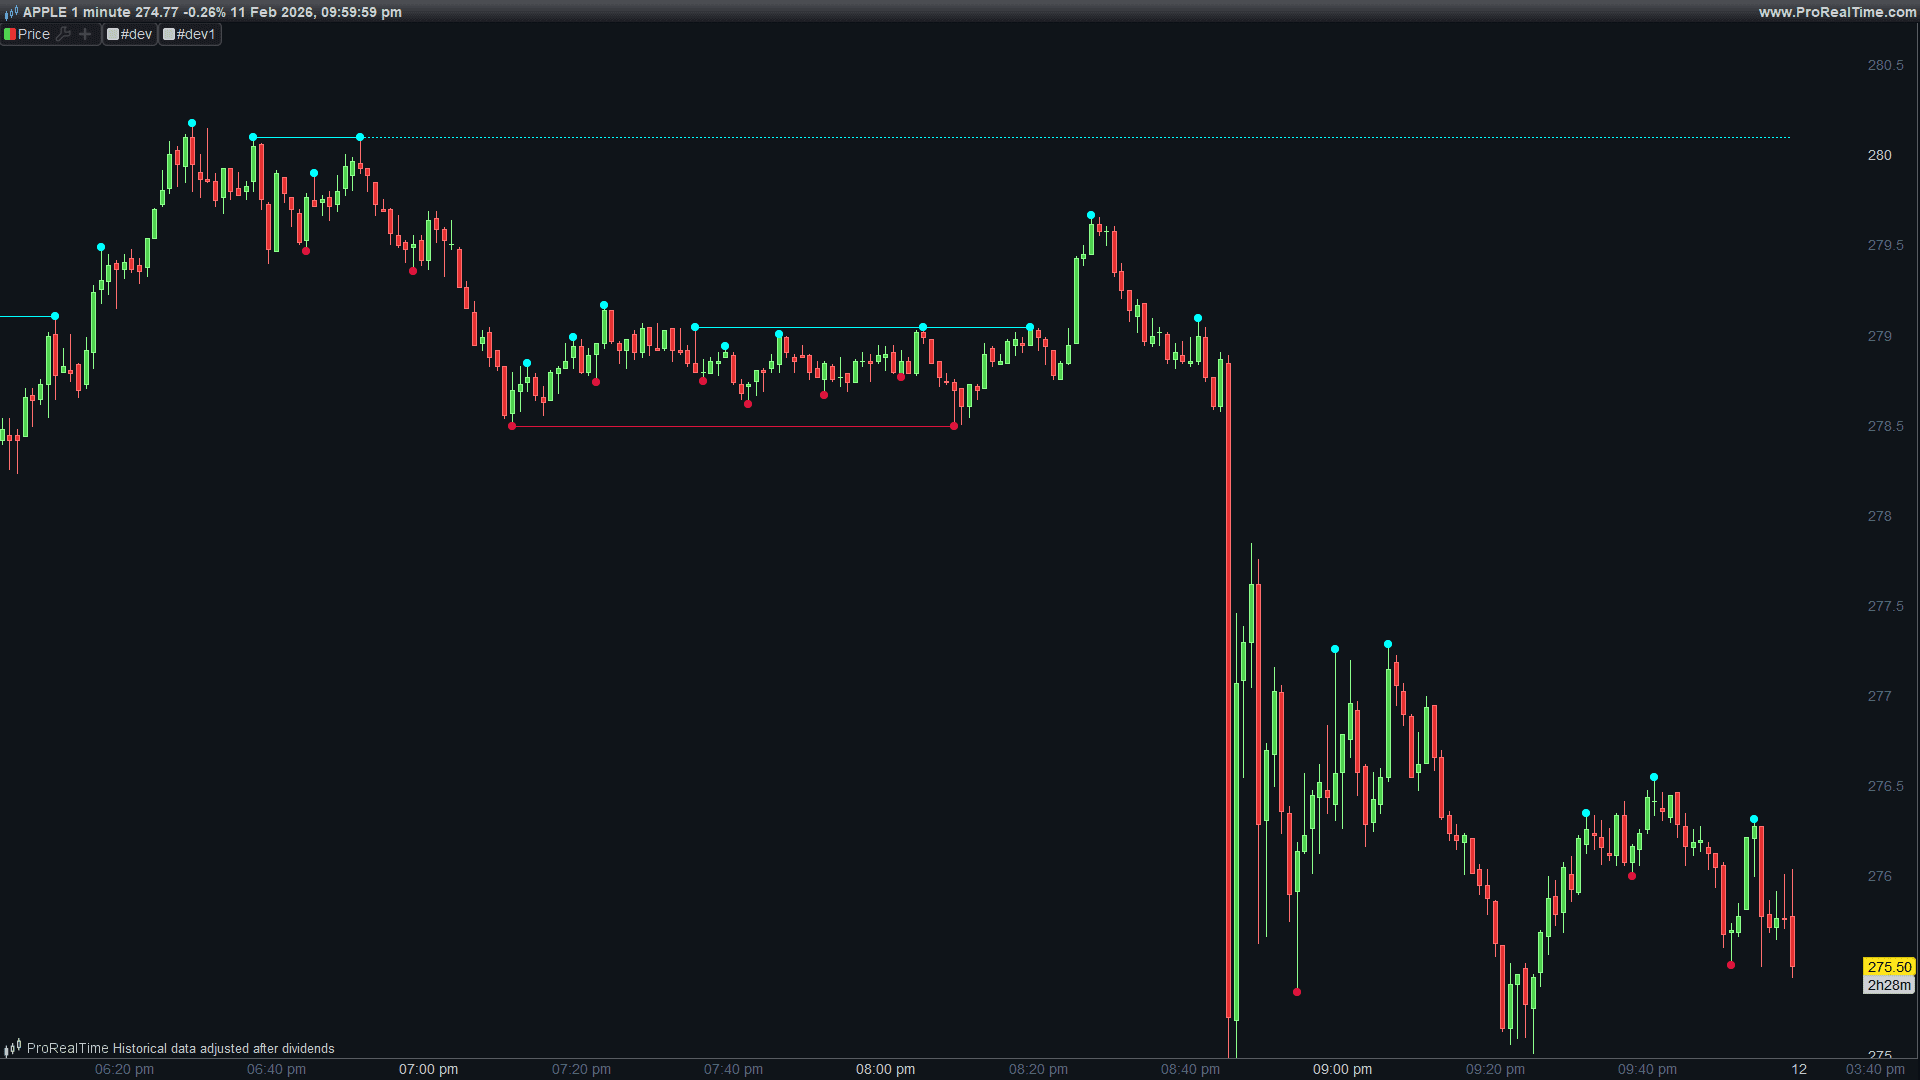
    here on chart of AAPLE there is 2 examples of this

    (attached screnshot with orange circles)


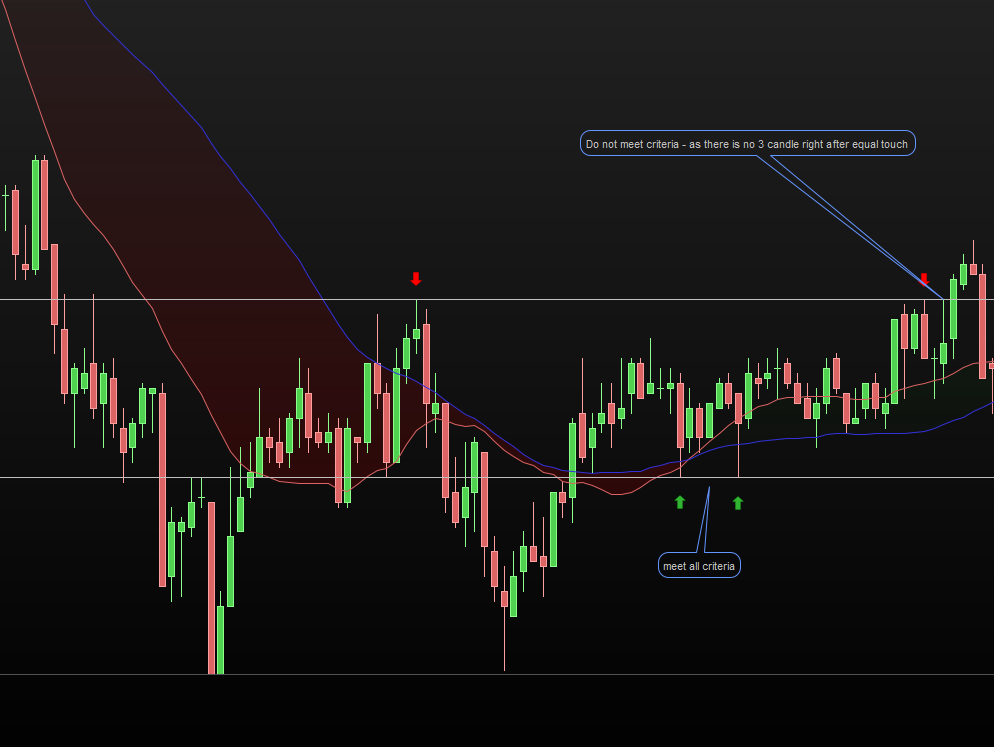
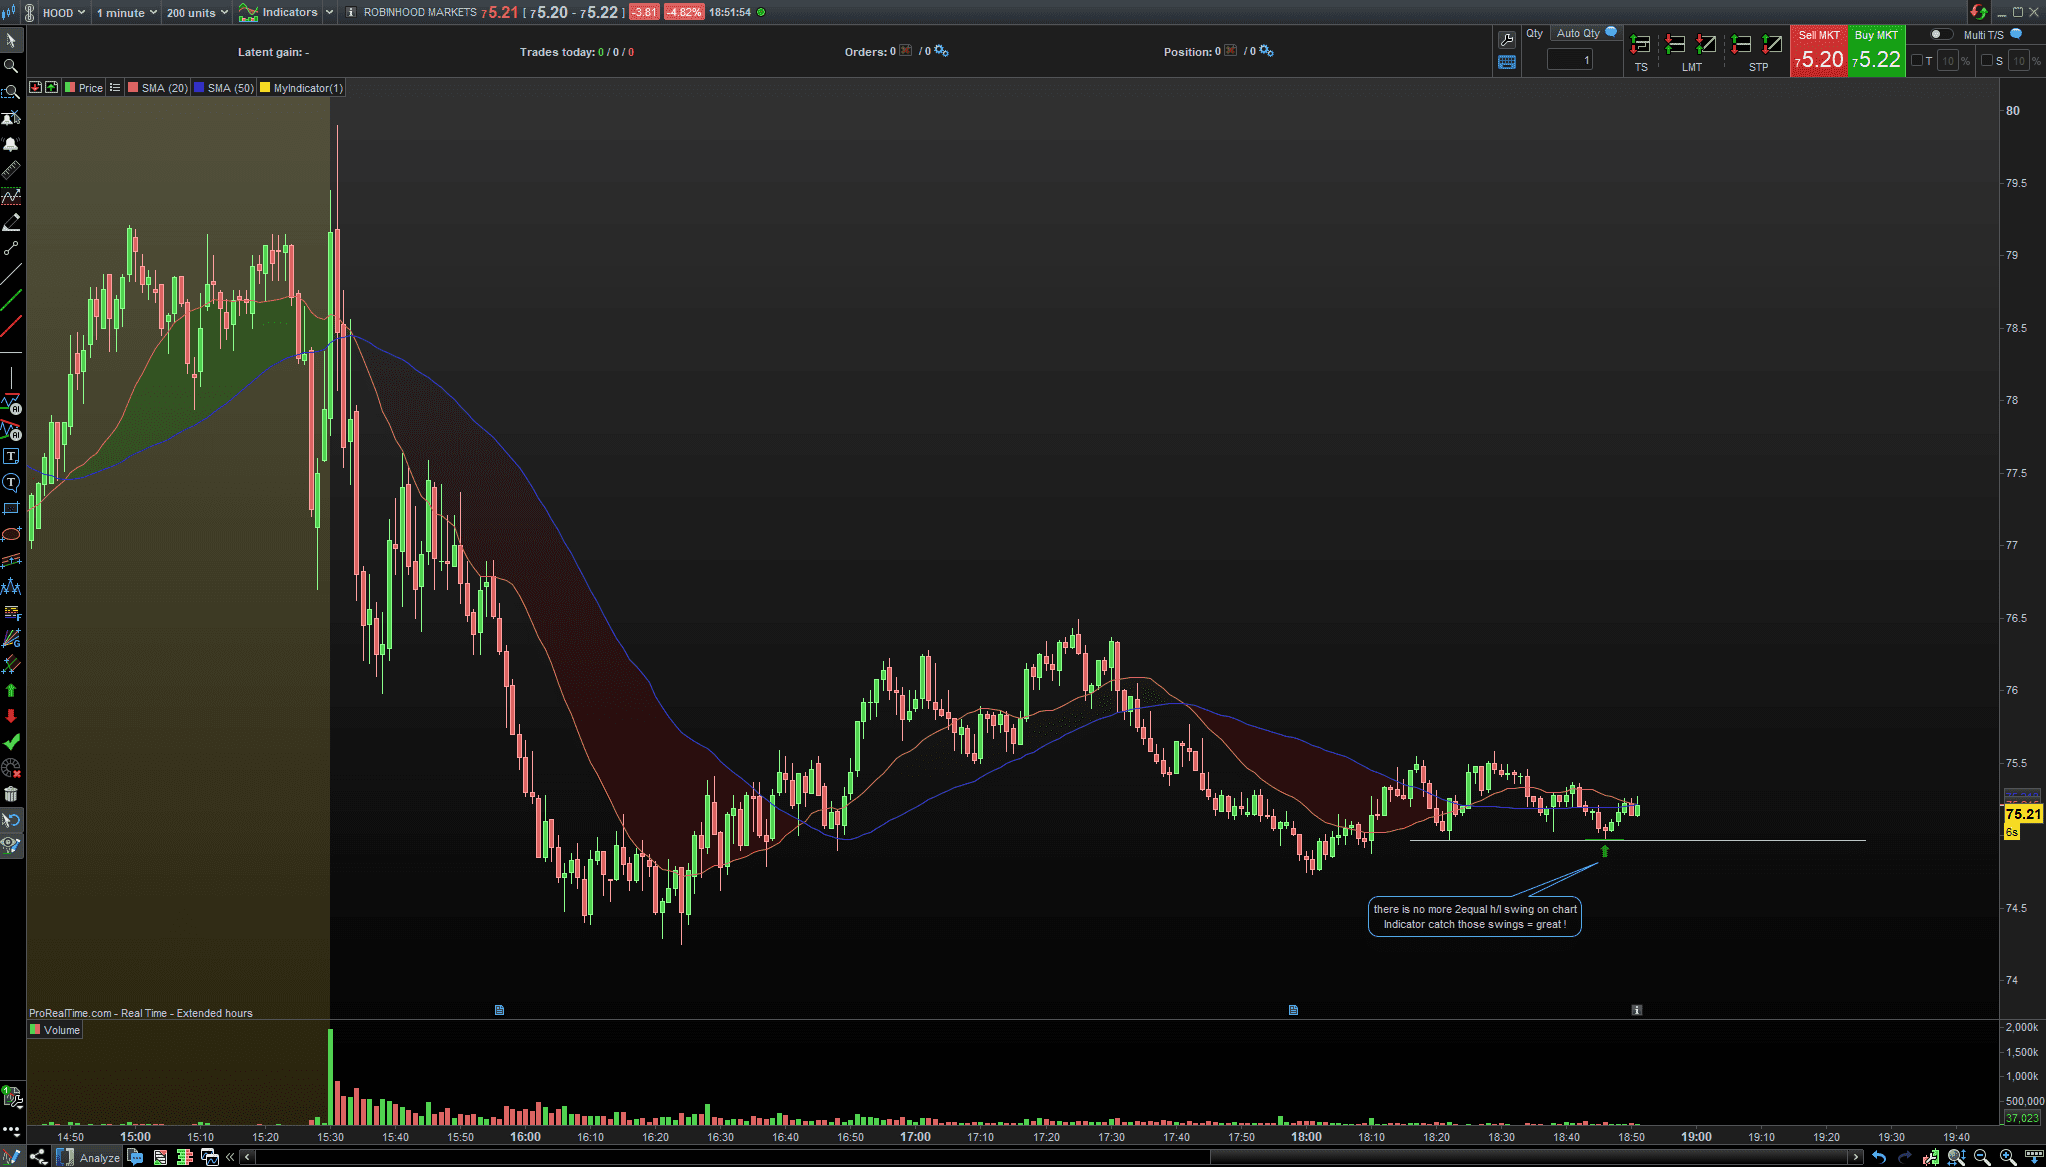
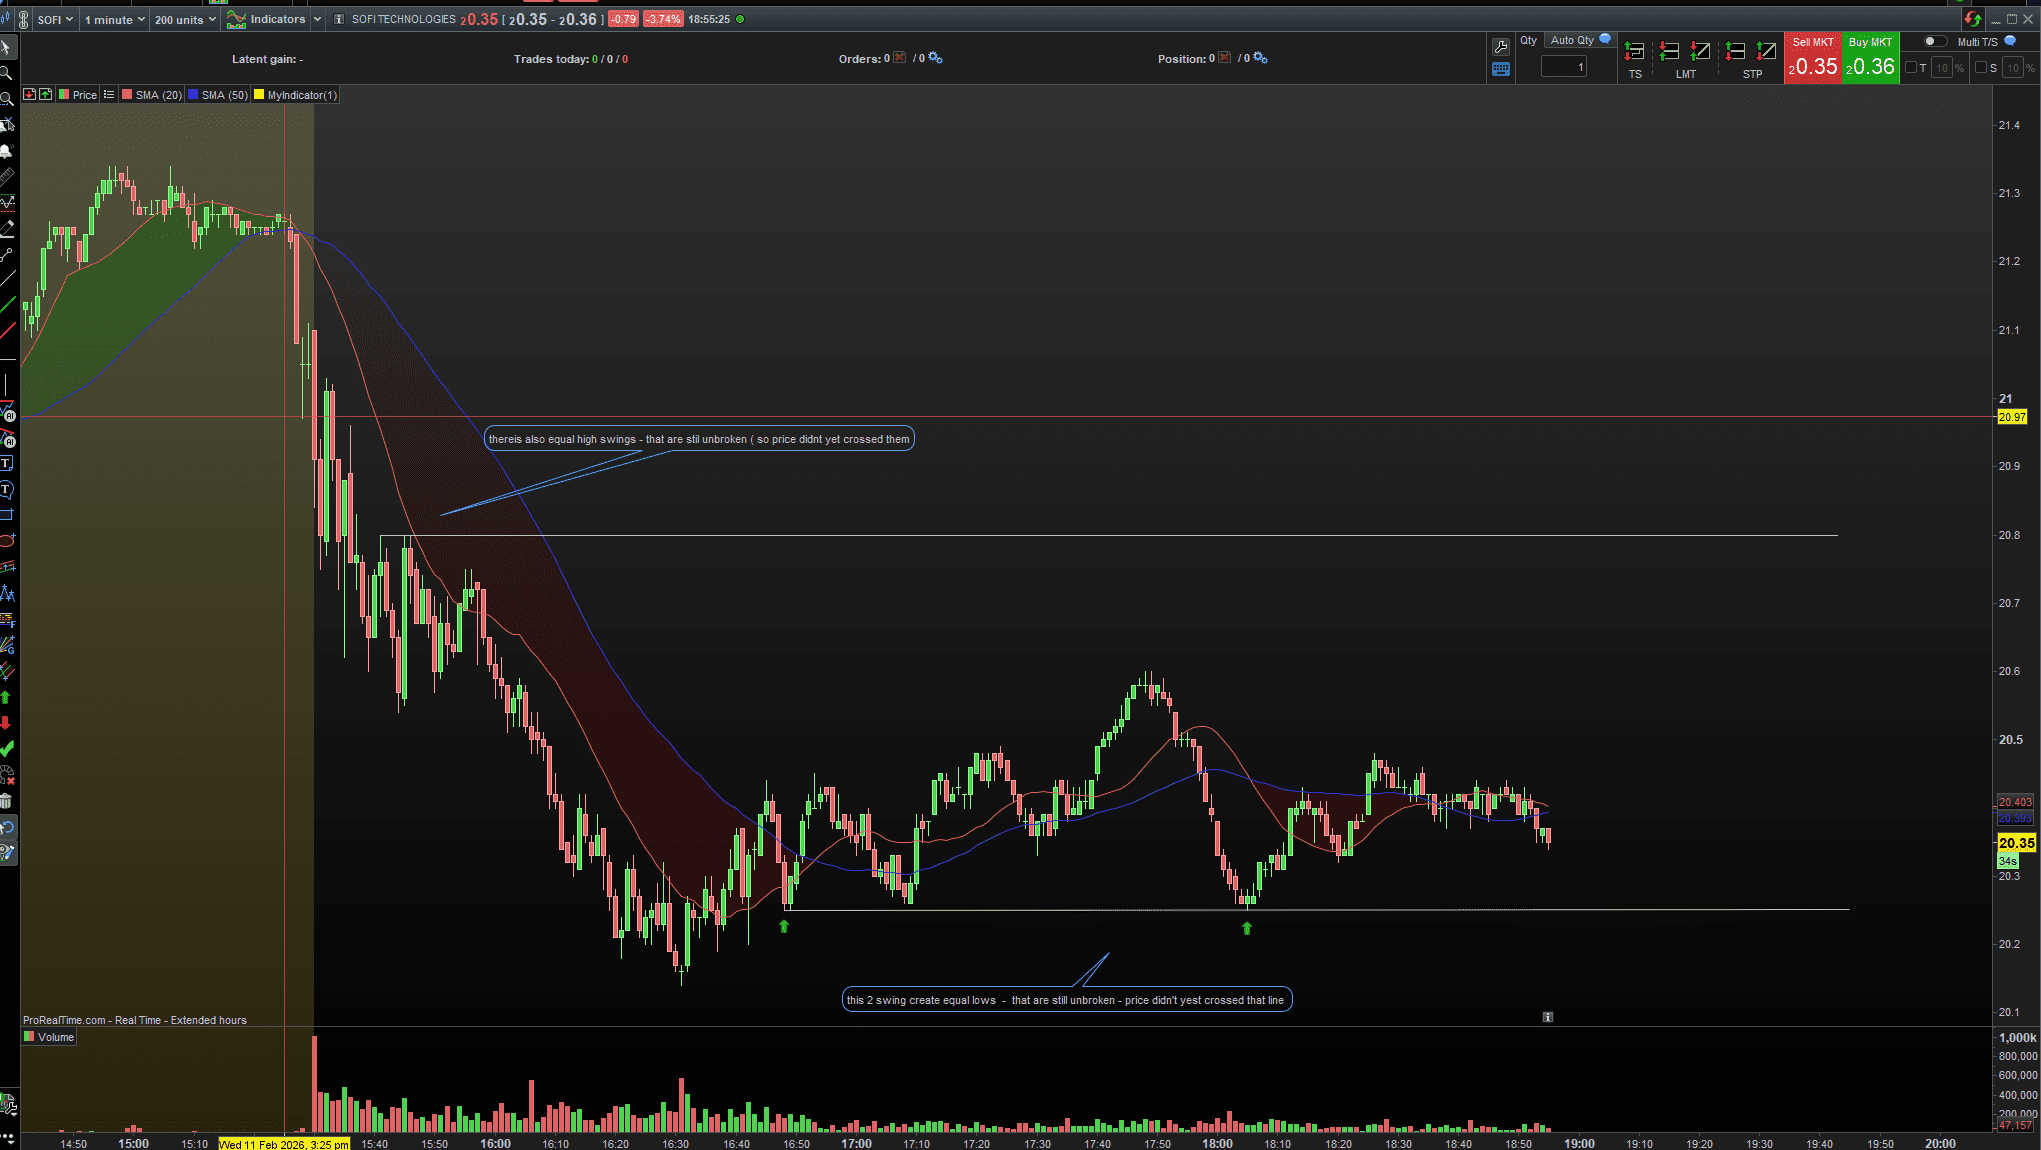
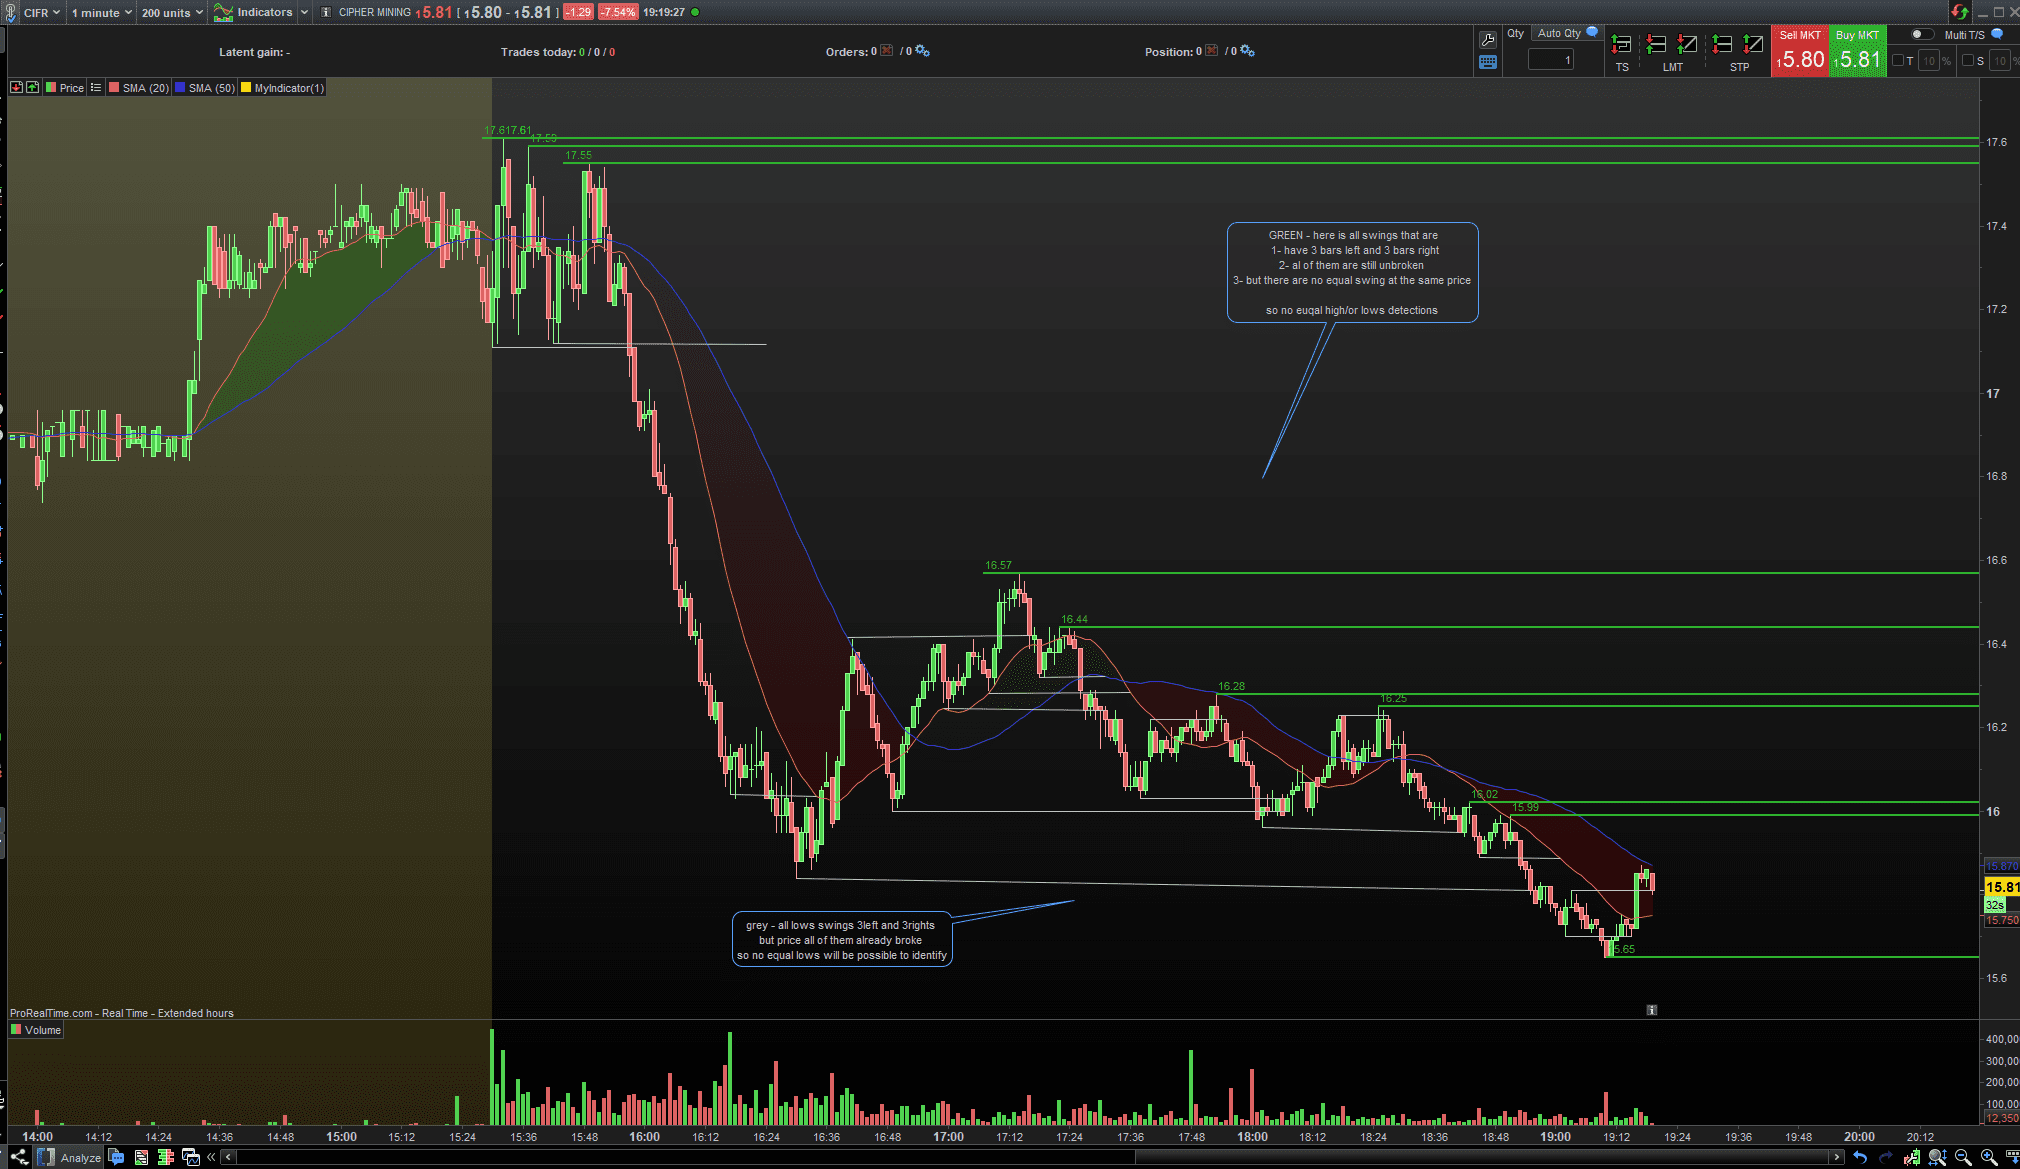
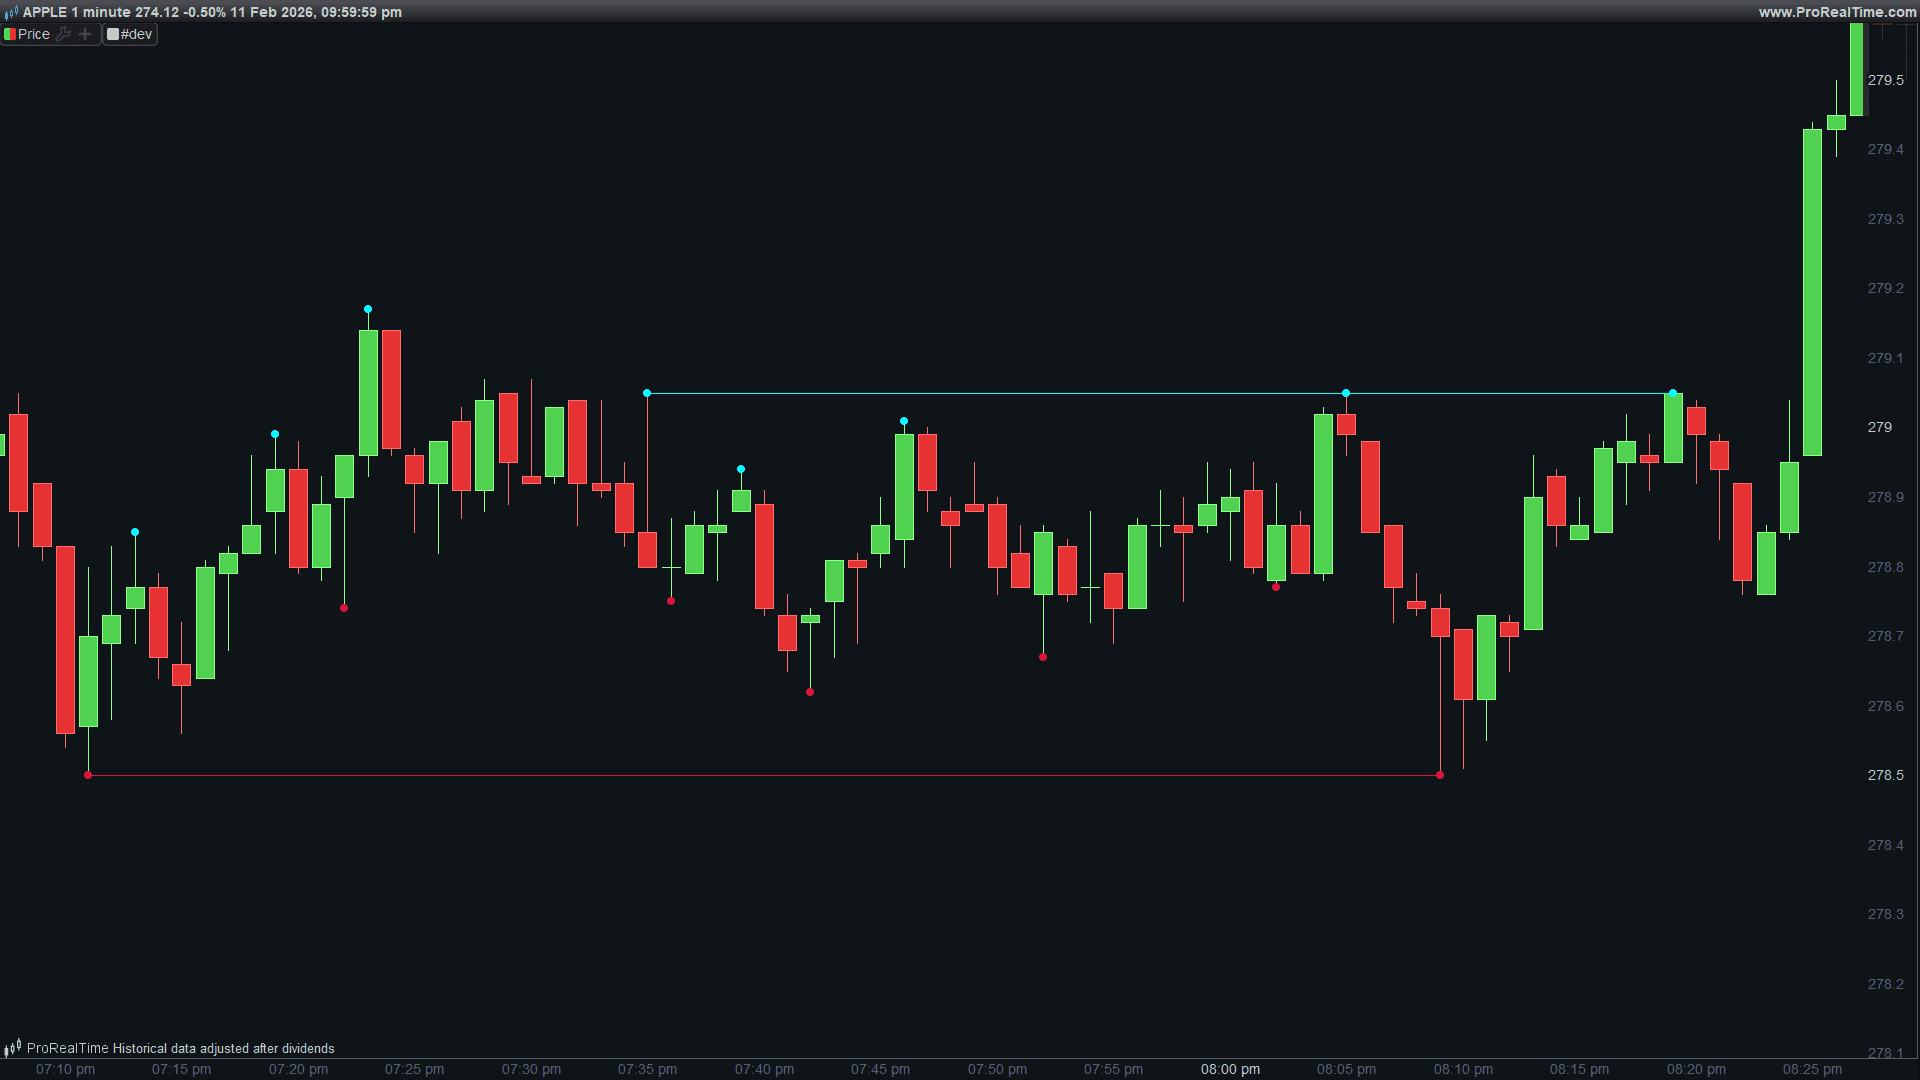
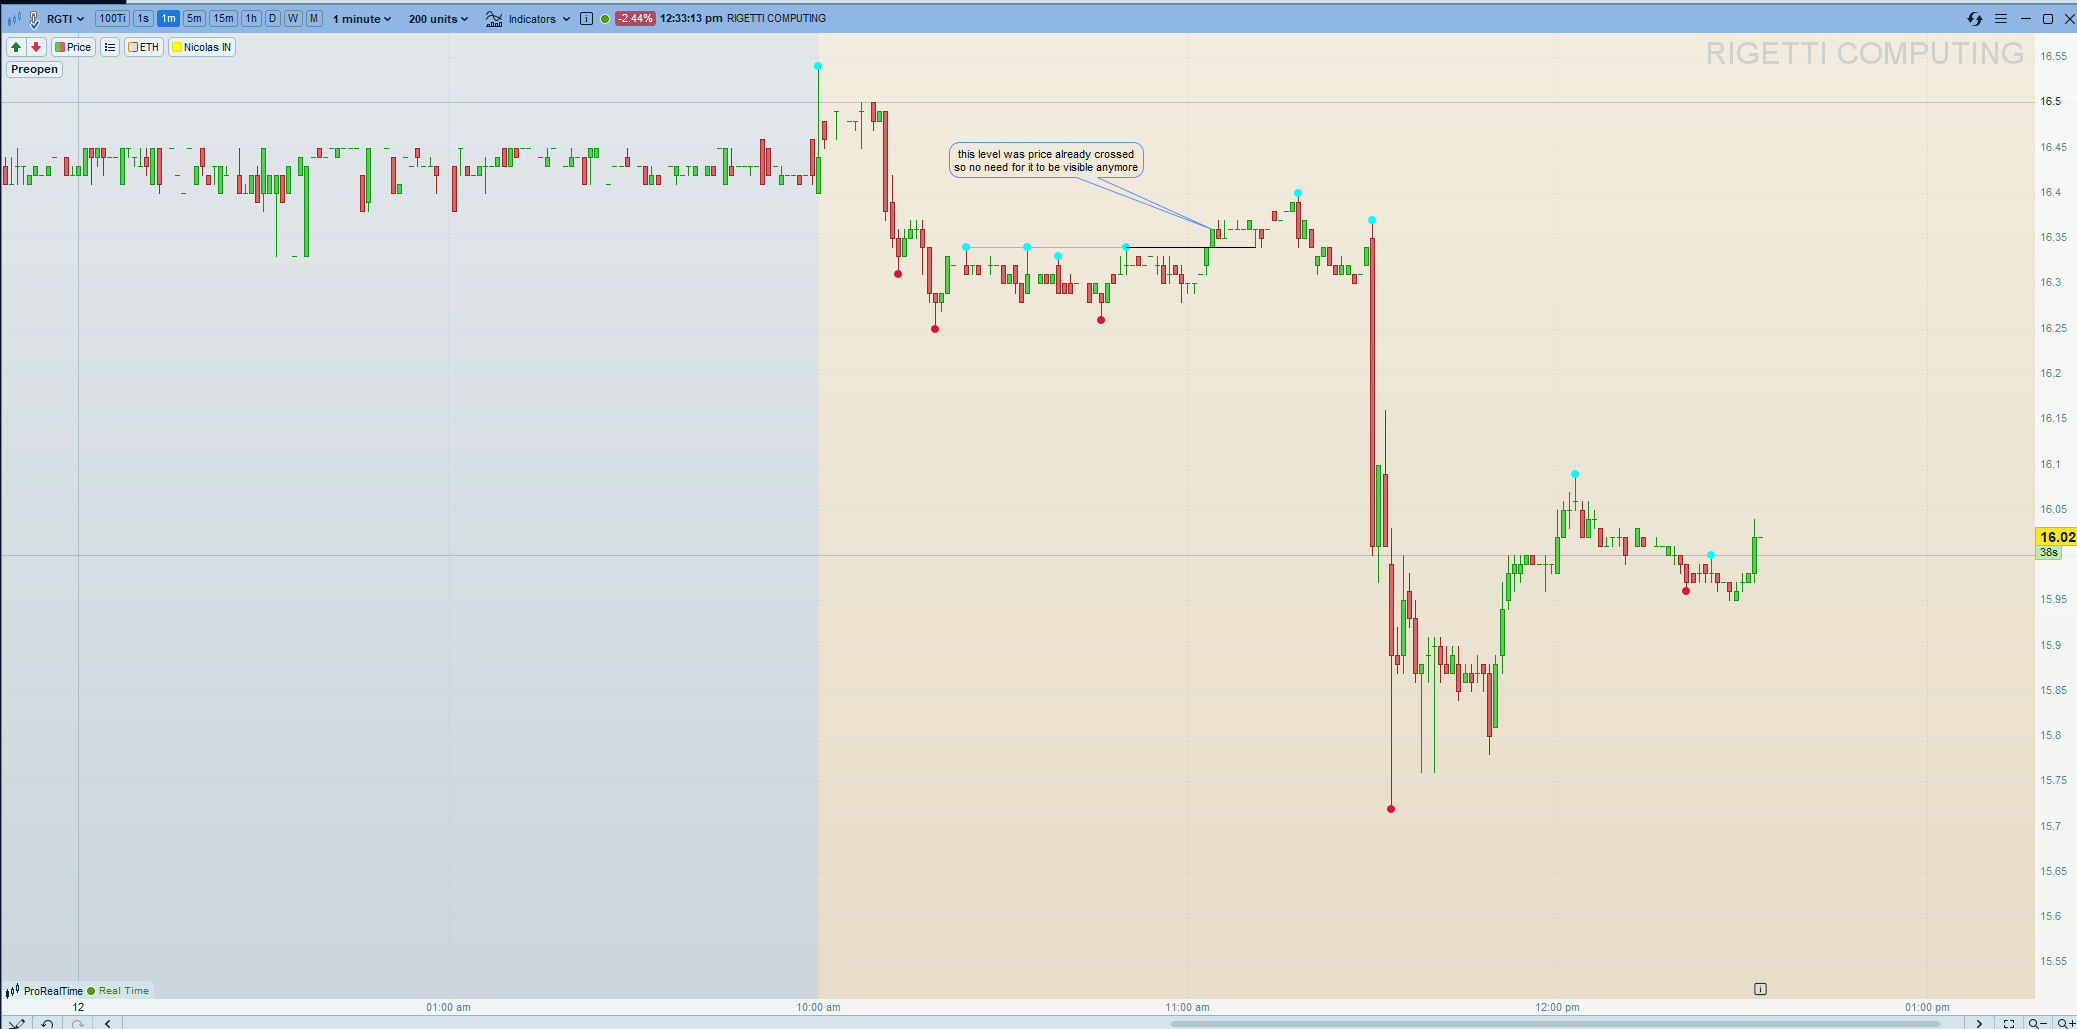
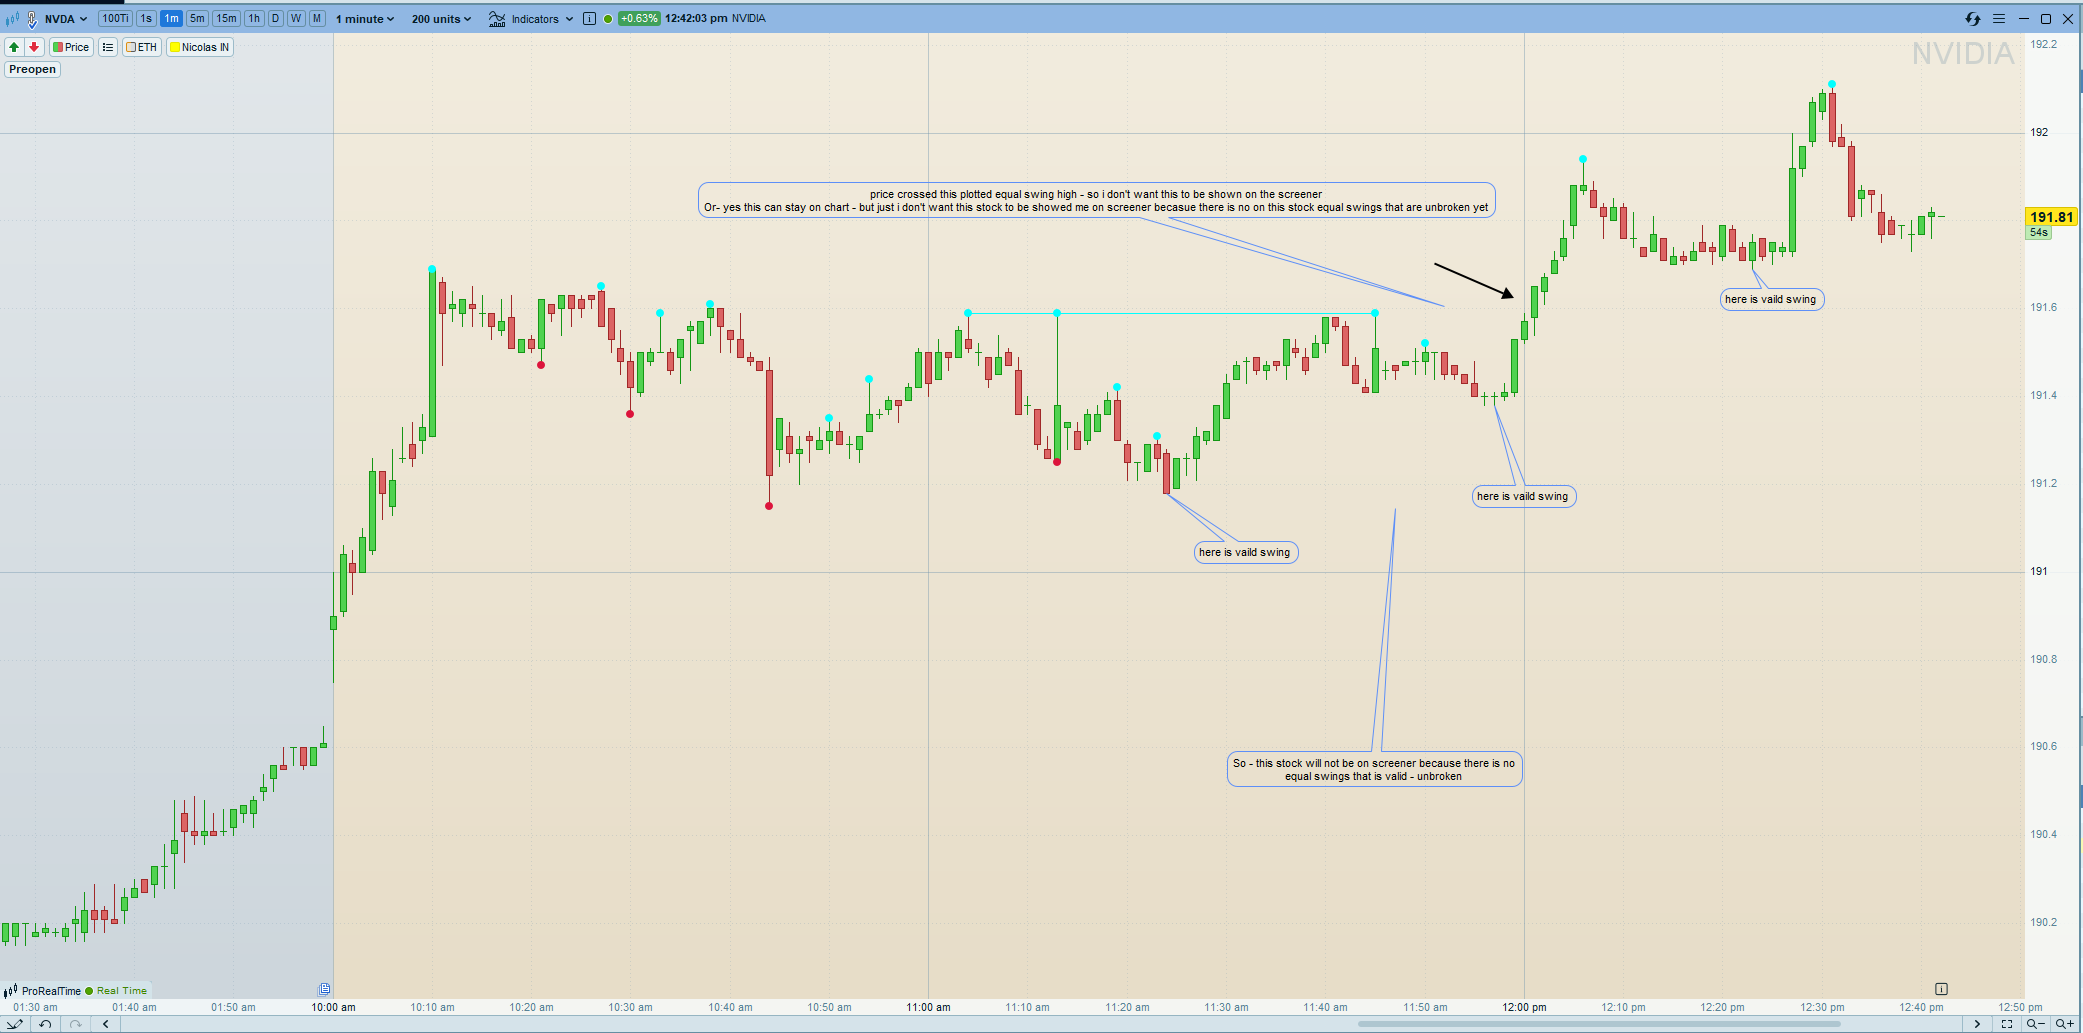
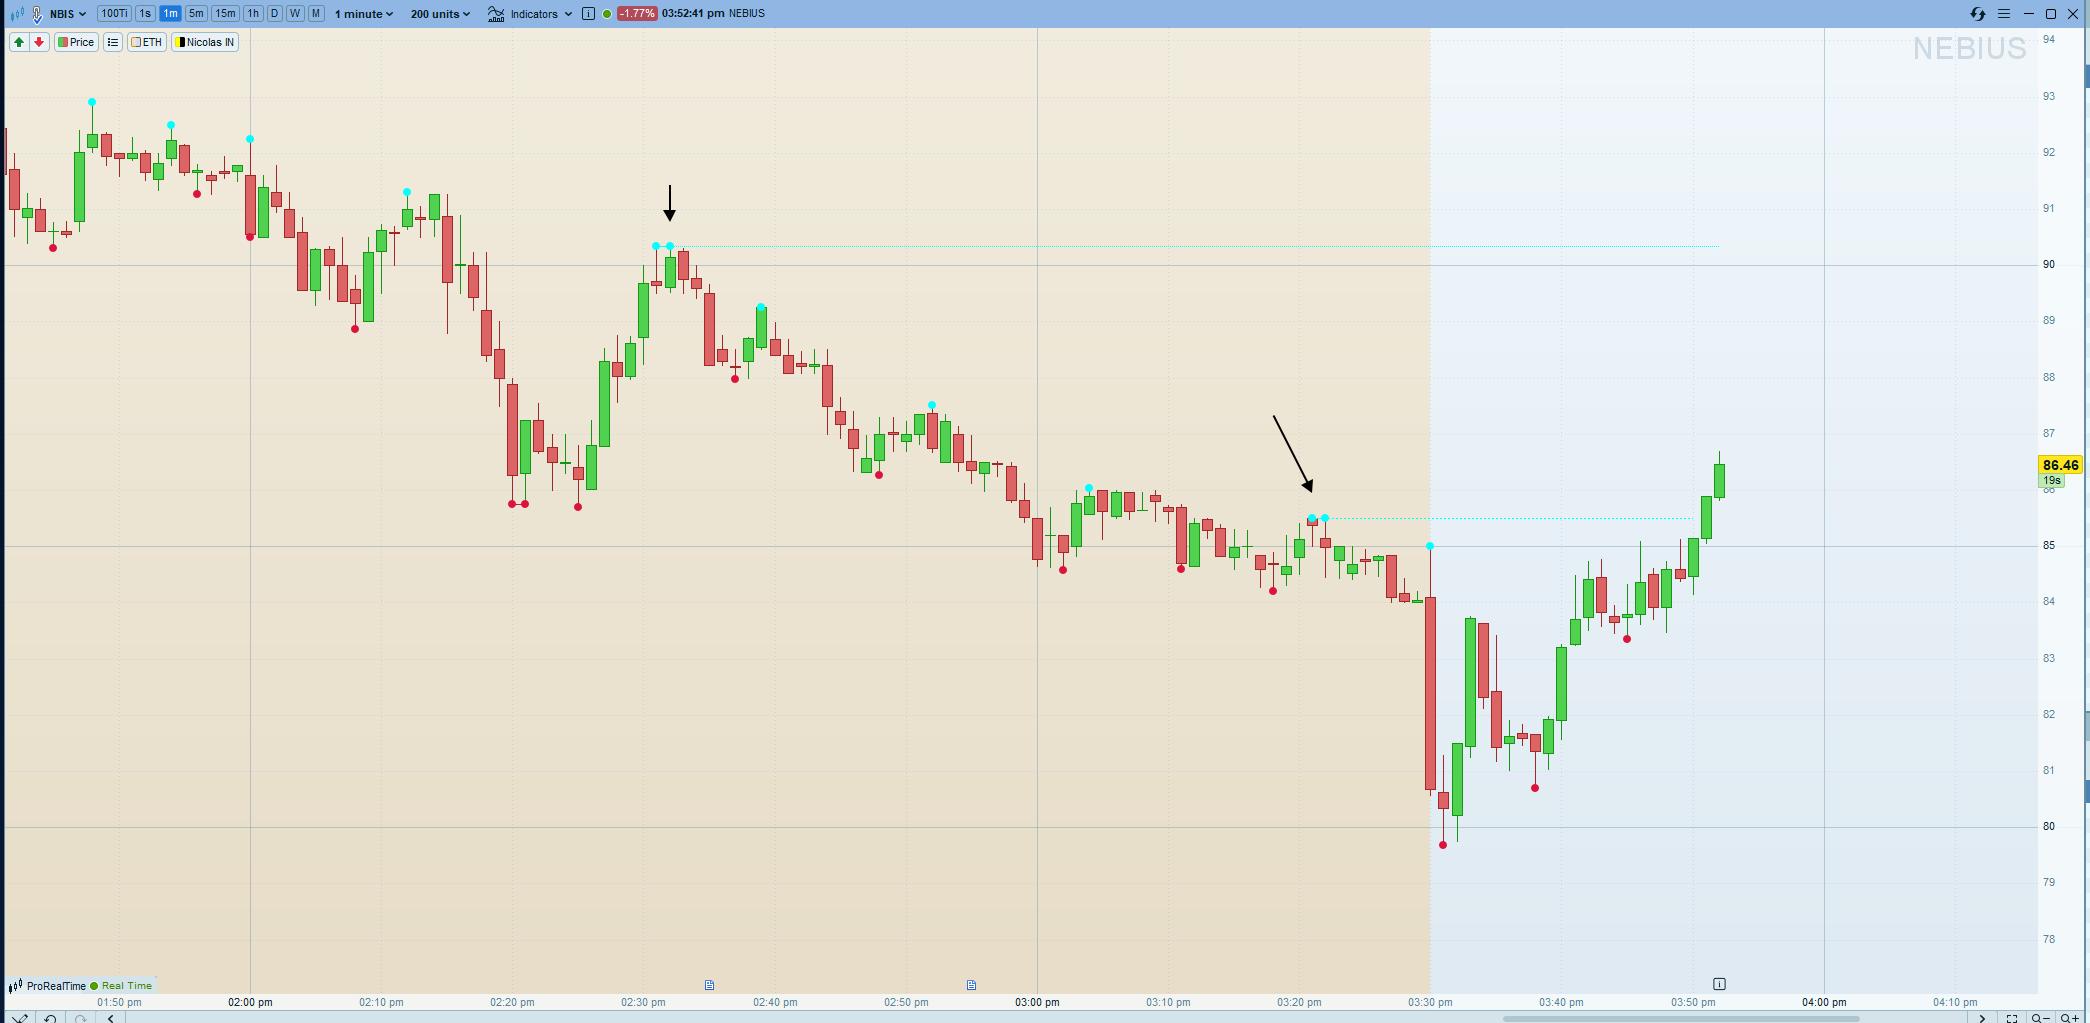
    3- Next filter is I want to see only equal swings that price is not broke, or not crossed yet.

    As you can see equal highs at price 279.05 that was identified previously, price already crossed.

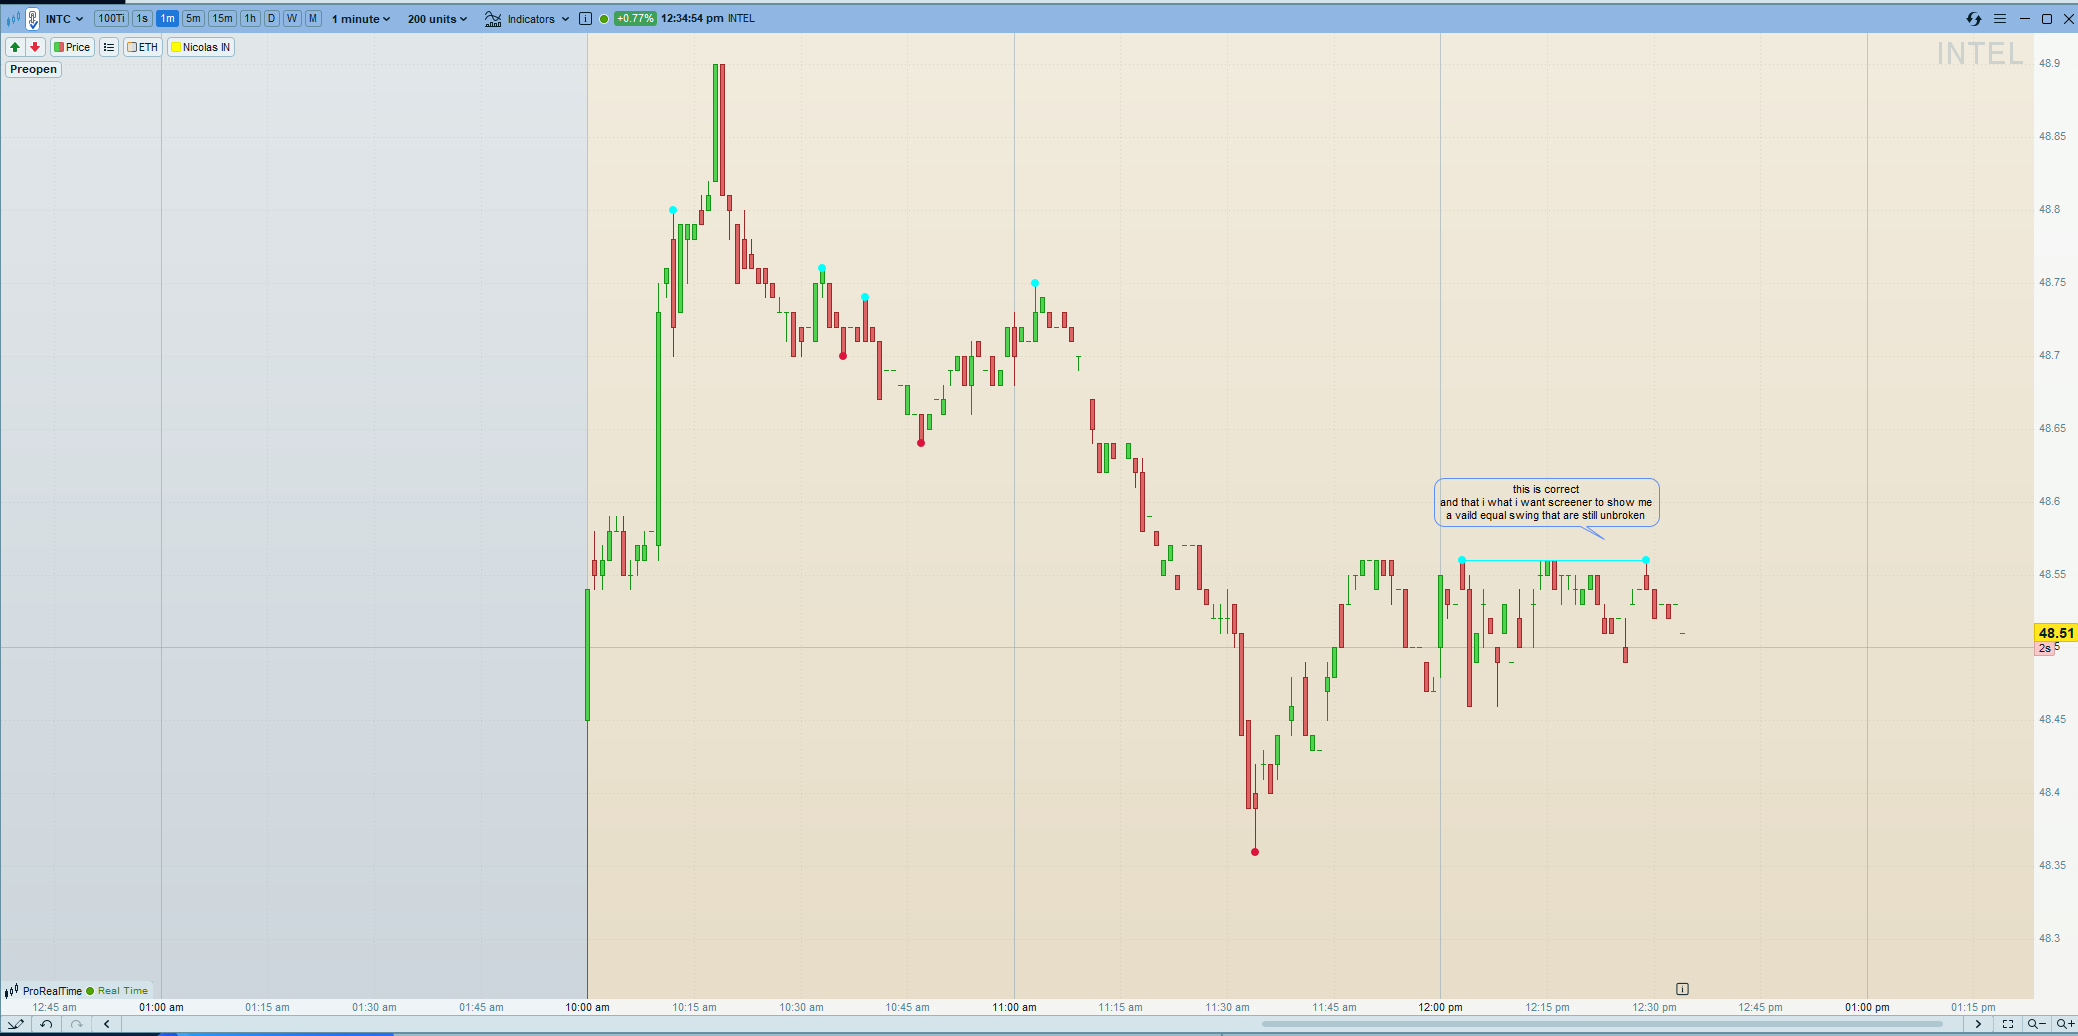
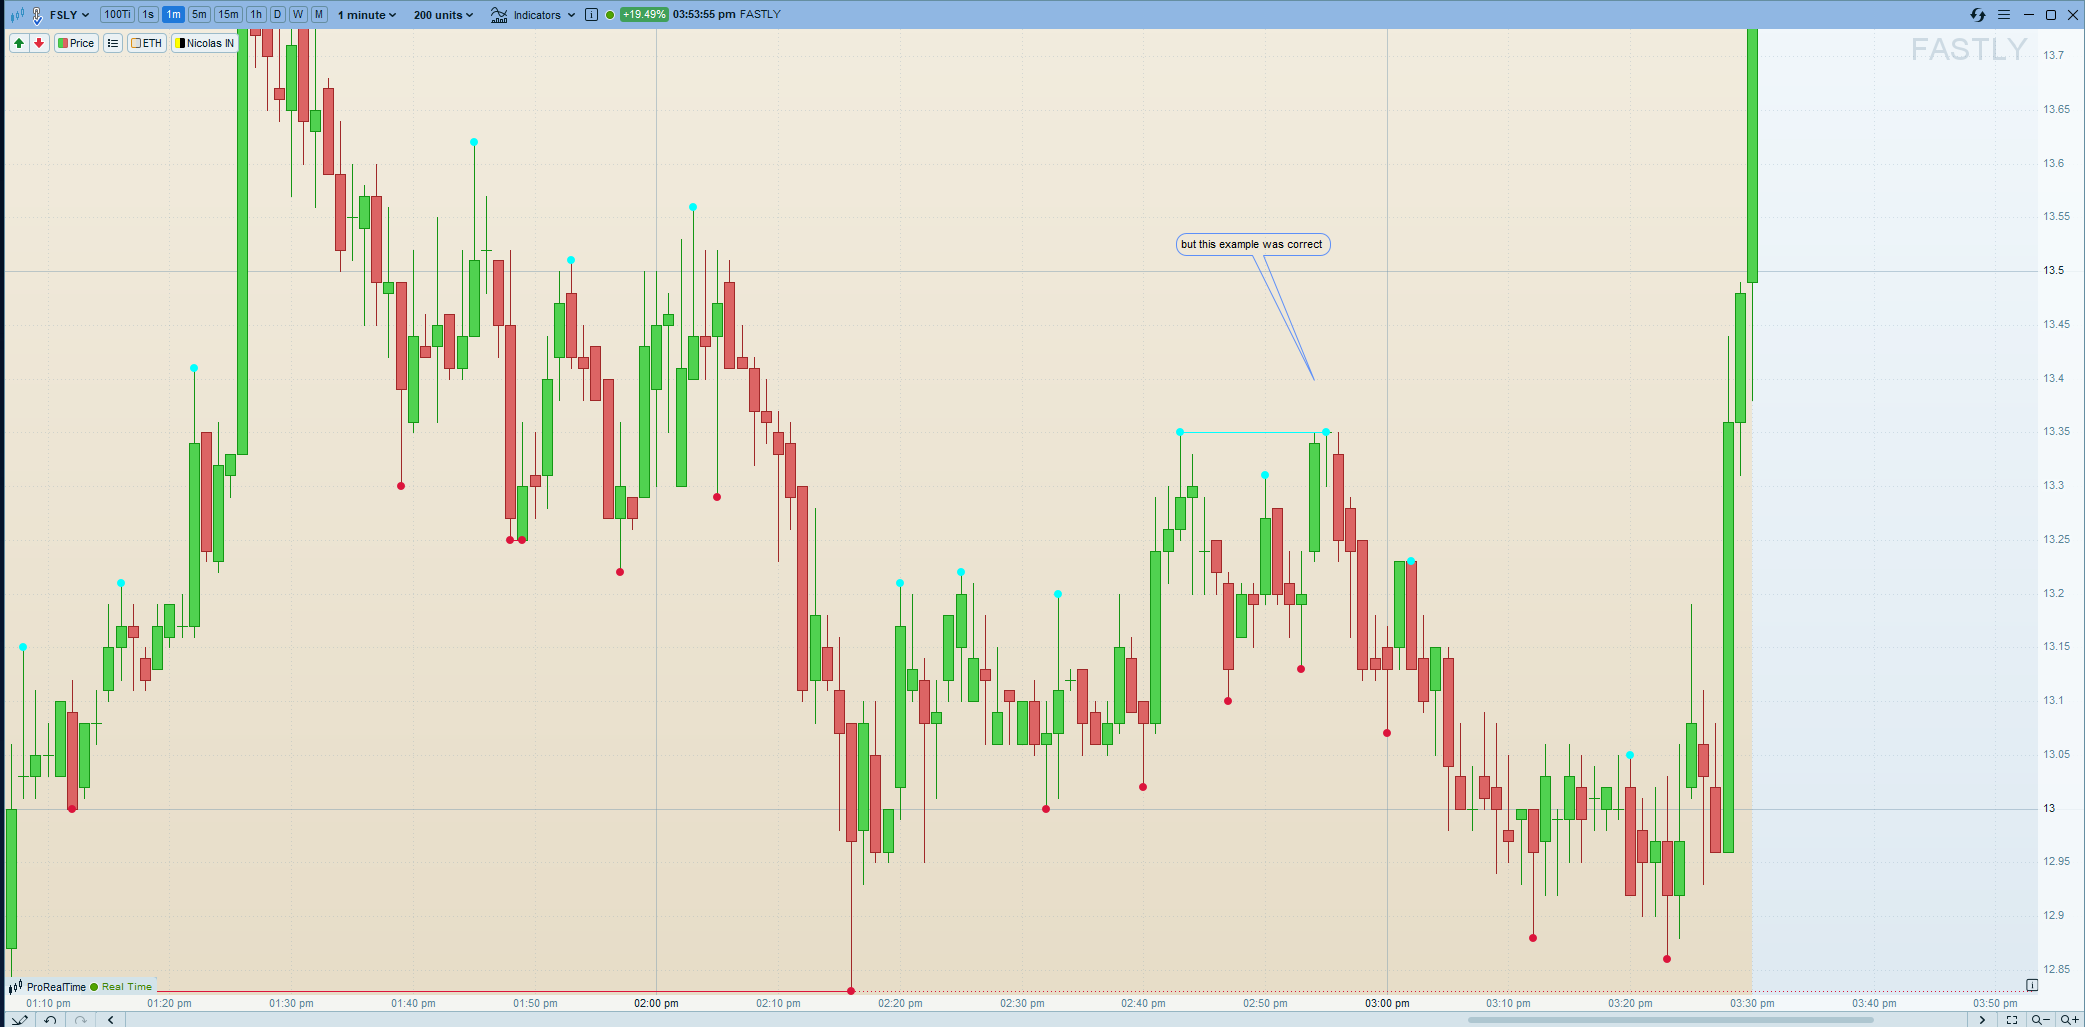
    but there is on today chart is equal swing lows at 278.50 that are unbroken/uncrossed.


    And that is main goal, i want screener to screen for stocks that :

    • today formed equal swings that are unbroken yet, and pop up me stock as fast as this 3bars right high/low confirmed.


    Hope this makes more sense.

    Thank you guys for helping, didn’t saw this much help in other community before.


    Screenshot-2026-02-12-at-11.21.34.png Screenshot-2026-02-12-at-11.21.34.png Screenshot-2026-02-12-at-11.23.12-scaled.png Screenshot-2026-02-12-at-11.23.12-scaled.png Screenshot-2026-02-12-at-11.30.45-scaled.png Screenshot-2026-02-12-at-11.30.45-scaled.png
    #257913 quote
    Nicolas
    Keymaster
    Master

    This pivot code reflects exactly how are detected pivots in the code of my previous post. It is just basic Williams Fractals. Did you try it? The same exact levels as your examples were detected. I bet we are near of what you expect?

    AAPL-1-minute.png AAPL-1-minute.png
    #257920 quote
    Nicolas
    Keymaster
    Master

    So if i’m not wrong, we want to give alerts if screener detect an unbroken 2 points high or low (examples attached with dotted line in cyan), Apple and Bank Of America. Right?

    AAPL-1-minute_unbroken.png AAPL-1-minute_unbroken.png BAC-1-minute.png BAC-1-minute.png
    #257923 quote
    TheMik
    Participant
    Junior

    Hi Nicolas,

    Thanks for your reply.

    The “points and segments only for the current day” part is perfect – that’s exactly what I wanted and where i had problems previously

    I’ve attached more screenshots, especially for AAPL. I’m a bit confused by the red/blue dots that mark swings: in some places where the 3‑left / 3‑right rule should give a swing, there is no dot. I tried to explain this directly on the chart.

    So I’m not sure whether: the indicator is missing some valid swings, or it just does’nt draw them ?

    My questions:

    1. If the indicator doesn’t draw a dot at a swing, does that mean it has not been recognised as a swing ?

    And there is also a correctly identified lines, but i see that some of them alreay broken.

    1. I see the indicator connecting dots with lines, but in the screener I don’t want equal swings that have already been broken/crossed

    So again

    • correctly idendifying all swings
    • draw or connect swings that have equal price and are still unbroken = show unbroken equal swing on screener


    Yes- your last answer is exactly correct

    Zrzut-ekranu-2026-02-12-123328.png Zrzut-ekranu-2026-02-12-123328.png Zrzut-ekranu-2026-02-12-123502.png Zrzut-ekranu-2026-02-12-123502.png Zrzut-ekranu-2026-02-12-124210.png Zrzut-ekranu-2026-02-12-124210.png Zrzut-ekranu-2026-02-12-131759.png Zrzut-ekranu-2026-02-12-131759.png
    #257926 quote
    TheMik
    Participant
    Junior

    On your last screenshots you can see that the indicator missed some swings on both tickers It doesn’t identify all swings as the TradingView indicator I showed you, so there is a clear difference in swing detection between the two.

    For me it doesn’t matter will it draw dots on swings or not.

    The main thing is that when they turn out to be the same equal , he doesn’t miss them.


    #257928 quote
    Nicolas
    Keymaster
    Master

    There was indeed a small error in finding the low points in the last code. Please understand that this indicator is a proof of concept and not a finished product, given the complexity of the request and our own interpretation in logic code. I understand that the points are not important to you; they are simply a visual aid to help us understand and debug. Without these points, how would we have known that they were missing swing lows?

    Below is the latest version. Here I’ve plotted all the detections. However, only the thresholds that haven’t been crossed since their detection are shown as a dotted line up to the current bar. Is this work for you? If so, I’ll consider creating a version compatible with the screener, and then the screener itself.

     defparam drawonlastbaronly=false
    
    if day<>day[1] or intradaybarindex=0 then
       unset($peak)
       unset($peakbar)
       unset($trough)
       unset($troughbar)
       i=0
       j=0
    endif
    
    Peak1      = (high[3] > high[4]) AND (high[3] > high[5]) AND (high[3] > high[6])
    Peak2      = (high[3] > high[2]) AND (high[3] > high[1]) AND (high[3] > high[0])
    Peak       = Peak1 AND Peak2
    if peak then
       // drawpoint(barindex[3],high[3],2) coloured("cyan")
       $peak[i]=high[3]
       $peakbar[i]=barindex[3]
       i=i+1
    endif
    
    Trough1      = (low[3] < low[4]) AND (low[3] < low[5]) AND (low[3] < low[6])
    Trough2      = (low[3] < low[2]) AND (low[3] < low[1]) AND (low[3] < low[0])
    Trough       = Trough1 AND Trough2
    if Trough   then
       //drawpoint(barindex[3],low[3],2) coloured("crimson")
       $trough[j]=low[3]
       $troughbar[j]=barindex[3]
       j=j+1
    endif
    
    if islastbarupdate then
       if i>0 then
          for k = 0 to i-1 do
             drawpoint($peakbar[k], $peak[k],2) coloured("cyan")
             for l = 0 to i-1 do
                if $peakbar[l]<>$peakbar[k] then
                   diff = abs(round($peak[l],2) - round($peak[k],2))
                   if diff = 0 then //equal price
                      //find breakout
                      period = max(1,max($peakbar[l],$peakbar[k]) - min($peakbar[l],$peakbar[k]))
                      decay = max(1,barindex-max($peakbar[l],$peakbar[k]))
                      hh = highest[period](high)[decay]
                      if hh<=max($peak[l],$peak[k]) then //no breakout at that time
                         drawsegment($peakbar[l],$peak[l], $peakbar[k], $peak[k]) coloured("cyan")
                         currPeriod = max(1,barindex-max($peakbar[l],$peakbar[k]))
                         currHH = highest[currPeriod](high)
                         //test if no broken since (real time)
                         if currHH<=max($peak[l],$peak[k]) then //no breakout since
                            drawsegment($peakbar[l],$peak[l], barindex, $peak[l]) coloured("cyan") style(dottedline4)
                         endif
                      endif
                   endif
                endif
             next
          next
       endif
       
       if j>0 then
          for k = 0 to j-1 do
             drawpoint($troughbar[k], $trough[k],2) coloured("crimson")
             for l = 0 to i-1 do
                if $troughbar[l]<>$troughbar[k] then
                   diff = abs(round($trough[l],2) - round($trough[k],2))
                   if diff = 0 then //equal price
                      //find breakout
                      period = max(1,max($troughbar[l],$troughbar[k]) - min($troughbar[l],$troughbar[k]))
                      decay = max(1,barindex-max($troughbar[l],$troughbar[k]))
                      ll = lowest[period](low)[decay]
                      if ll>=min($trough[l],$trough[k]) then //no breakout at that time
                         drawsegment($troughbar[l],$trough[l], $troughbar[k], $trough[k]) coloured("crimson")
                         currPeriod = max(1,barindex-max($peakbar[l],$peakbar[k]))
                         currLL = lowest[currPeriod](low)
                         //test if no broken since (real time)
                         if currLL>=min($trough[l],$trough[k]) then //no breakout since
                            drawsegment($troughbar[l],$trough[l], barindex, $trough[l]) coloured("crimson") style(dottedline4)
                         endif
                      endif
                   endif
                endif
             next
          next
       endif
       
    endif
    
    return
    
    
    #257934 quote
    TheMik
    Participant
    Junior

    “only the thresholds that haven’t been crossed since their detection are shown as a dotted line up to the current bar.” this is working super well, perfect idea !

    I checked some charts and see why it dont identify all swings. 

    There may be on chart 2-3 consecutive candles with the same high/low- and they are no detecred as swing.

    nothing will explain it better than some screenshots. So I have atached what I mean


    After that, yes it’s perfectly work as needed. no way to do it better, and no need

    Zrzut-ekranu-2026-02-12-150402.png Zrzut-ekranu-2026-02-12-150402.png Zrzut-ekranu-2026-02-12-150854.png Zrzut-ekranu-2026-02-12-150854.png Zrzut-ekranu-2026-02-12-151109.png Zrzut-ekranu-2026-02-12-151109.png Zrzut-ekranu-2026-02-12-151506.png Zrzut-ekranu-2026-02-12-151506.png
    #257935 quote
    Nicolas
    Keymaster
    Master

    Indeed, swing trades are not usually validated if one of the surrounding candlesticks is equal. I understood that you wanted this in your last message, but I was waiting for you to bring it up before modifying the code. Below is the version that allows it:

    defparam drawonlastbaronly=false
    
    if day<>day[1] or intradaybarindex=0 then
       unset($peak)
       unset($peakbar)
       unset($trough)
       unset($troughbar)
       i=0
       j=0
    endif
    
    Peak1      = (high[3] >= high[4]) AND (high[3] > high[5]) AND (high[3] > high[6])
    Peak2      = (high[3] >= high[2]) AND (high[3] > high[1]) AND (high[3] > high[0])
    Peak       = Peak1 AND Peak2
    if peak then
       // drawpoint(barindex[3],high[3],2) coloured("cyan")
       $peak[i]=high[3]
       $peakbar[i]=barindex[3]
       i=i+1
    endif
    
    Trough1      = (low[3] <= low[4]) AND (low[3] < low[5]) AND (low[3] < low[6])
    Trough2      = (low[3] <= low[2]) AND (low[3] < low[1]) AND (low[3] < low[0])
    Trough       = Trough1 AND Trough2
    if Trough   then
       //drawpoint(barindex[3],low[3],2) coloured("crimson")
       $trough[j]=low[3]
       $troughbar[j]=barindex[3]
       j=j+1
    endif
    
    if islastbarupdate then
       if i>0 then
          hhcount=0
          for k = 0 to i-1 do
             drawpoint($peakbar[k], $peak[k],2) coloured("cyan")
             for l = 0 to i-1 do
                if $peakbar[l]<>$peakbar[k] then
                   diff = abs(round($peak[l],2) - round($peak[k],2))
                   if diff = 0 then //equal price
                      //find breakout
                      period = max(2,max($peakbar[l],$peakbar[k]) - min($peakbar[l],$peakbar[k]))
                      decay = max(1,barindex-max($peakbar[l],$peakbar[k]))
                      hh = highest[period](high)[decay]
                      if hh<=max($peak[l],$peak[k]) then //no breakout at that time
                         drawsegment($peakbar[l],$peak[l], $peakbar[k], $peak[k]) coloured("cyan")
                         currPeriod = max(2,barindex-max($peakbar[l],$peakbar[k]))
                         currHH = highest[max(1,currPeriod)](high)
                         //test if no broken since (real time)
                         if currHH<=max($peak[l],$peak[k]) then //no breakout since
                            drawsegment($peakbar[l],$peak[l], barindex, $peak[l]) coloured("cyan") style(dottedline4)
                            //drawtext("!",$peakbar[l],$peak[l]+averagetruerange[14], dialog,bold, 22)
                            hhcount=hhcount+1
                         endif
                      endif
                   endif
                endif
             next
          next
       endif
       
       if j>0 then
          llcount=0
          for k = 0 to j-1 do
             drawpoint($troughbar[k], $trough[k],2) coloured("crimson")
             for l = 0 to i-1 do
                if $troughbar[l]<>$troughbar[k] then
                   diff = abs(round($trough[l],2) - round($trough[k],2))
                   if diff = 0 then //equal price
                      //find breakout
                      period = max(2,max($troughbar[l],$troughbar[k]) - min($troughbar[l],$troughbar[k]))
                      decay = max(1,barindex-max($troughbar[l],$troughbar[k]))
                      ll = lowest[period](low)[decay]
                      if ll>=min($trough[l],$trough[k]) then //no breakout at that time
                         drawsegment($troughbar[l],$trough[l], $troughbar[k], $trough[k]) coloured("crimson")
                         currPeriod = max(2,barindex-max($peakbar[l],$peakbar[k]))
                         currLL = lowest[currPeriod](low)
                         //test if no broken since (real time)
                         if currLL>=min($trough[l],$trough[k]) then //no breakout since
                            drawsegment($troughbar[l],$trough[l], barindex, $trough[l]) coloured("crimson") style(dottedline4)
                            llcount=llcount+1
                         endif
                      endif
                   endif
                endif
             next
          next
       endif
       
    endif
    
    return hhcount as "unbroken highs count", llcount as "unbroken lows count"


    #257940 quote
    TheMik
    Participant
    Junior

    I see with new code, that when these surrounding candles are equal, the indicator thinks they are 2 separate swings and draws a line purely from this 2candles high, which is not entirely correct.

    This actually remains one swing, just formed by several consecutive candles.

    Everything else works perfectly.

    Zrzut-ekranu-2026-02-12-155245.png Zrzut-ekranu-2026-02-12-155245.png Zrzut-ekranu-2026-02-12-155359.png Zrzut-ekranu-2026-02-12-155359.png Zrzut-ekranu-2026-02-12-155533.png Zrzut-ekranu-2026-02-12-155533.png
Viewing 15 posts - 1 through 15 (of 31 total)
  • You must be logged in to reply to this topic.

Screener breakout swing tie highs and lows in 1 min


ProScreener: Market Scanners & Detection

New Reply
Author
author-avatar
TheMik @themik Participant
Summary

This topic contains 30 replies,
has 3 voices, and was last updated by Nicolas
9 hours, 24 minutes ago.

Topic Details
Forum: ProScreener: Market Scanners & Detection
Language: English
Started: 10/15/2025
Status: Active
Attachments: 38 files
Logo Logo
Loading...