// This source code is subject to the terms of the Mozilla Public License 2.0 at https://mozilla.org/MPL/2.0/
// © PtGambler
//@version=5
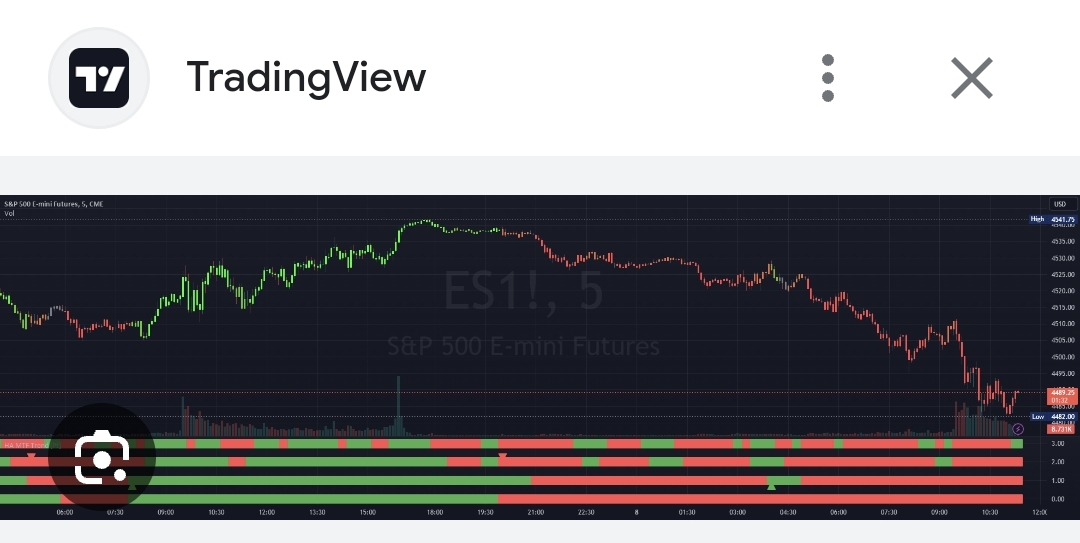
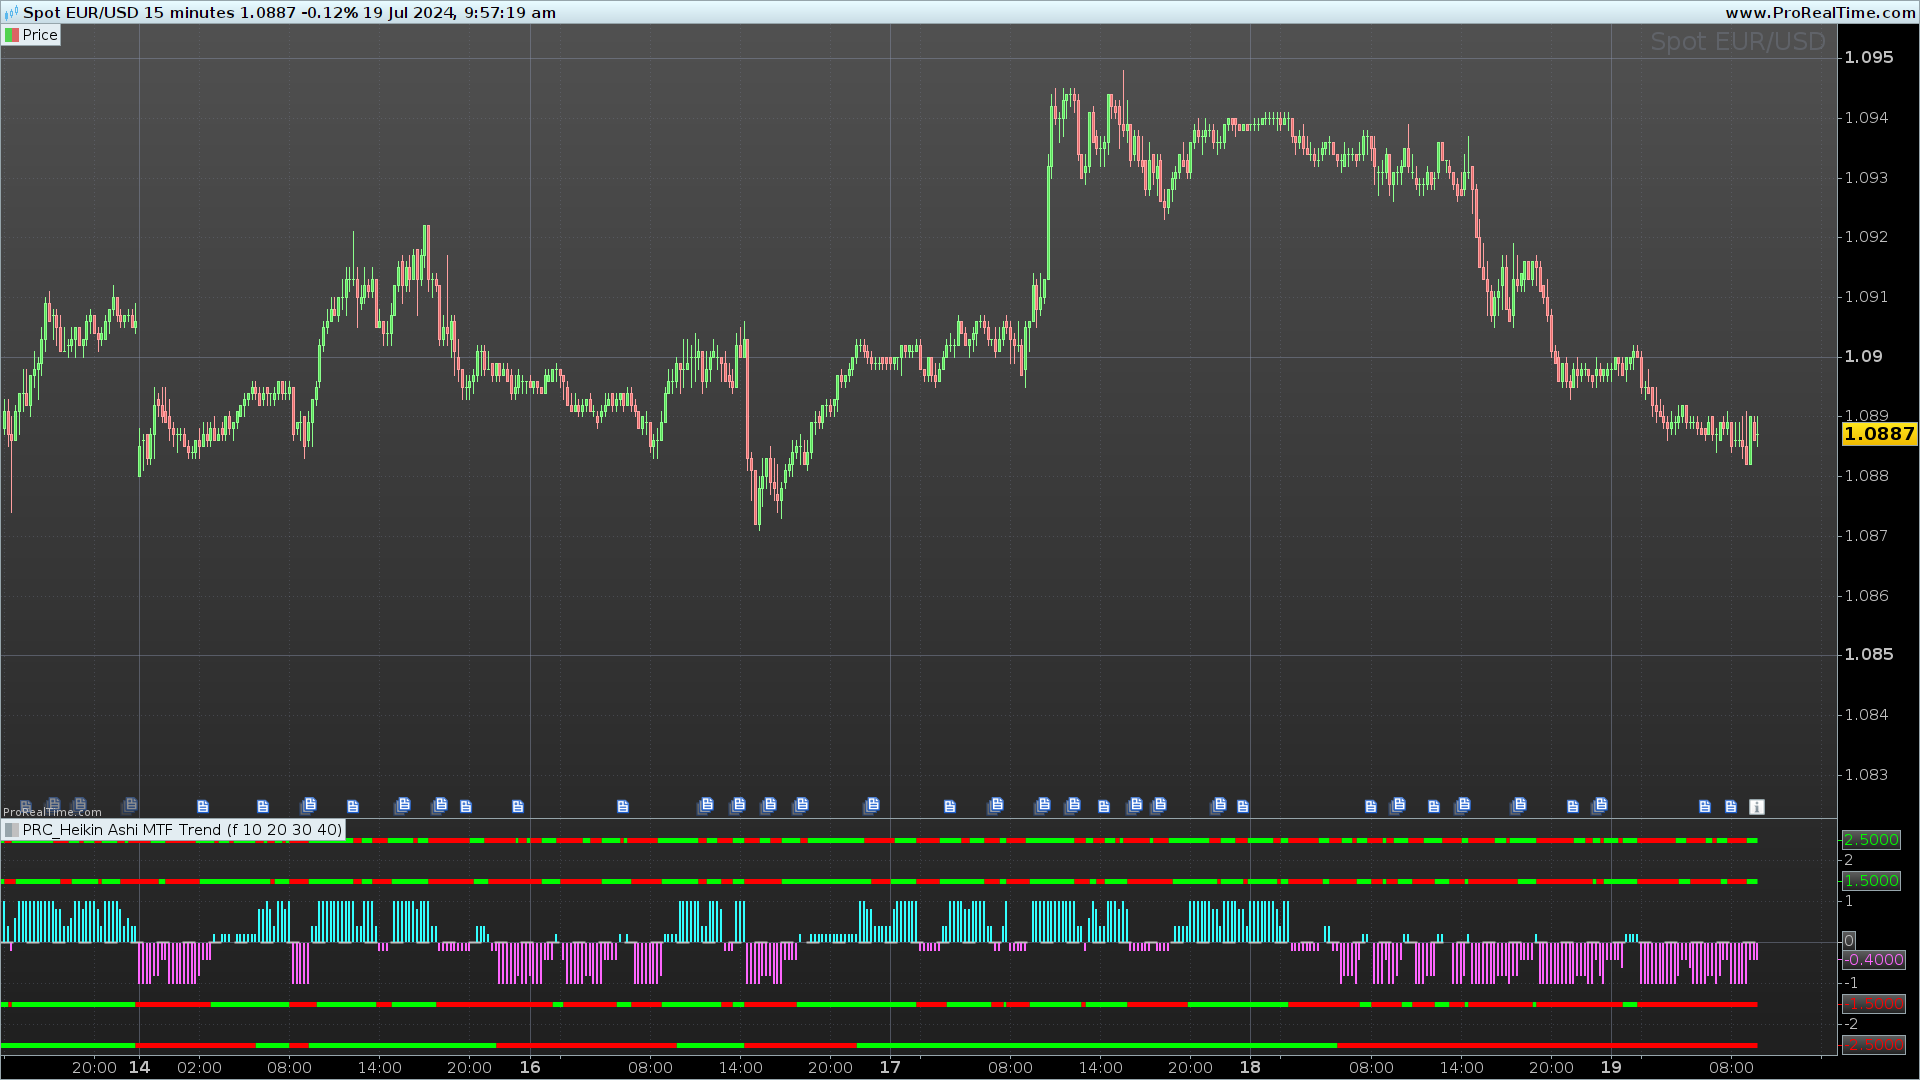
indicator(“Heikin Ashi MTF Trend [Pt]”, shorttitle = ‘HA MTF Trend [Pt]’, overlay = false)
group_display = ‘Display Options’
tf1 = input.timeframe(’15’, ‘Timeframe 1’, inline = ‘tf1’)
tf_weight1 = input.int(10, ‘Weight’, minval = 0, inline = ‘tf1′)
tf2 = input.timeframe(’30’, ‘Timeframe 2’, inline = ‘tf2’)
tf_weight2 = input.int(20, ‘Weight’, minval = 0, inline = ‘tf2′)
tf3 = input.timeframe(’60’, ‘Timeframe 3’, inline = ‘tf3’)
tf_weight3 = input.int(30, ‘Weight’, minval = 0, inline = ‘tf3’)
tf4 = input.timeframe(‘240’, ‘Timeframe 4’, inline = ‘tf4’)
tf_weight4 = input.int(40, ‘Weight’, minval = 0, inline = ‘tf4’)
show_bar_color = input.bool(true, ‘Show Bar Color’, inline = ‘col’)
strong_bear_col = input.color(color.rgb(255, 74, 74), ”, inline = ‘col’)
weak_bear_col = input.color(color.rgb(223, 126, 61), ”, inline = ‘col’)
weak_bull_col = input.color(color.rgb(157, 159, 46), ”, inline = ‘col’)
strong_bull_col = input.color(color.rgb(0, 255, 8), ”, inline = ‘col’)
show_hist_lookahead = input.bool(true, ‘Shows repainted historical HA bar colors’)
show_trend_signal = input.bool(false, ‘Show Weighted Trend Signal’)
display_style = input.string(‘Squares’, ‘Style’, options = [‘Squares’, ‘Lines’], group = group_display)
line_thickness = input.int(2, ‘ └ Line Thickness’, group = group_display)
bull_col = input.color(color.green, ‘Bull’, group = group_display, inline = ‘col2’)
bear_col = input.color(color.red, ‘Bear’, group = group_display, inline = ‘col2’)
lookahead_in = show_hist_lookahead ? barmerge.lookahead_on : barmerge.lookahead_off
total_weight = tf_weight1 + tf_weight2 + tf_weight3 + tf_weight4
//Non repainting security
f_security(_symbol, _res, _src, _repaint) =>
request.security(_symbol, _res, _src[_repaint ? 0 : barstate.isrealtime ? 1 : 0])[_repaint ? 0 : barstate.isrealtime ? 0 : 1]
ha_o1 = f_security(ticker.heikinashi(syminfo.tickerid), tf1, open, show_hist_lookahead)
ha_c1 = f_security(ticker.heikinashi(syminfo.tickerid), tf1, close, show_hist_lookahead)
ha_o2 = f_security(ticker.heikinashi(syminfo.tickerid), tf2, open, show_hist_lookahead)
ha_c2 = f_security(ticker.heikinashi(syminfo.tickerid), tf2, close, show_hist_lookahead)
ha_o3 = f_security(ticker.heikinashi(syminfo.tickerid), tf3, open, show_hist_lookahead)
ha_c3 = f_security(ticker.heikinashi(syminfo.tickerid), tf3, close, show_hist_lookahead)
ha_o4 = f_security(ticker.heikinashi(syminfo.tickerid), tf4, open, show_hist_lookahead)
ha_c4 = f_security(ticker.heikinashi(syminfo.tickerid), tf4, close, show_hist_lookahead)
// [ha_o1, ha_c1] = request.security(ticker.heikinashi(syminfo.tickerid), tf1, [open, close], lookahead = lookahead_in)
// [ha_o2, ha_c2] = request.security(ticker.heikinashi(syminfo.tickerid), tf2, [open, close], lookahead = lookahead_in)
// [ha_o3, ha_c3] = request.security(ticker.heikinashi(syminfo.tickerid), tf3, [open, close], lookahead = lookahead_in)
// [ha_o4, ha_c4] = request.security(ticker.heikinashi(syminfo.tickerid), tf4, [open, close], lookahead = lookahead_in)
ha_trend1 = ha_c1 > ha_o1 ? 1 : ha_c1 ha_o2 ? 1 : ha_c2 ha_o3 ? 1 : ha_c3 ha_o4 ? 1 : ha_c4 0 ? color.from_gradient(trend_score, 0, total_weight, weak_bull_col, strong_bull_col) : trend_score 0 and ta.change(math.sign(trend_score)), ‘Bull Trend Signal’, shape.triangleup, location.bottom, bull_col, size = size.small)
plotshape(show_trend_signal and trend_score 0 and trend_score[1] < 0, 'Bull Trend Signal Alert', 'MTF HA Bull Trend Signal')
alertcondition(trend_score 0, ‘Bear Trend Signal Alert’, ‘MTF HA Bear Trend Signal’)
f_drawLabelX(_x, _y, _text, _xloc, _yloc, _color, _style, _textcolor, _size, _textalign, _tooltip) =>
var id = label.new(_x, _y, _text, _xloc, _yloc, _color, _style, _textcolor, _size, _textalign, _tooltip)
label.set_xy(id, _x, _y)
label.set_text(id, _text)
label.set_tooltip(id, _tooltip)
label.set_textcolor(id, _textcolor)
id
if barstate.islast
f_drawLabelX(bar_index, lvl1, str.tostring(tf1), xloc.bar_index, yloc.price, chart.bg_color, label.style_label_left, chart.fg_color, size.small, text.align_left, ”)
f_drawLabelX(bar_index, lvl2, str.tostring(tf2), xloc.bar_index, yloc.price, chart.bg_color, label.style_label_left, chart.fg_color, size.small, text.align_left, ”)
f_drawLabelX(bar_index, lvl3, str.tostring(tf3), xloc.bar_index, yloc.price, chart.bg_color, label.style_label_left, chart.fg_color, size.small, text.align_left, ”)
f_drawLabelX(bar_index, lvl4, str.tostring(tf4), xloc.bar_index, yloc.price, chart.bg_color, label.style_label_left, chart.fg_color, size.small, text.align_left, ”)