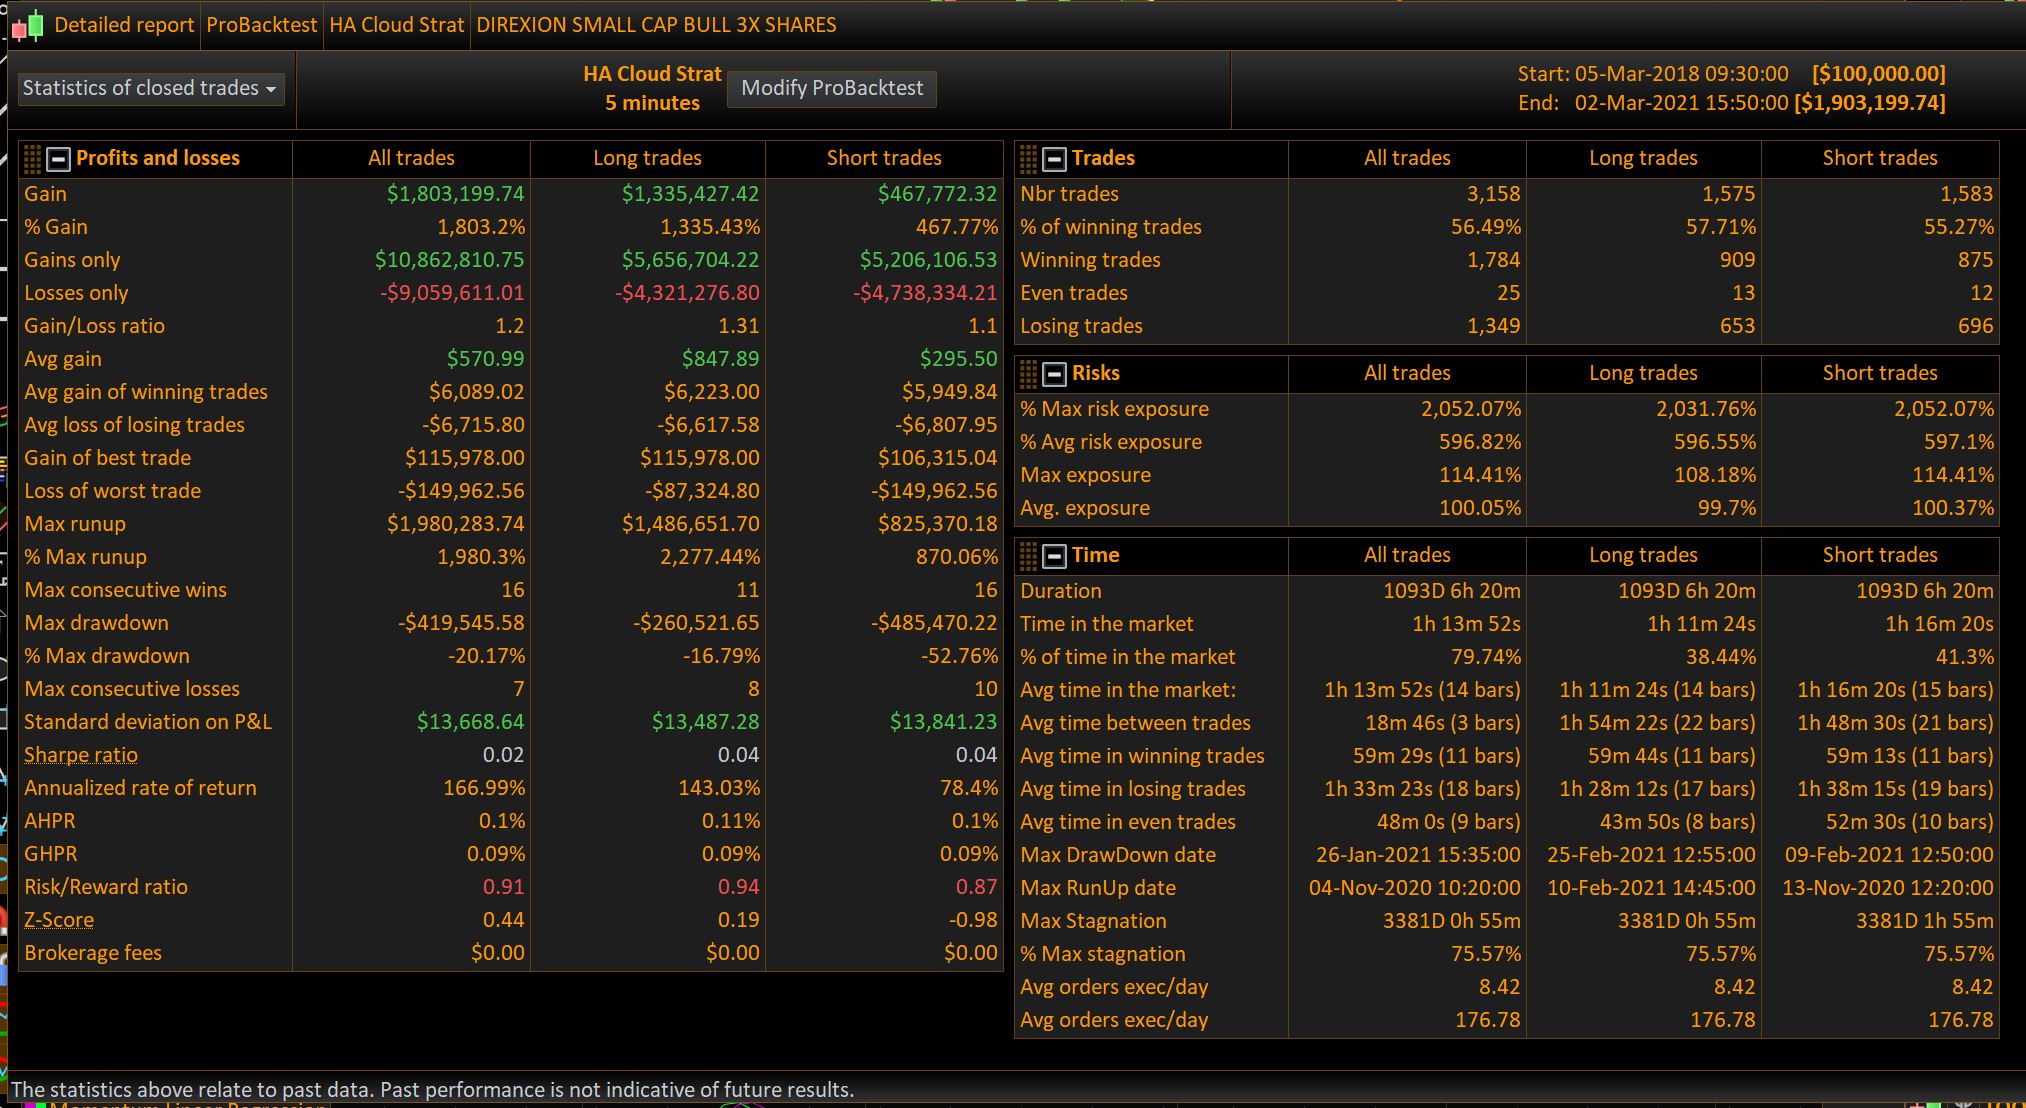
With the help of the community (Nonetheless, Nicolas, & Vonasi) I was able to turn the smoothed Heiken Ashi smoothed : Forum ProBuilder support – ProRealTime (prorealcode.com) from the blog into an equity strategy. I typically trade the leveraged small cap ETF TNA in the USA and so the backtest is on it.
I had luck going back 3 years on a 5 minute chart, but could not get to perform in other timeframes or longer and shorter horizons. I think something is here, but t needs works and I am open to ideas. I am thinking good meat, need sauce…
Code below and attached.
DEFPARAM CumulateOrders = False // Cumulating positions deactivated
DEFPARAM FLATBEFORE = 093000
DEFPARAM FlatAfter = 154500
capital = 100000 + strategyprofit
Equity = capital / close
myCurrentProfit = STRATEGYPROFIT

Price = CustomClose

//t and the deviation of the mean:
//t = 0 = average // Simple
//t = 1 = exponentialaverage
//t = 2 = weightedaverage
//t = 3 = wilderaverage
//t = 4 = triangularaverage
//t = 5 = endpointaverage
//t = 6 = timeseriesaverage
//t = 7 = Hull (PRT v11 only)
//t = 8 = ZeroLag (PRT v11 only)

P = 19 // p
P1 = 14 // p1
T = 5 // endpointaverage
T1 = 4 // triangularaverage

if barindex > p + 1 then
mo = average[p,t](open)
mc = average[p,t](close)
ml = average[p,t](low)
mh = average[p,t](high)
//endif

once haopen=mo
haclose=(mo+mc+ml+mh)/4
haopen=(haopen[1]+haclose[1])/2
endif

HAopen1 = average[p1,t1](haopen)
HAclose1 = average[p1,t1](haclose)

// Draw indicator
Graph HAclose1 COLOURED(34,139,3) AS "Heiken Smoothed Cloud Open"
Graph HAopen1 COLOURED(225,0,0) AS "Heiken Smoothed Cloud Close"

// Conditions to enter long positions

IF NOT LongOnMarket AND HAopen1 Crosses Over HAclose1 THEN
BUY Equity SHARES AT MARKET
ENDIF

// Conditions to exit long positions
If LongOnMarket AND HAopen1 Crosses Under HAclose1 THEN
SELL AT MARKET
ENDIF
//
//Conditions to enter short positions
IF NOT ShortOnMarket AND HAopen1 Crosses Under HAclose1 THEN
Sellshort Equity SHARES AT MARKET
ENDIF

// Conditions to exit short positions
IF ShortOnMarket AND HAopen1 Crosses Over HAclose1 THEN
EXITSHORT AT MARKET
ENDIF
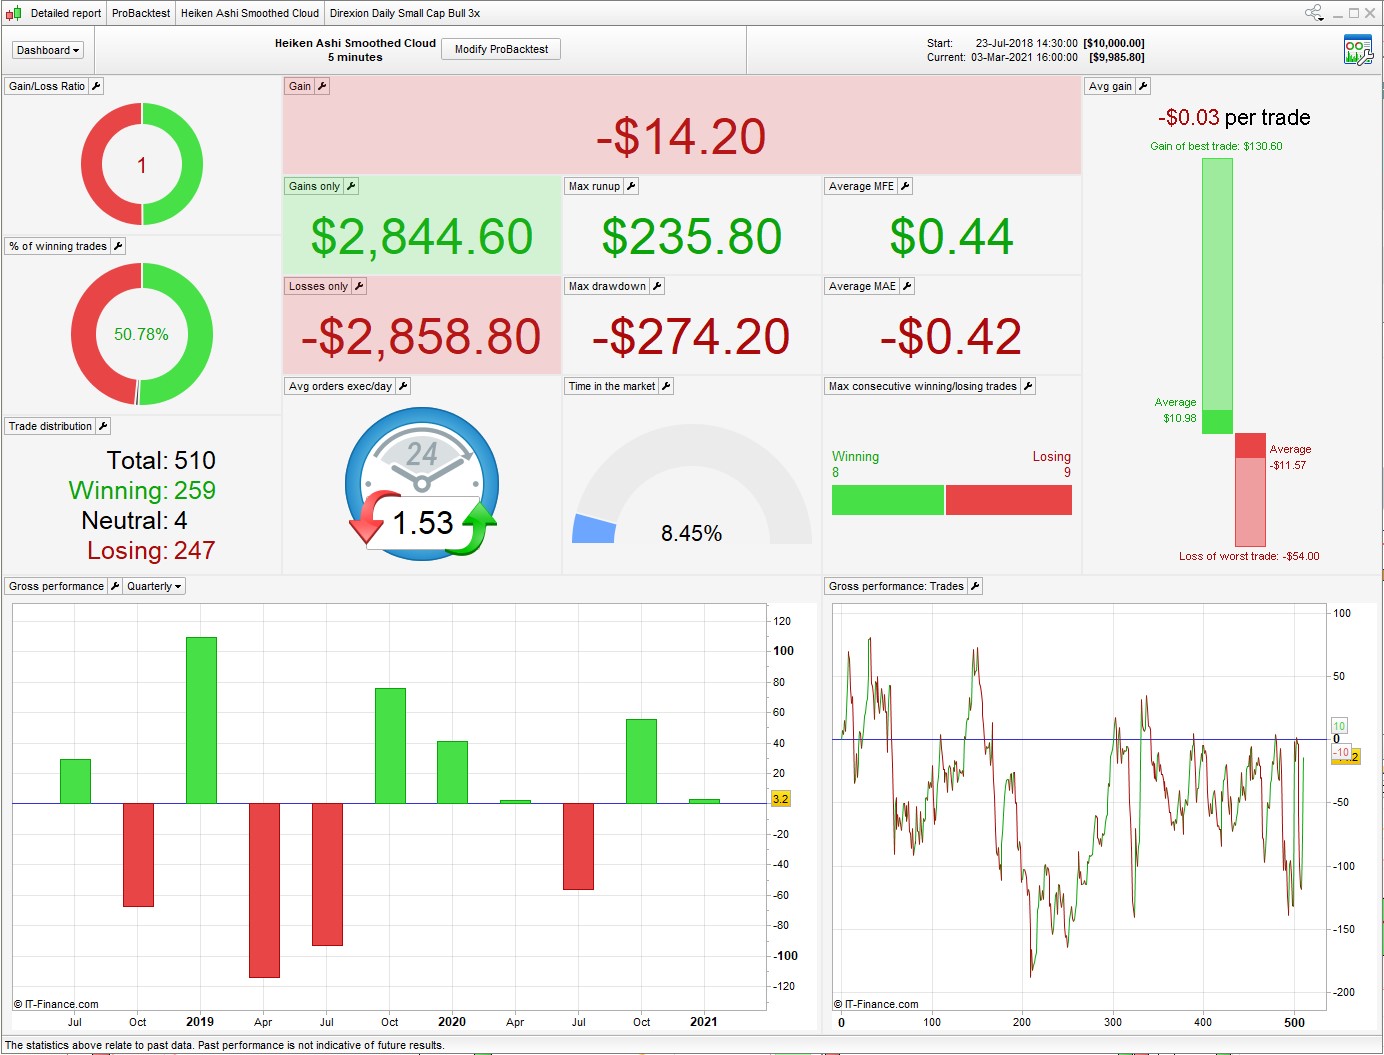
If I were you I’d try to re-optimize it for a major index – DJ or NASDAQ for example. Low liquidity on TNA means the spread is enormous and the margin requirement comparatively high.
Attached is a quick test with your MM switched off and Spread = 2. Position size = 20, roughly equivalent margin to $1 on the DJI
Actually you can ignore the result I attached as I forgot to alter the time settings for the UK. Running it on Wall St hours is better, but not great.
I think the spread is too high to make this work on that ETF.
I did not think of the spread as I normally trade on 4H charts and thus the spreads don’t bother me much as I’m not trying to pluck small gains, instead stay in a trade for days and catch the swing.
As I said prior, I like the idea of HA Cloud but it needs additional coding to work. I was my first code I have published.
 Paul
PaulParticipant
Master
@SB-FO thanks for publishing.
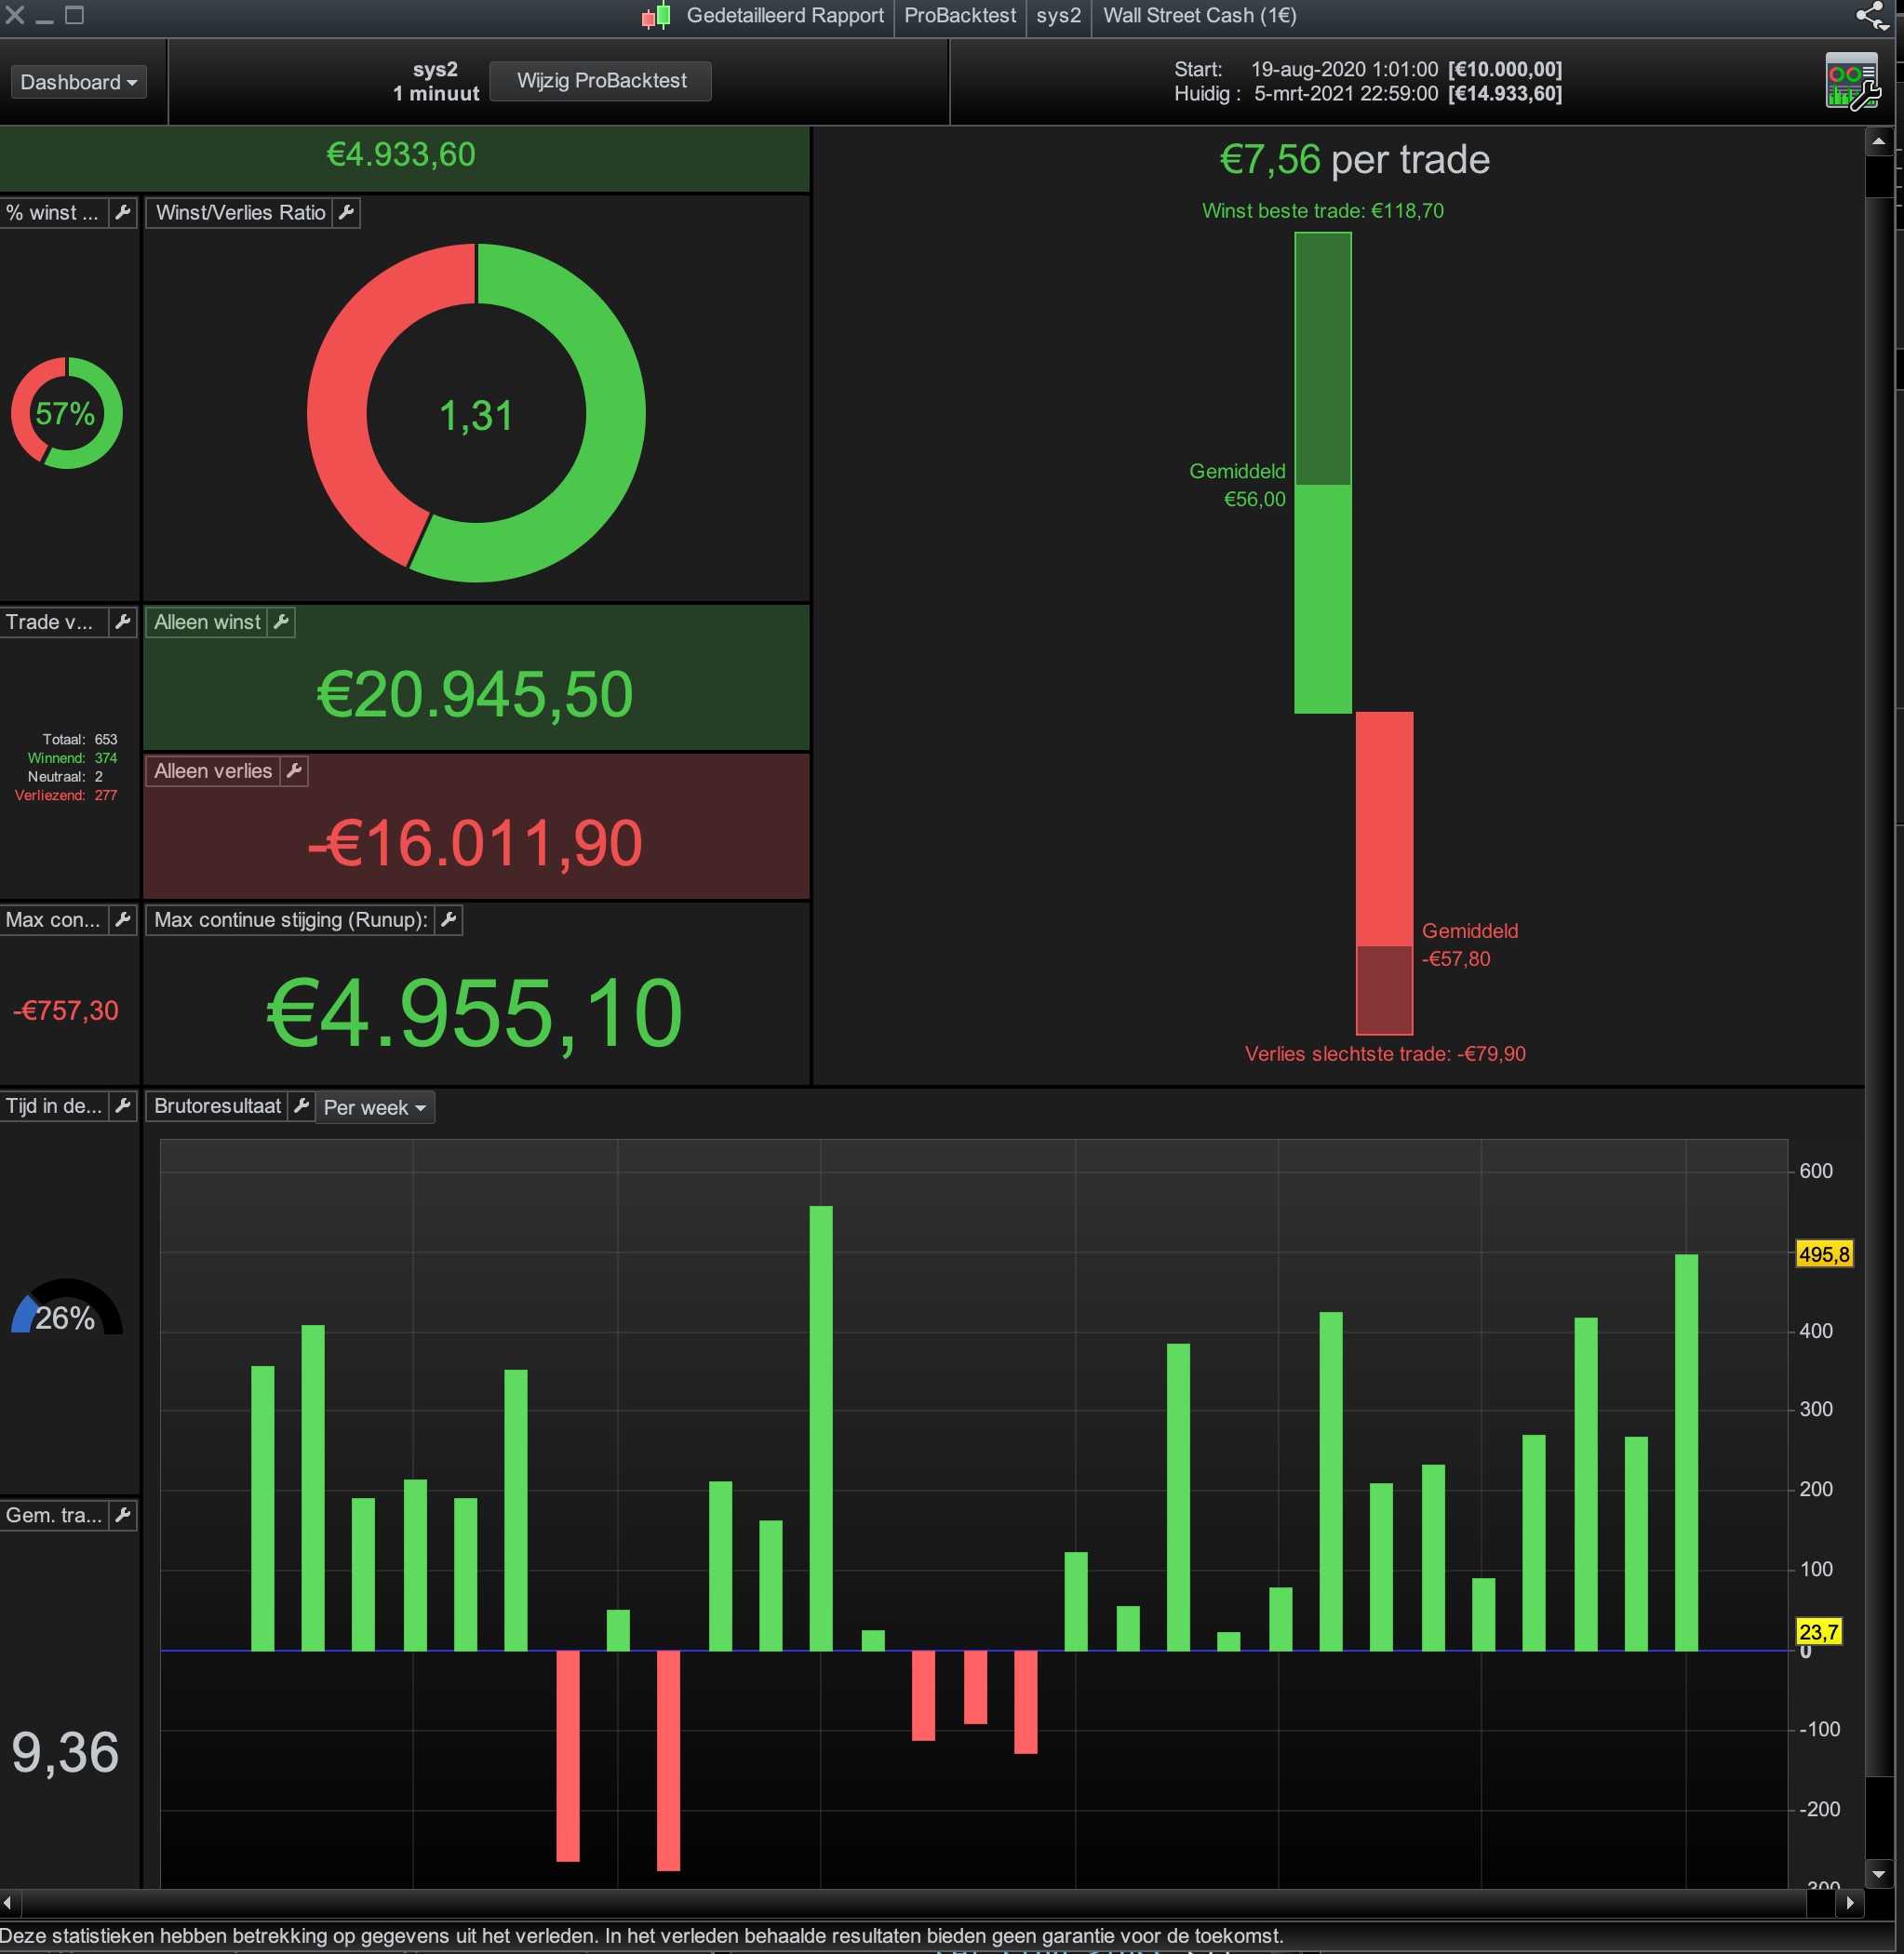
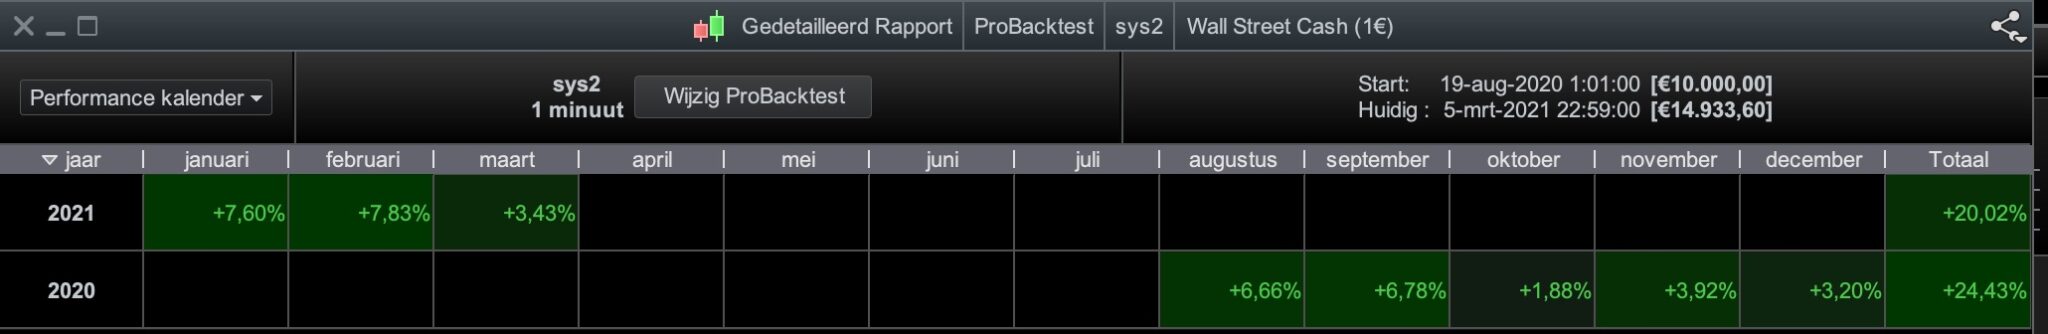
I ran it in ORT layout (optimised in step2), for 100k. Dow 1m. long&short, 0.25%sl
Added a criteria to reduce number of trades. I like to use i.e. close>totalprice
The thing is, disabling short shows a poor performance for long, disabling long shows a good result for short. Together they have the best results.
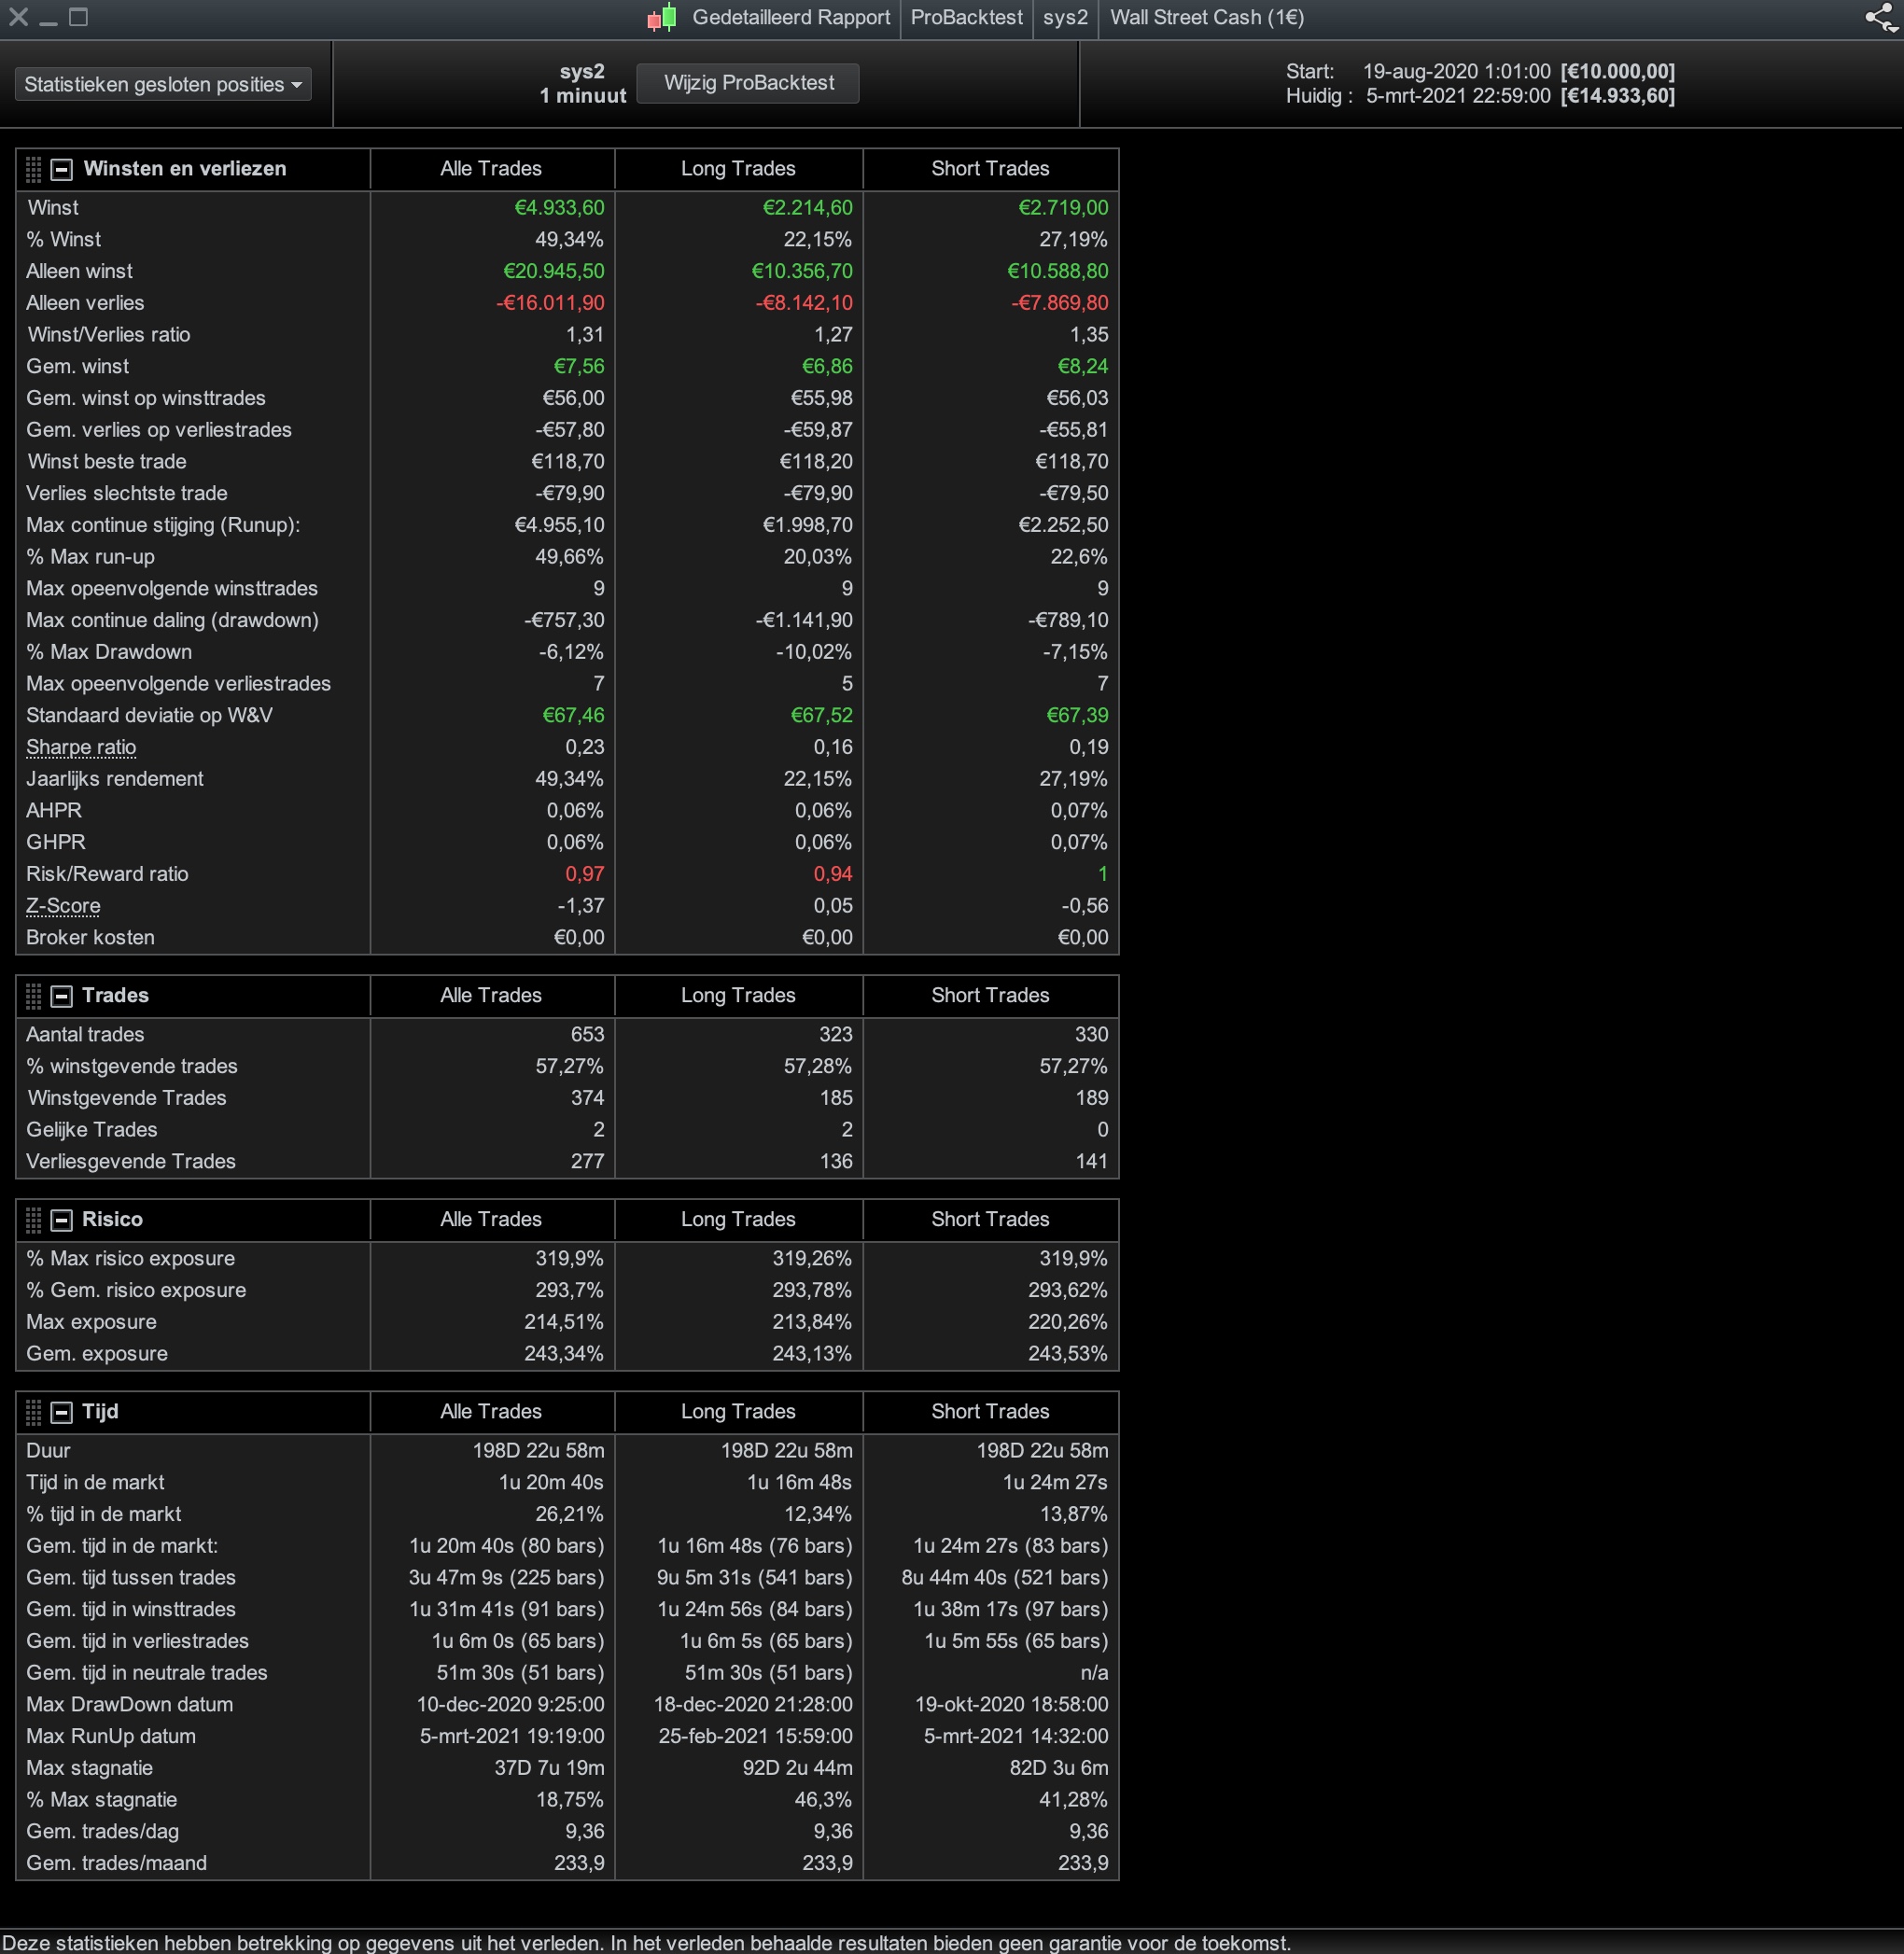
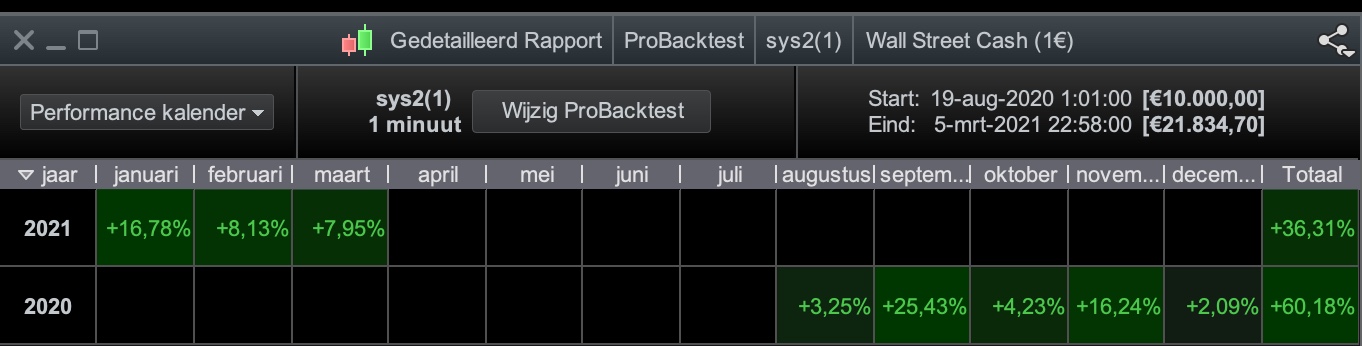
Here are results on 200k on step4. Don’t ditch your setup just yet. Above you have your ingredient for the sauce 🙂
PaulParticipant
Master
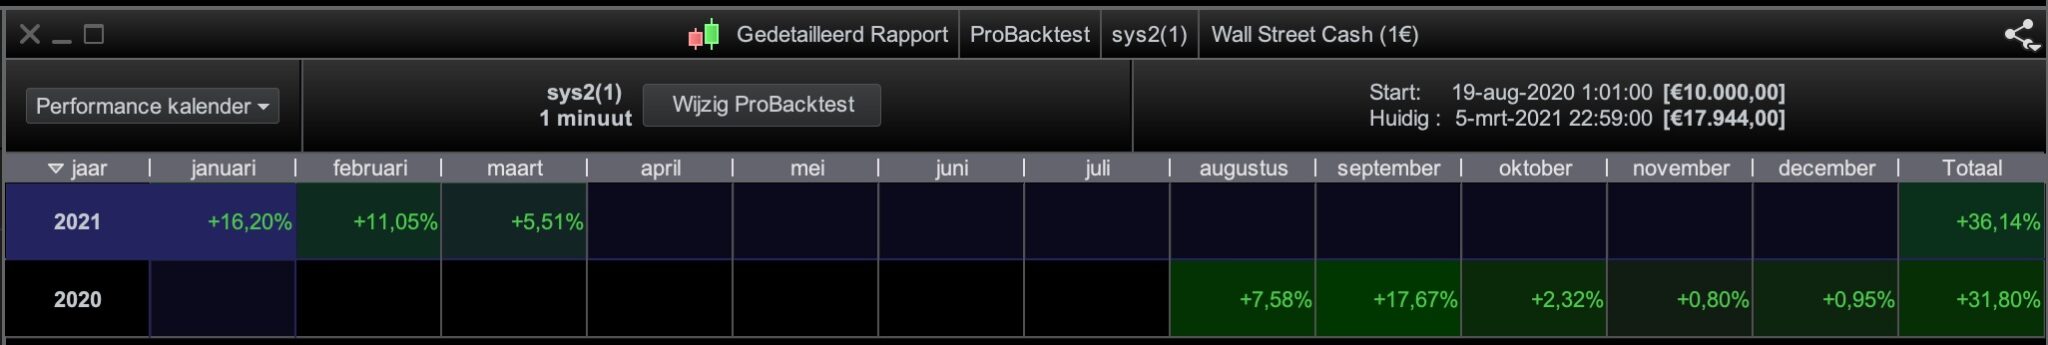
looking at the charts, it’s pretty annoying that using a profittarget limits it’s potential. (I used sl* 1.5 in optimisation)
Optimising the ts unleashed extra performance while removing the pt.
Basically it makes sense. A wave of moving averages are always lagging, so if a wave start to move down, generally the index is already down the average. If the additional criteria happens there is enough room for an upswing with a low risk. You are then profiting from fake signals.
PaulParticipant
Master
there’s still room for improvement.
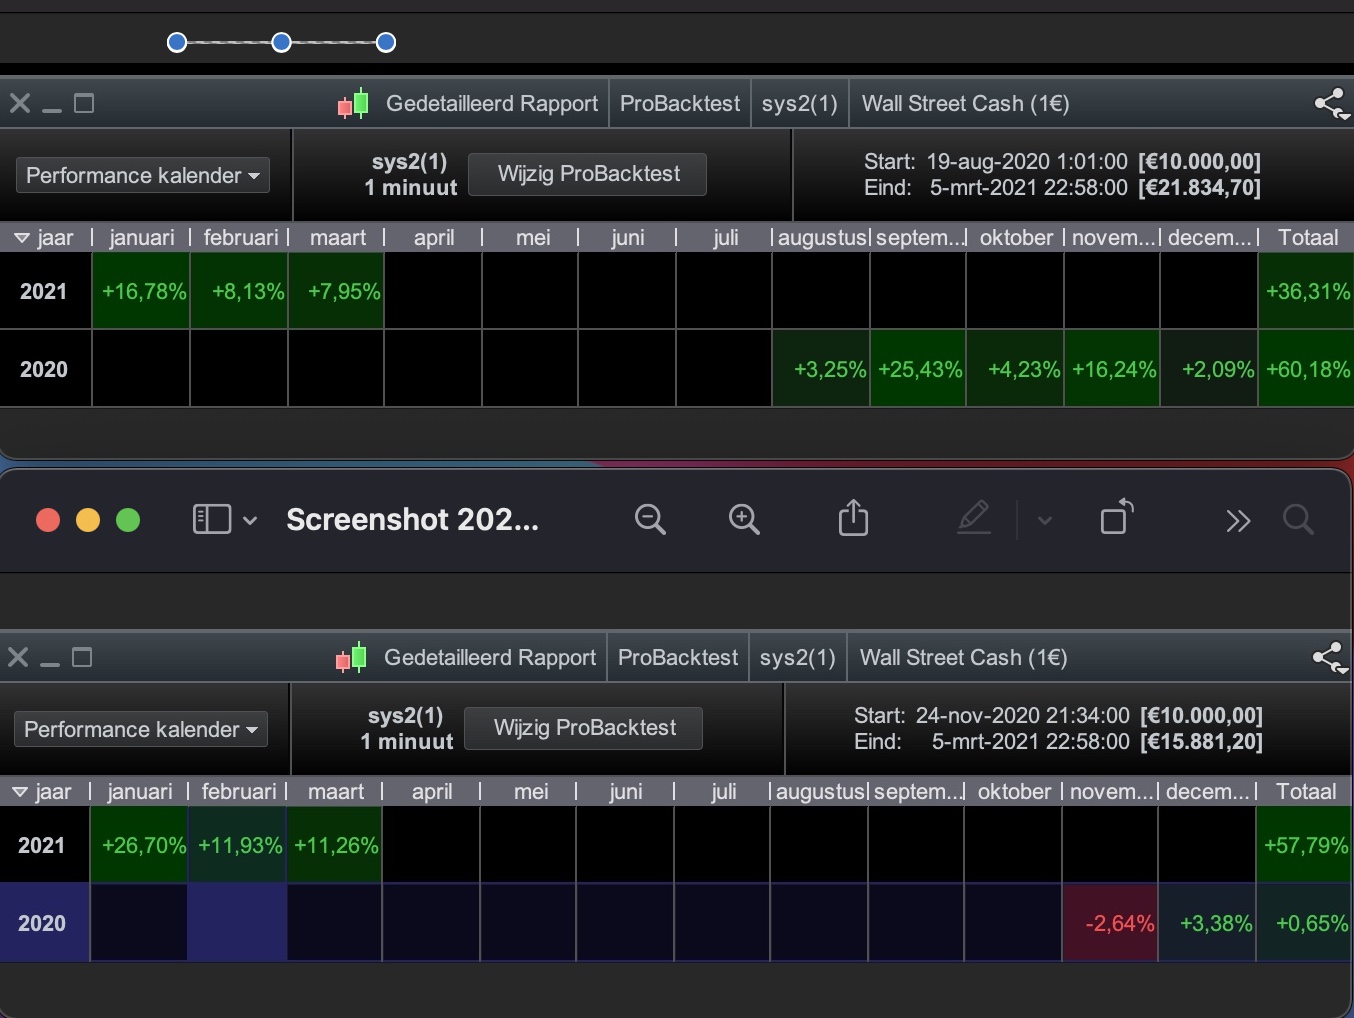
2 bad days stood out, dec 31 and nov 03 us election
Ignoring those 2 days and looking at the start& endtime improved it further. Check the stoplos for both up to 0.5%
So it was optimised (core) on 100k and values applied on 200k I didn’t use the equitypart and it’s all based on 1 positionsize.
There is still doubt, why are results in months (besides november) different on 100k compared to 200k. Probably because a once function and could be a problem.
Anyway I hope this is a reason to look at the ORT layout because on that idea there was not much interest and the strategy posted by the SB-FO .
All, thanks for your feedback and my apologies for not responding sooner. It is ski season here in Utah and that keeping me fit.
Anyway, Paul, thanks for your input. Could you be so kind and post your revises code.
I’ll be posting another strategy which is also promising.
SB-FO
PaulParticipant
Master
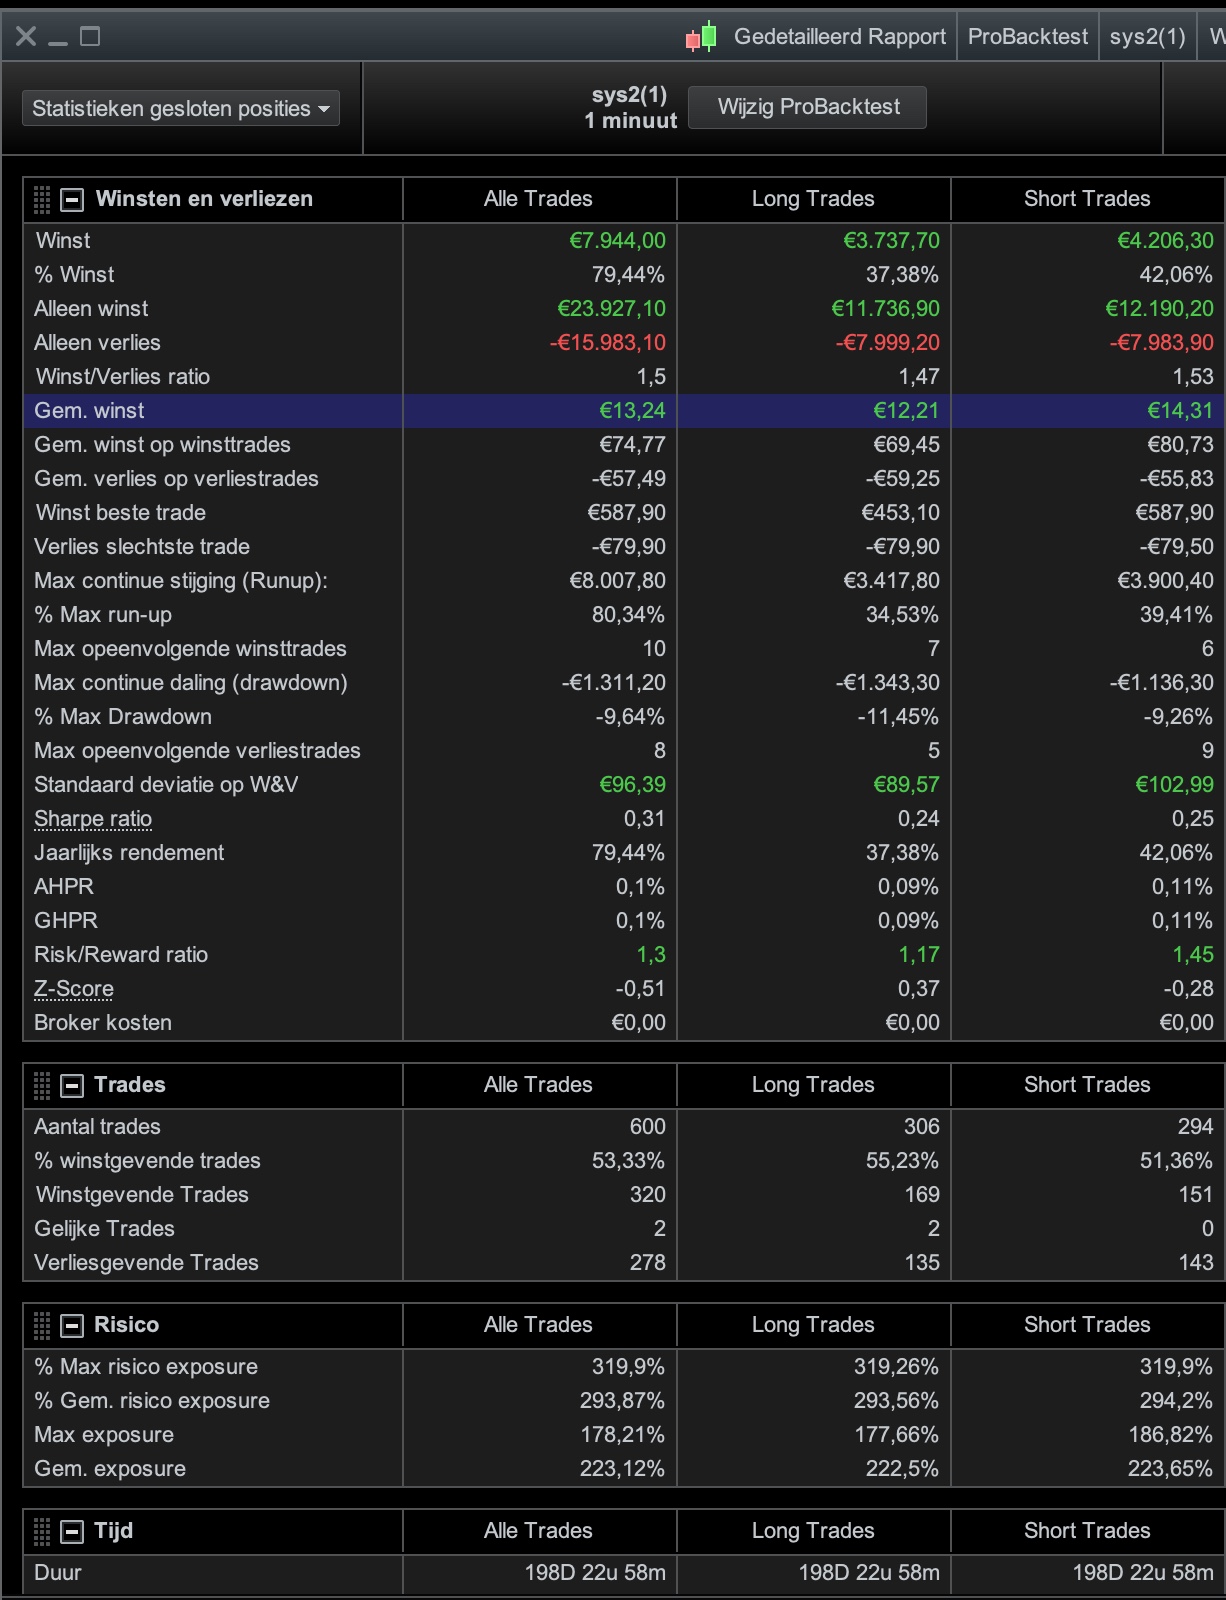
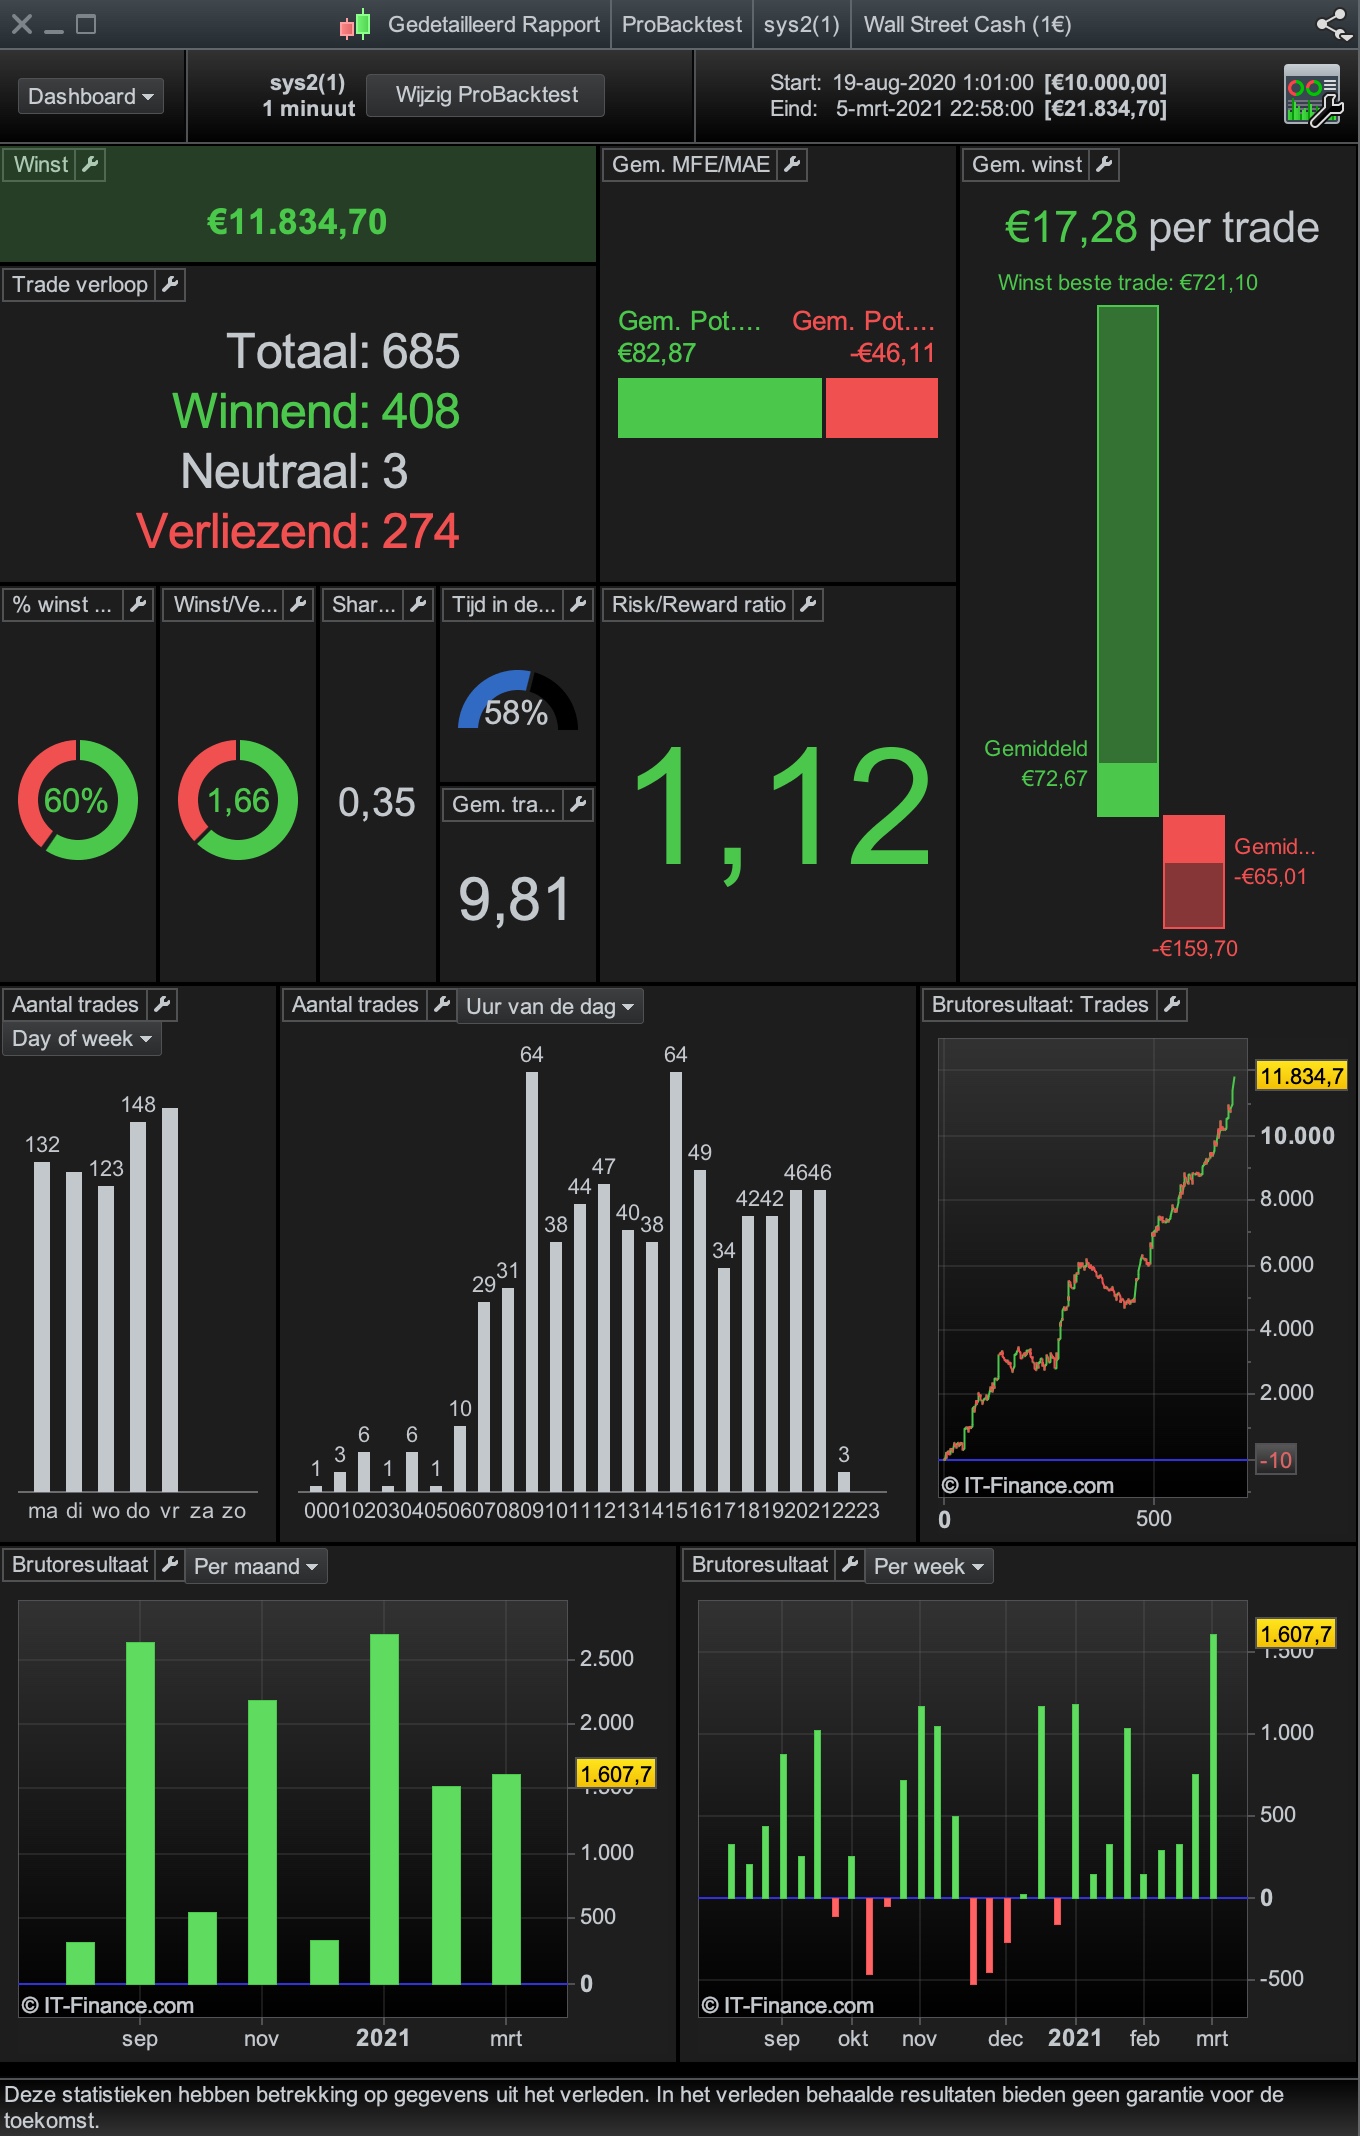
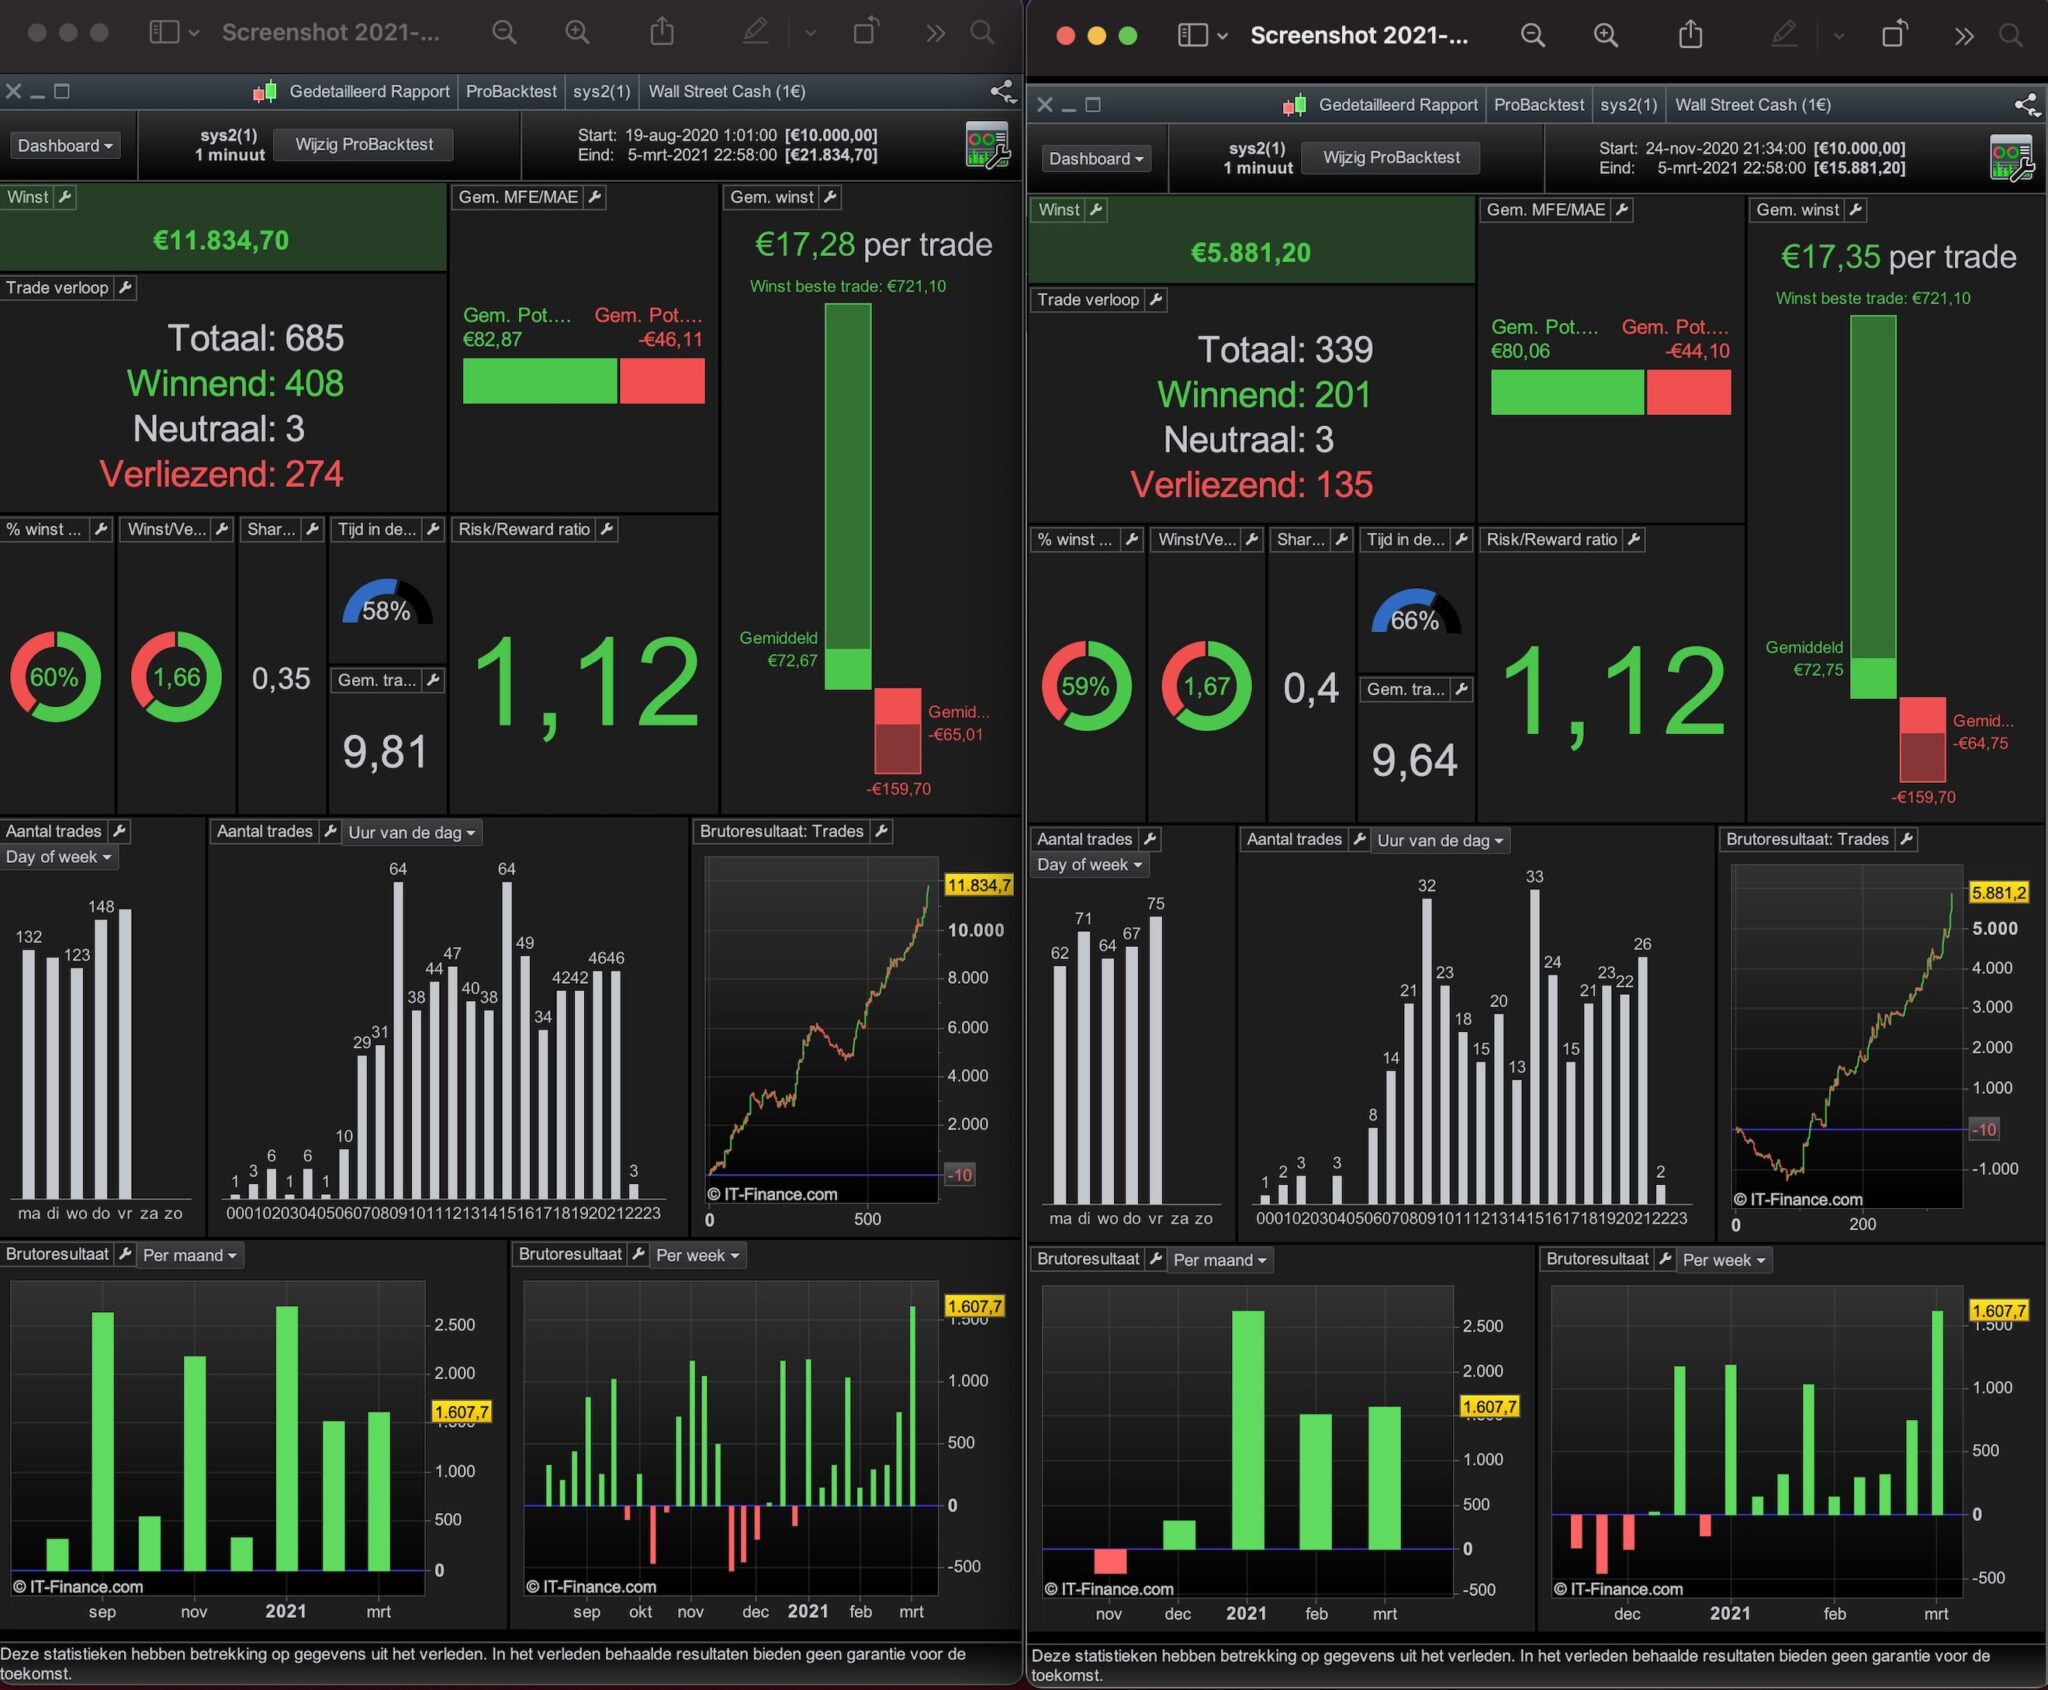
Hi, that’s a nice way to keep fit! Here’s one that is optimised on up to 200k dow 1minute. It really shows if loading it on 1M bars.
defparam cumulateorders = false
defparam preloadbars    = 2000

ONCE a1 = 50
ONCE a2 = 40
ONCE a3 = 6
once a4 = 8

once positionsize=1

// excluding trading days
if year=2020 and month=11 and day=3 then // election us
tradeday = 0
elsif month=12 and day=31 then
tradeday = 0
else
tradeday = 1
endif

// strategy
//t and the deviation of the mean:
//t = 0 = average // Simple
//t = 1 = exponentialaverage
//t = 2 = weightedaverage
//t = 3 = wilderaverage
//t = 4 = triangularaverage
//t = 5 = endpointaverage
//t = 6 = timeseriesaverage
//t = 7 = Hull (PRT v11 only)
//t = 8 = ZeroLag (PRT v11 only)

P = a1 // p
P1 = a2 // p1
T = a3 // endpointaverage
T1 = a4 // triangularaverage

if barindex > p+1  then
mo = average[p,t](open)
mc = average[p,t](close)
ml = average[p,t](low)
mh = average[p,t](high)
//endif

haopen=mo
haclose=(mo+mc+ml+mh)/4
haopen=(haopen[1]+haclose[1])/2
endif

HAopen1 = average[p1,t1](haopen)
HAclose1 = average[p1,t1](haclose)

condbuy =HAopen1 Crosses Over HAclose1 and close>totalprice and close[1]<totalprice[1]
condsell=HAopen1 Crosses Under HAclose1 and close<totalprice and close[1]>totalprice[1]

//
ctime = time >= 060500 and time < 215400
ctime = ctime and tradeday

// entry
if ctime then
if condbuy then
buy positionsize contract at market
set stop %loss 0.5
set target %profit 0.75
elsif condsell then
sellshort positionsize contract at market
set stop %loss 0.5
set target %profit 0.75
endif
endif

//
if dayofweek=5 and opentime>=215400 then
sell at market
exitshort at market
endif

//
if positionperf(0)*100>0.4 then
if haclose1 crosses over haopen1  then
exitshort at market
endif

if haclose1 crosses under haopen1 then
sell at market
endif
endif
Thanks Paul. I will play with it.
Thank you very much for sharing this strategy with us, it looks very promising and the overfit risk is really low as log as this is a simple stragegy without indicators (assumming that Heiken Ashi is not an indiciator).
I wonder if it could be interesting to include a vectorial component to this strategy, for example the angle and slope of the crossing between the upper and the lower Heiken Ashi Clould lines in order to avoid false signals when the angle is not big enough. What do you think? I’ll try to program this vectorial Heikin Cloud by myself but as long as my programming skills are very limited, maybe someone wants to take a step ahead and program it by him/herself and could share it whith us.
Ryugin, that is a great idea. I have thought of using the slop curve / crossing, alas my coding skills are not good enough to know how to do that. Perhaps indeed another member of the community can help out. Nicolas & Vonasi might have some insights.
Cheers, SB-FO