Hi CFTA.
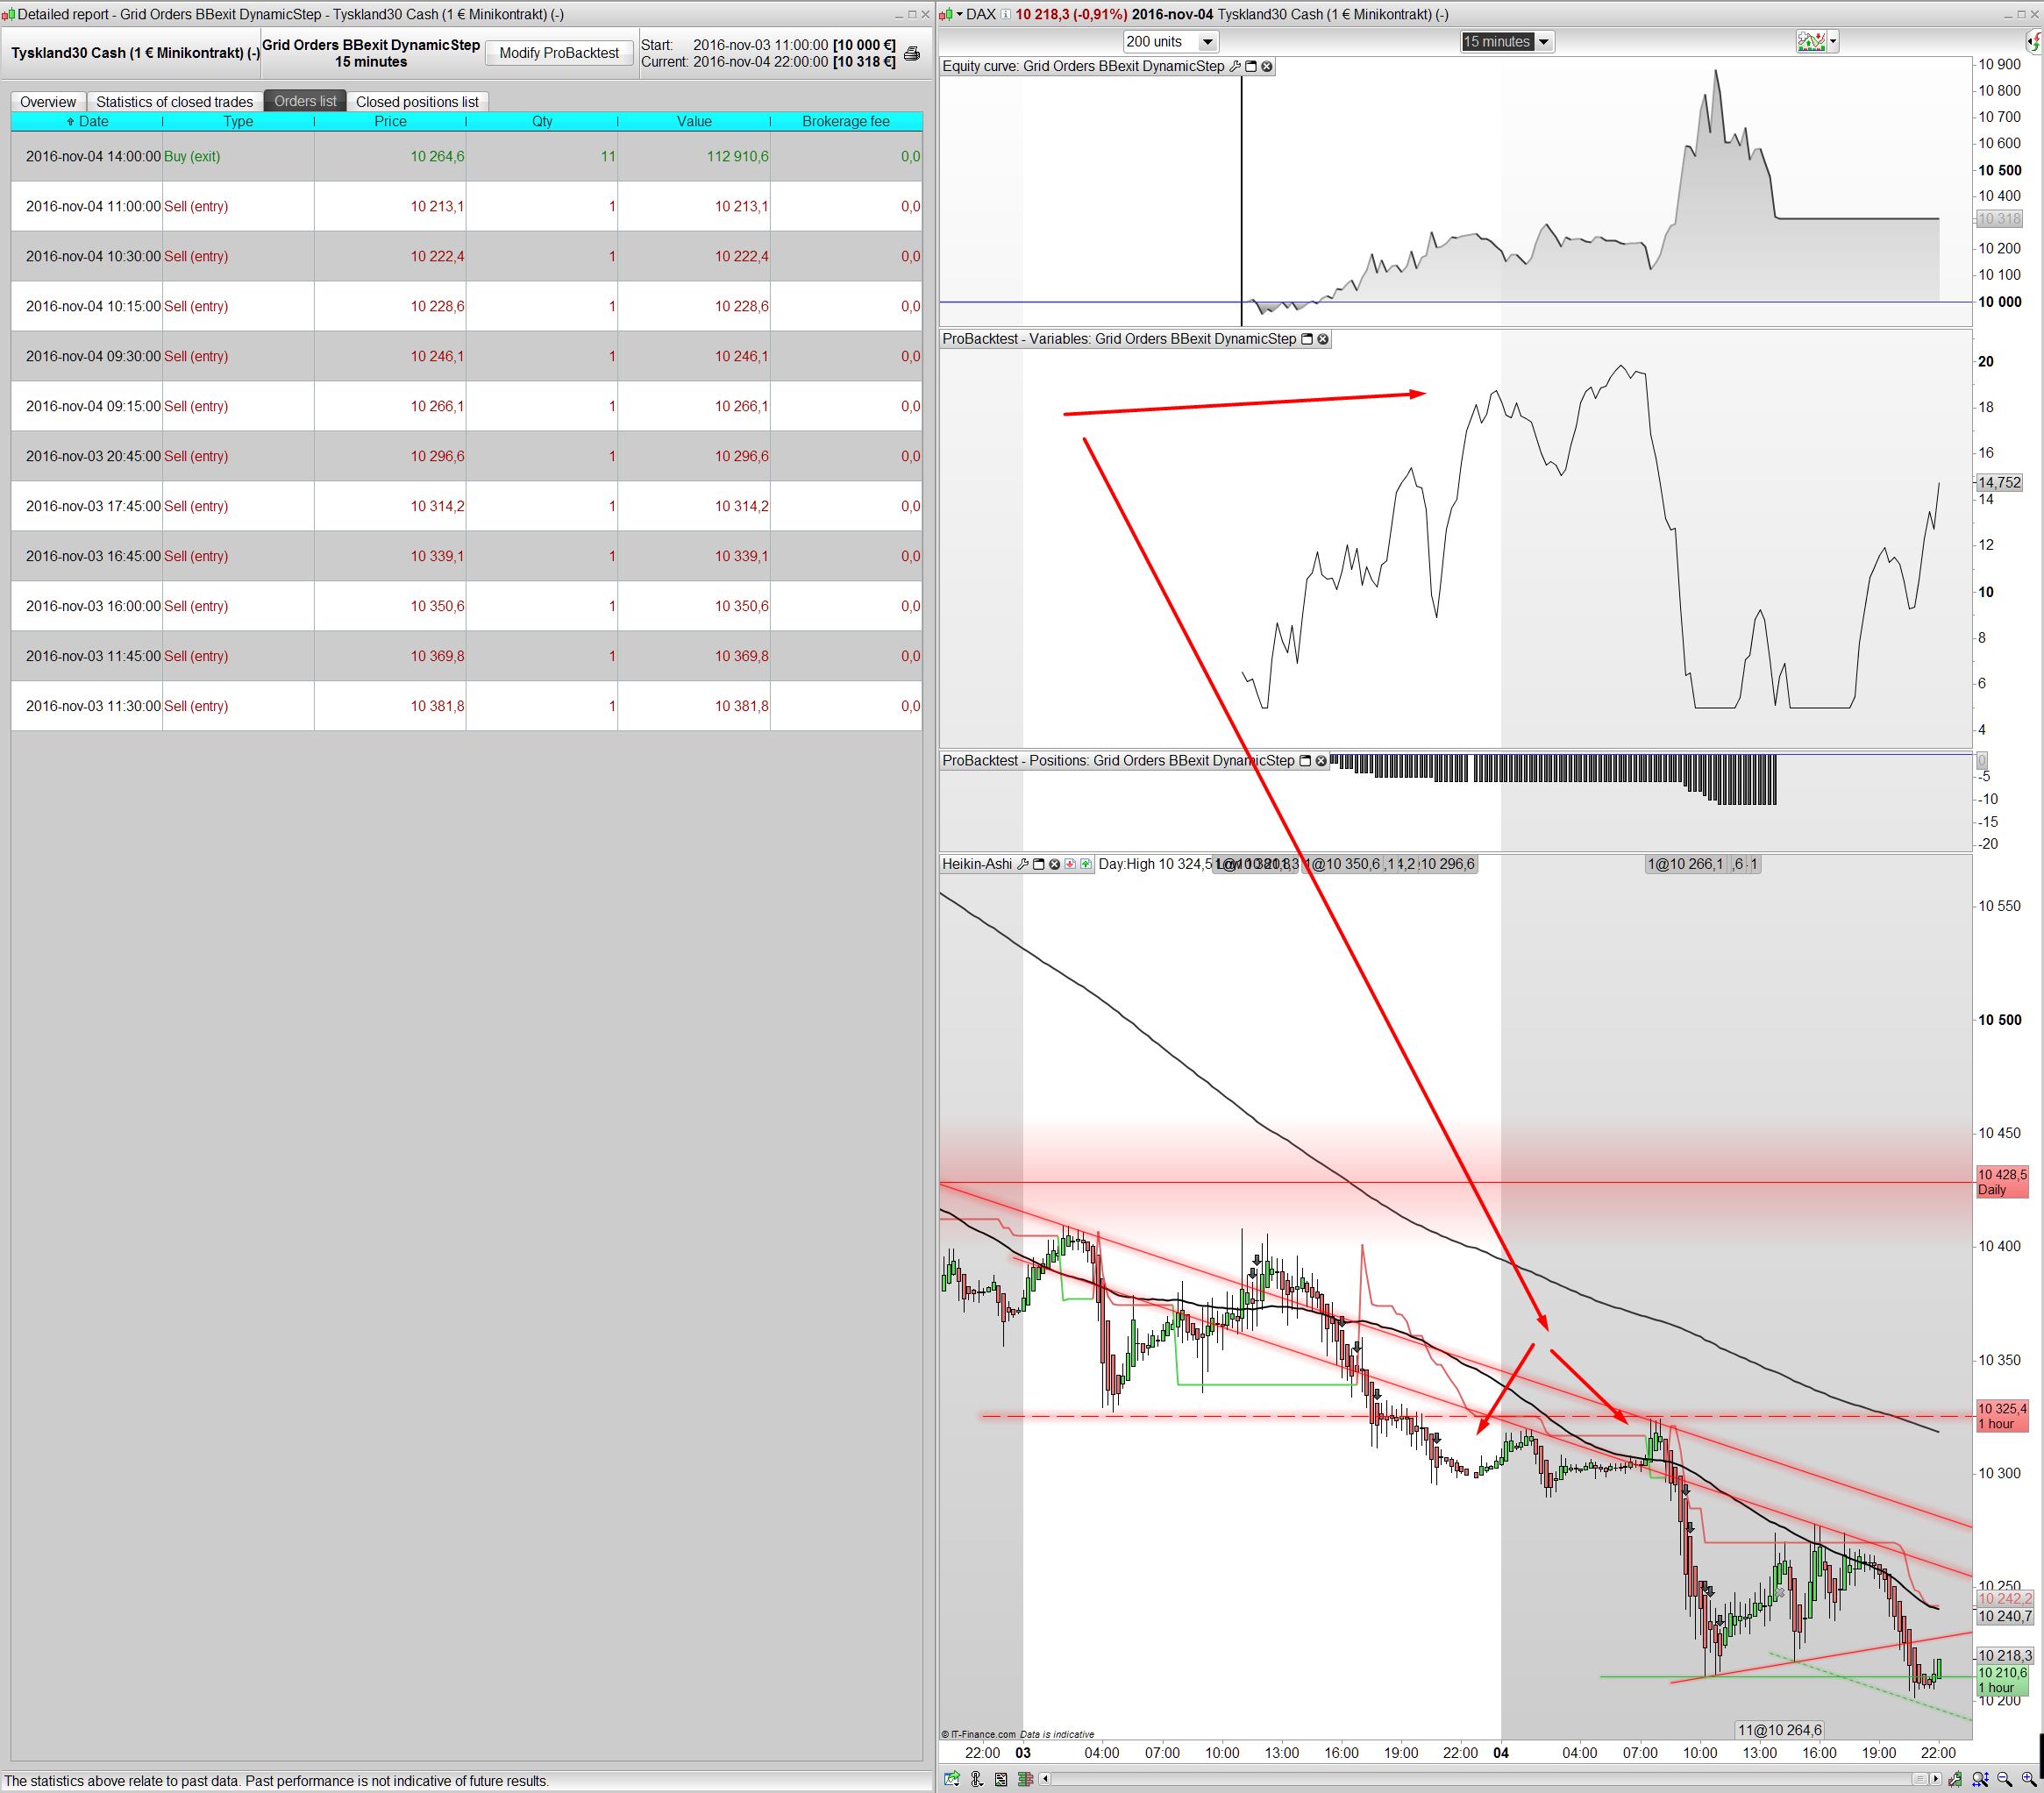
I remember reading about the dynamic grid step so went back to the post and downloaded the itf file… for the 5th time 😀 turns out I never did test it though- but I did now. I agree I was never to get it over the min gridstep at 5. But it was on 2 sec TF. when changing it to larger FT such as 15 min it works. I think to readjust the TF to lower we encounter a global problem here. We need the multiframe support. It’s also the problem with my automated strategy on 2 or 10 sec TF. Not only is it impossible to multiply all indicators to match larger TF. The limitation on Preloadbars is met when trying to add an MA50 on daily TF to suit 2 sec TF. I want to test for the major trend and only make trade with that trend. So without multiframe support I don’t think we can make automated strategy on so low a TF. But I encountered another problem- It stops all the time due to some technically problem. third problem is having enough backtesting data to make a decent strategy, I made a few backtesting 10-14 days. optimized them to as much as 45% gain on 10 days, only to loose 10% on the 3 days I was able to keep them going. So I did a conservative one. Gridstep 7 and rr=1.5 was profitable on Friday but still to soon to tell if profitable overall- and the fact that it again was stopped due to “not able to get status on last order”. I would like to share the code, but maybe we are getting to many tracks on this posts. what you think?
Hello,
Congratulations for working on your code.
I used CFTA-indicator-v1.5 and Coppock-EMA34 in my personal code with defparam PreLoadBars = 2,000.
You have made a flag in a flag.
This is not working in Proordertrading.
This generates a technical problem and a report.
How to operate the two indicators in a program?
What is the problem ?
Thank you if you have an idea.
Hi Arcane. It’s hard to tell what exactly what your problem is? what is a flag in a flag? I also encountered the technical problem where you need to send information to PRT describing what you did and so on. What time frame did you use? are you able to reproduce the problem? Please share the code and describe your problem in details, perhaps in a fresh post in the community.
The indicators were intended to understand the strategy and eventually code a screener for the propose, as most of the coding in this original post-string are run on the indicator setup and will produce only one trading-pass. But there should not be any thing prohibiting you from implement it in an automated strategy, I did it my self with the indicators, however I did not try out the Coppock-EMA34 as this was only derived from an idea of CFTA. I think it would take some testing and some experience to develop it further.
note. Remember to have the “MGC-Coppock” custom indicator imported as it’s variables are called in the CFTA-indicator-v1.5
Cheers Kasper
Thank you for the answer.
I changed the code by removing Coppock-ema34 call.
The result of the indicator is almost identical.
I called the new CFTA-indicator-v2 indicator.
The code is operating normally now in my program.
I think I found the problem with the first indicator.
I placed the order defparam PreLoadBars = 2000
I do not know how you can put as maximum.
In a backtest, going back too far in time, it hangs the system.
However, it should work in the automatic program.
Howdy everyone,
I’m wondering if it’s possible to set the SL to go break-even after the system has built a certain number of orders? Therefore, if min order amount = 2lots, and the system has built up to 10 lots (therefore, 5 trades of 2 lots), the system will move the SL from the designated RR to break-even.
So something similar to what Nicolas wrote in his blog about setting up a break-even code.
If this is possible, then I may have a decent strategy I can share with everyone.
Currently I use the system on 1s TF, while looking for signals on 3min and 10min TF using Nicolas’s multi-TF RSI indicator.
3min chart has 3min and 15min multi-TF RSI, and 10min chart has 10min and 30min multi-TF RSI.
My Entries and exits are based on when RSI goes above/below 79 or 21 RSI on 10min chart, where the 3min chart gives me early indication of a change of trend (so early notice on when to get out).
Hello,
The CFTA-indicator-v1.5 code does not work in Proordertrading on my program.
The system does not start.
I have an error message.
He asks to increase the bars in Preloadbars but I am already at 20,000.
In the manual it says that the maximun is 5000.
Someone understands the preloadbars order.
How should we put bars?
Thank you for your help.
Hi Arcane. There is nothing in the The CFTA-indicator-v1.5 that need anything more that preloadbars=25 so it must be something else in your code.
Preload bars is doing exactly what it says. Preloading bars and is used by indicators that need previous bars to be calculated. For example
myMA= average[200]
you need 200 preloaded bars.
Perhaps there is something like I mentioned an MA50 on a 15 min timeframe in a 2 sec TF strategy. It would be
DEFPARAM PRELOADBARS = 45000//needed bars to calculate next indicator
my15minMA50= average[45000]//15 min MA50 on 1 sec TF
I don’t know tha max of preloadbars. Anyway again really hard to say what it is without the actual code.
@Siaoman I think it should be possible to make the code break even with a certain amount of position. However I think I perhaps would be smarter to use the dynamic gridstep also introduced by Nicolas– say for example in low volatility periods to move to break even or perhaps even to gains. Maybe a mix of the two. I just like to formula to code before giving the coding a try.
cheers Kasper
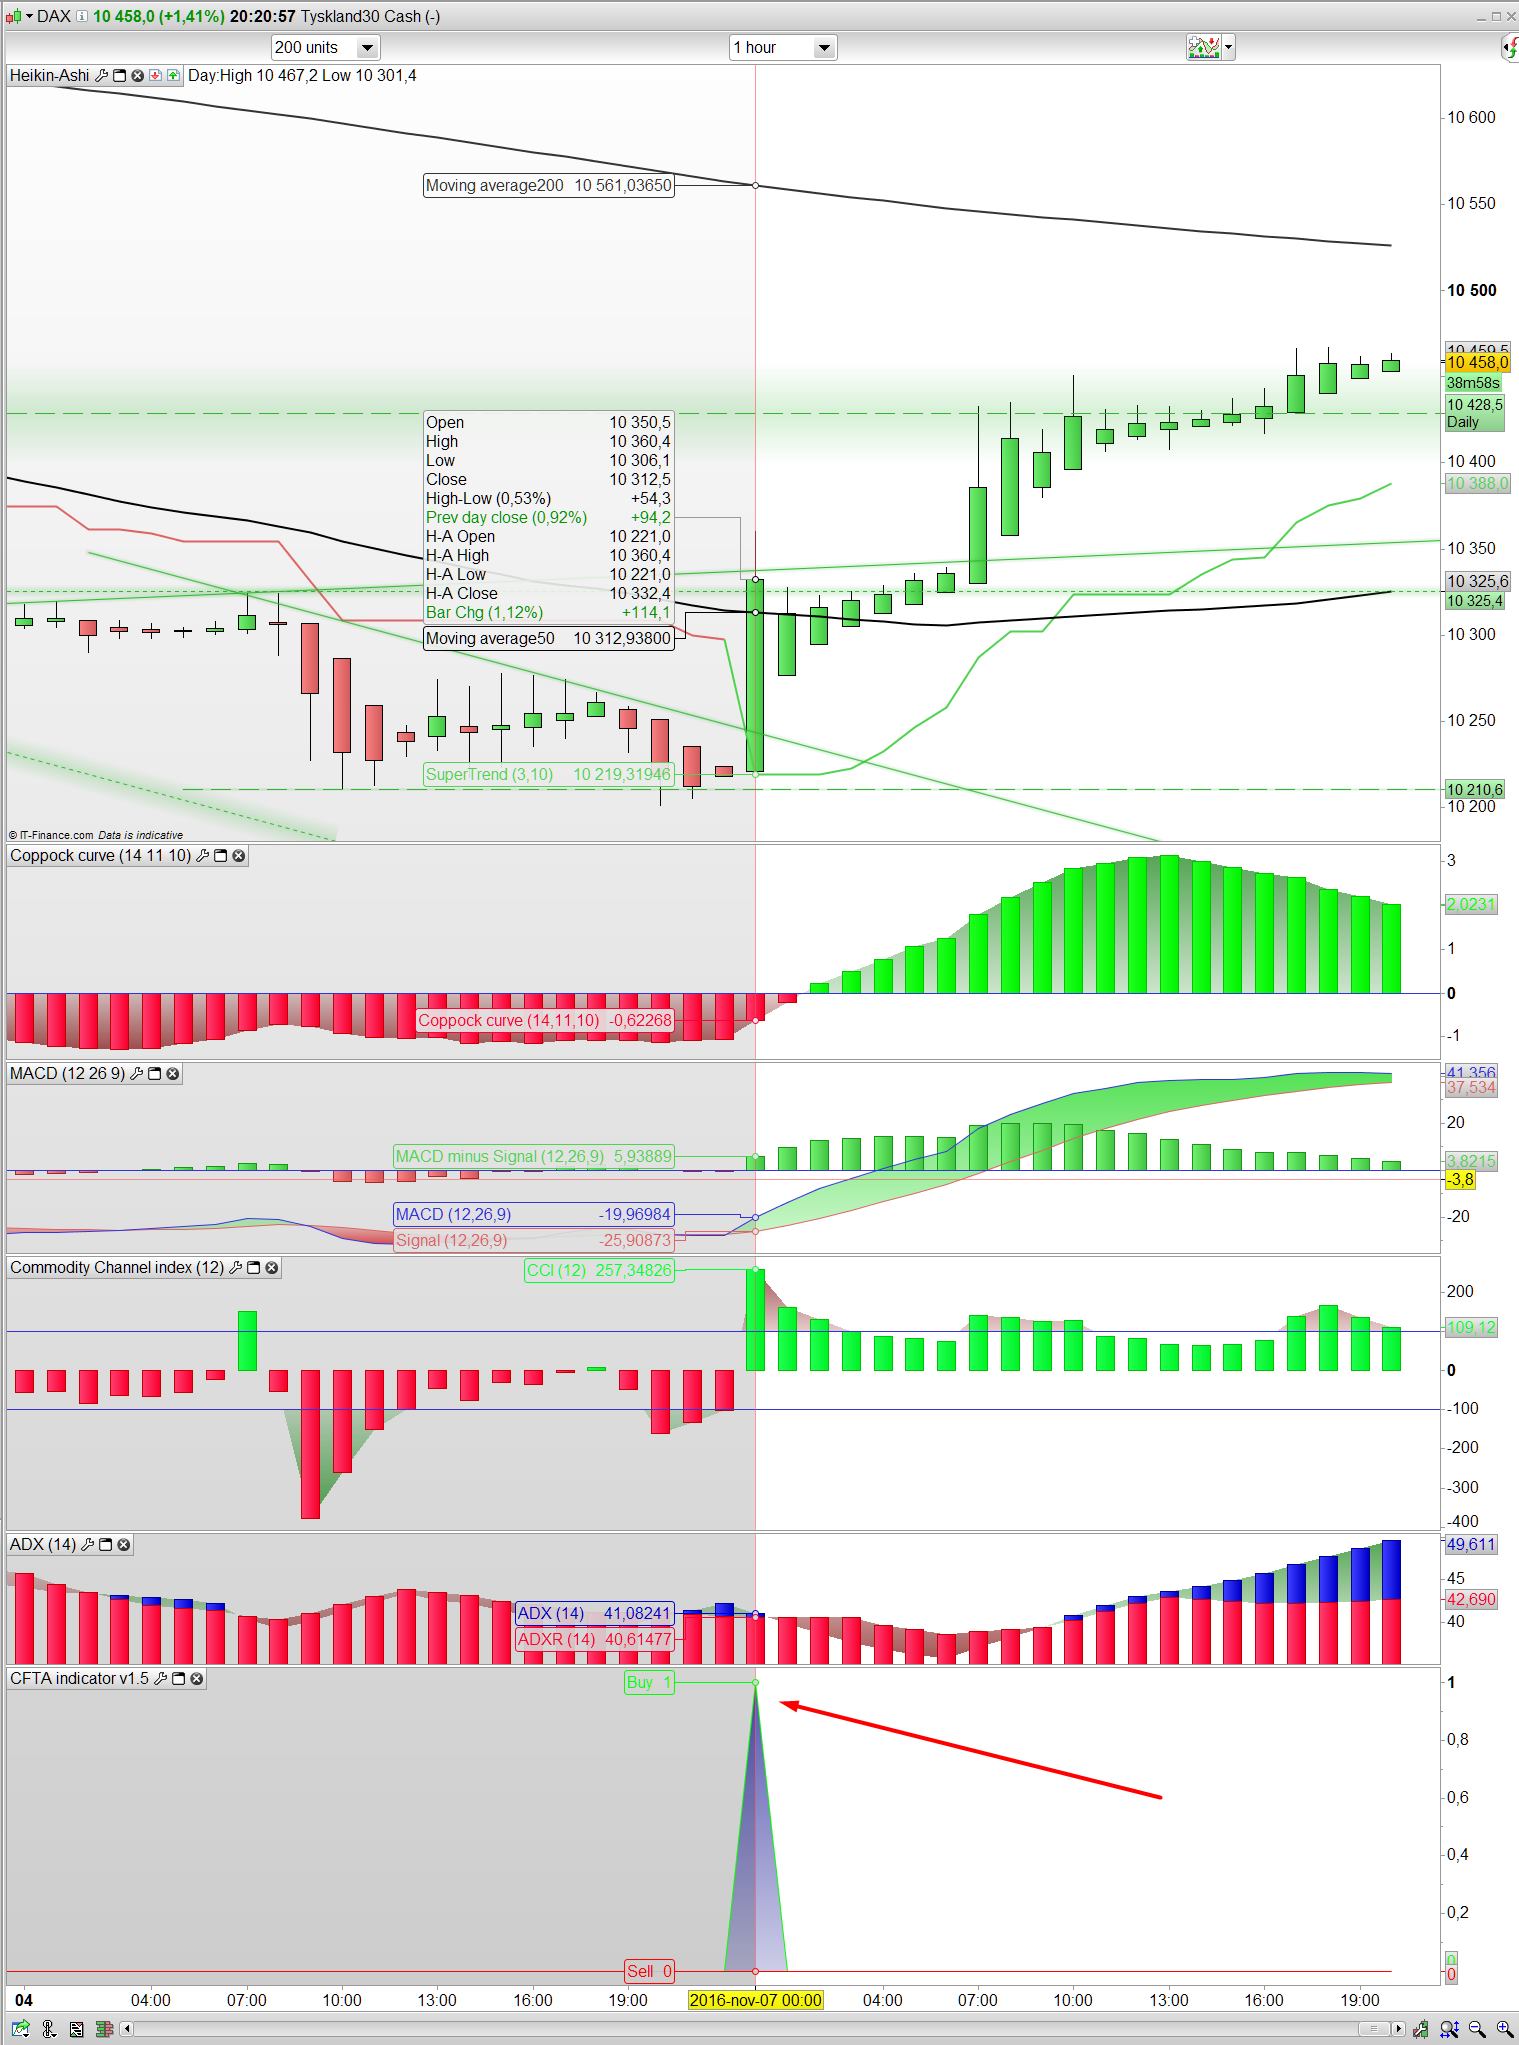
A screener as we talked about. Based on 1H CFTA-indicator-v1.5. test results and feedback is much appreciated 🙂
Btw based in the indicator and DAX on 1H TF- it would have made around 200 points today
//==================CFTA screener based on CFTA-indicator-v1.5
//***************Long
TIMEFRAME(1hour)

Histogram1 = MACD[12,26,9](close)//Histogram
Blue1 = MACDline[12,26,9](close)//Blue line
red1 = ExponentialAverage[9](MACDline[12,26,9](close))//RED Line
ADX1 = ADX[14]
c1 = (blue1 CROSSES OVER red1)
c11 = Blue1<0
c2 = (Histogram1 CROSSES OVER 0)
c4 = (ADX1 > 25)
Mycci1= CCI[12]
c44 =Mycci1[1]<0 and Mycci1[0]>0
indicator2 = CALL "MGC-Coppock"[14, 11, 10](close)
c12 = (indicator2 > indicator2[1])


//*************Short
TIMEFRAME(1hour)
Histogram2 = MACD[12,26,9](close)//Histogram
Blue2 = MACDline[12,26,9](close)//Blue line
red2 = ExponentialAverage[9](MACDline[12,26,9](close))//RED Line
ADX2 = ADX[14]
c22 = (blue2 CROSSES Under red2)
c21 = Blue2>0
c222 = (Histogram2 CROSSES under 0)
c242 = (ADX2 > 25)
Mycci2= CCI[12]
c54 =Mycci2[1]>0 and Mycci2[0]<0
indicator2 = CALL "MGC-Coppock"[14, 11, 10](close)
c122 = (indicator2 < indicator2[1])


SCREENER [(c1 and c2 and c12 and c4 and c11 and c44) or (c22 and c21 and c122 and c242 and c222 and c54)] (Variation AS "%Chg prev bar")
 cfta
cftaParticipant
Senior
Exciting to see all this activity in the thread 🙂
I have been testing the indicator further and it looks good but also shows room for improvement, it is well coded but on some charts it is evident that we miss good entries meaning we need to adjust the parameters. Take a look at the below chart on oil which showed a nice downtrend the last couple of weeks, we got long signals at minor retracements but not the short signals either because the CCI crossed before the MACD had crossed below its average again or because the ADX was too low. From now on I will look to increase the high TF screening CCI periods to 15-20 and set the ADX to 10 periods and be above 20.
It would be great if we could implement the Heiken Ashi too, I found a screener in the library which Nicolas coded for detecting when HA candle swith from red to green and thought it might be useful, with some minor adjustment we can use it for the indicator;
xClose = (Open+High+Low+Close)/4

if(barindex>2) then
  xOpen = (xOpen[1] + xClose[1])/2
endif

c1 = xClose>xOpen AND xClose[1]<xOpen[1]
c2 = xClose<xOpen AND xClose[1]>xOpen[1]

SCREENER [c1 OR c2]
@ Siaoman, good idea in some market conditions that is a better way to ensure break even, for sure it can be coded I can’t figure it all out myself but most likely the first line need to be;
“if onmarket and countofposition>=10 then” the second line I don’t know.
@ Kasper, indeed it is tricky with the low TFs further testing showed that the code for dynamic grid step is correct but the ATR values need to be very high when running it on M1 as I do, recently 150 and 3000 has been working all right even if the steps are somewhat narrow.
Hi CFTA, and good to hear from you.
About the dynamic gridstep, I would multiply the low TF’s ATRcurrentPeriod/ATRhistoPeriod to match the 15min TF
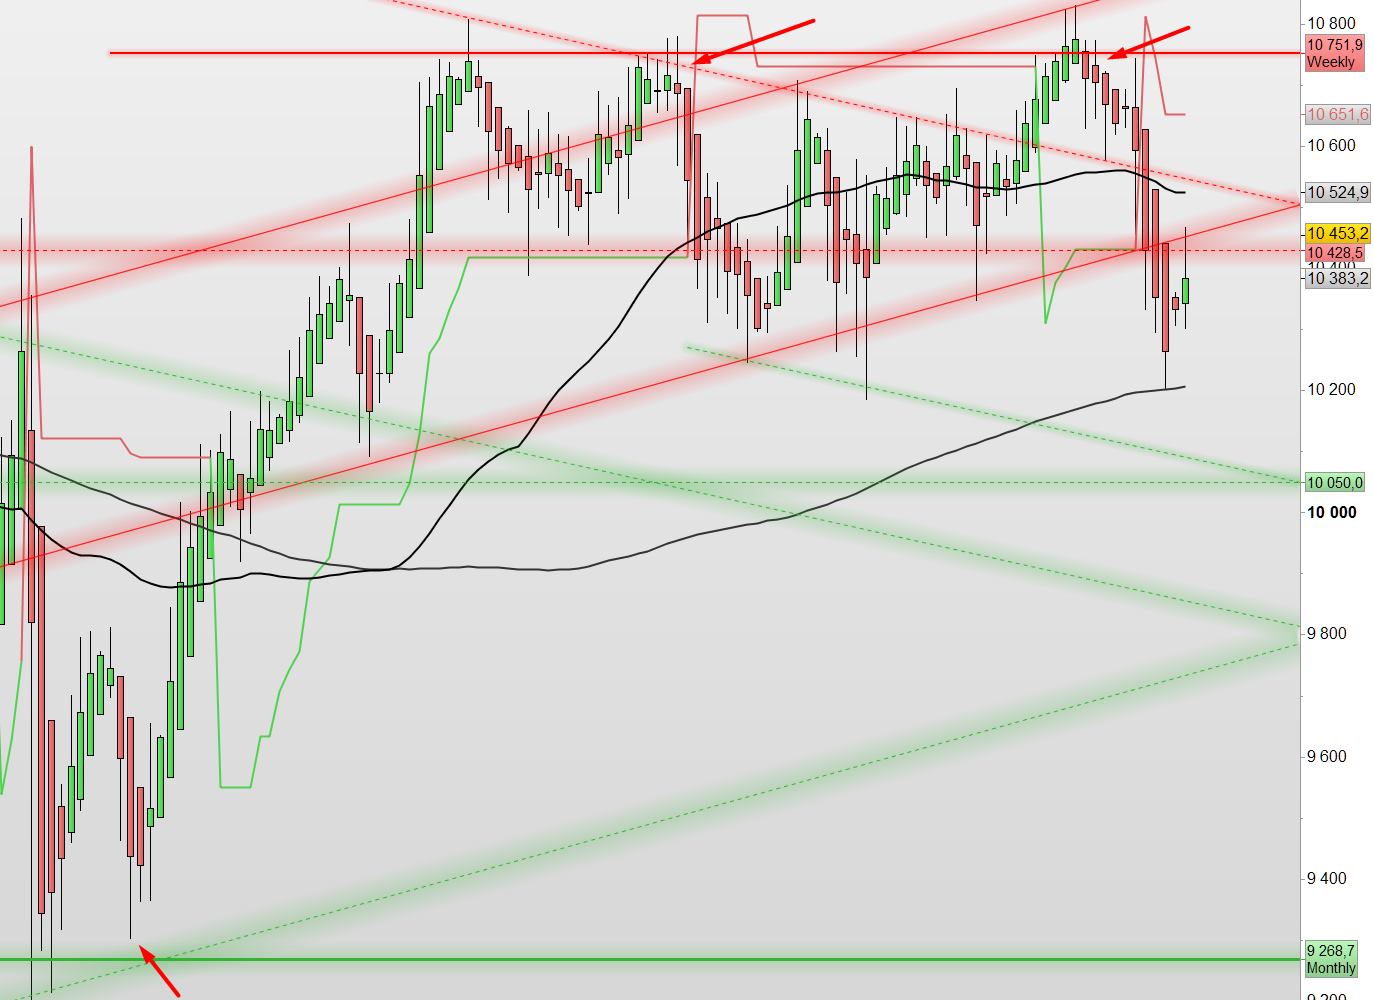
I also did see the “false” signals in the retrenchment periods, but I think It’s not limited to that. there are just overall false signals- But I just don’t know how to solve this. Perhaps from a daily/weekly high/low retrenchment and retest? Again I don’t know if this is possible to code. see screenshoot: TF=Daily
About the Heikin-Ashi, no problem Already done, also the new periods, but I don’t think it has solved our problem.
Anyway here it is:
//==================CFTA-indicator-v2.5
//Heikin-Ash
xClose = (Open+High+Low+Close)/4
if(barindex>2) then
xOpen = (xOpen[1] + xClose[1])/2
endif
greencandle = xClose>xOpen AND xClose[1]<xOpen[1]
redcandle = xClose<xOpen AND xClose[1]>xOpen[1]


//***************Long
//MaLong=Average[4800](close)
//c234=close>=malong
Histogram1 = MACD[12,26,9](close)//Histogram
Blue1 = MACDline[12,26,9](close)//Blue line
red1 = ExponentialAverage[9](MACDline[12,26,9](close))//RED Line
ADX1 = ADX[10]
c1 = (blue1 CROSSES OVER red1)
c11 = Blue1<0
c2 = (Histogram1 CROSSES OVER 0)
c4 = (ADX1 > 20)
Mycci1= CCI[18]
c44 =Mycci1[1]<0 and Mycci1[0]>0
indicator2 = CALL "MGC-Coppock"[14, 11, 10](close)
c12 = (indicator2 > indicator2[1])
If c1 and c2 and c12 and c4 and c11 and c44 and greencandle then
Indicator1=1
Else
Indicator1=0
Endif
//*************Short
//Mashort=Average[4800](close)
//c123=close<=mashort
Histogram2 = MACD[12,26,9](close)//Histogram
Blue2 = MACDline[12,26,9](close)//Blue line
red2 = ExponentialAverage[9](MACDline[12,26,9](close))//RED Line
ADX2 = ADX[10]
c22 = (blue2 CROSSES Under red2)
c21 = Blue2>0
c222 = (Histogram2 CROSSES under 0)
c242 = (ADX2 > 20)
Mycci2= CCI[18]
c54 =Mycci2[1]>0 and Mycci2[0]<0
indicator2 = CALL "MGC-Coppock"[14, 11, 10](close)
c122 = (indicator2 < indicator2[1])
If c22 and c21 and c122 and c242 and c222 and c54 and redcandle then
Indicator22=-1
Else
Indicator22=0
Endif
Return indicator1 COLOURED(0,255,0) as "Buy", indicator22 COLOURED(255,0,0) as "Sell"
How did you get on yesterday cfta?
cftaParticipant
Senior
Hi Cosmic,
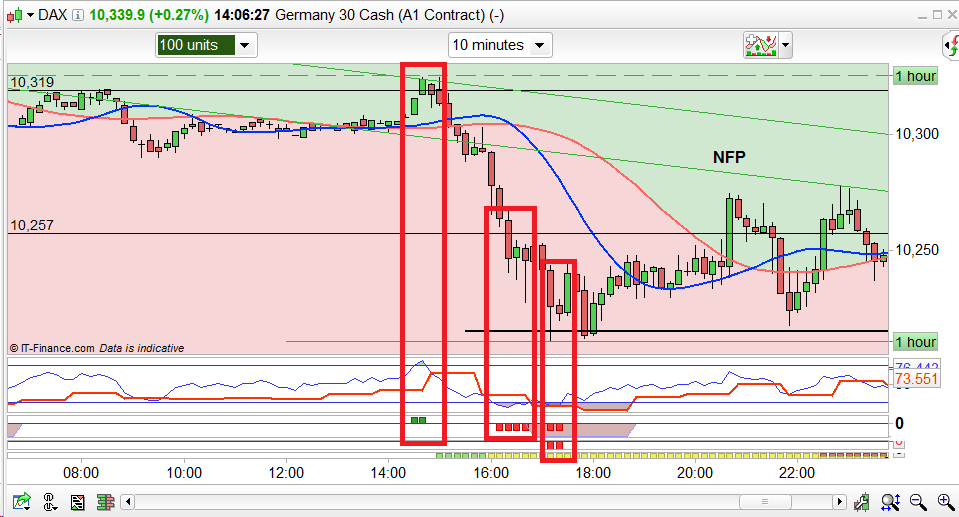
I entered shortly after posting the setup even though there was not any proper signal with ADX being very low, it was a manual trade with 100 p SL so I was taken out by the dip after the US open before price took off upwards. Once again repeating my most frequent mistake of entering trades prematurely. Regretfully I didn’t dare to enter again after being stopped out but after the dip was a great setup for a system trade which easily could have made 10 %+ profits but it wasn’t easy to see it coming.
Yeah shame that didn’t work out. I have a modified version of the code with all the filters taken out. Is that what you are doing when you just want to go long or short straight away, manually?
LONG:
/// Definition of code parameters
defparam preloadbars =10000
DEFPARAM CumulateOrders = true // Cumulating positions deactivated
Once LastTradeDate = 0
//COI= WEIGHTEDAVERAGE[210](ROC[165] +ROC[150])
//MAC= MACDline[180,390,135]
//CCC= CCI [60]
//AAA= ADX [14]
once RRreached = 0
accountbalance = 10000 //account balance in money at strategy start
riskpercent = 1.5 //whole account risk in percent%
amount = 1 //lot amount to open each trade
rr = 2 //risk reward ratio (set to 0 disable this function)
sd = 0.25 //standard deviation of MA floating profit


//dynamic step grid
minSTEP = 5 //minimal step of the grid 10
maxSTEP = 20 //maximal step of the grid 50
//ATRcurrentPeriod = 5 //recent volatility 'instant' period 60
//ATRhistoPeriod = 100 //historical volatility period 600

//ATR = averagetruerange[ATRcurrentPeriod]
//histoATR= highest[ATRhistoPeriod](ATR)

resultMAX = MAX(minSTEP*pipsize,0)
resultMIN = MIN(resultMAX,maxSTEP*pipsize)

gridstep = (resultMIN)

// Conditions to enter long positions
//c1 = (COI > COI[1])
//c2 = (COI > 0)
//c3 = (MAC > MAC[1])
//c4 = (MAC > 0)
//c5 = (CCC CROSSES OVER 0)
//c6 = (AAA > AAA[1])
//c7 = (AAA > 23)

//first trade whatever condition
if NOT ONMARKET And LastTradeDate<>OpenDate then  //close>close[1]
BUY amount LOT AT MARKET
endif

// case BUY - add orders on the same trend
if longonmarket and close-tradeprice(1)>=gridstep*pipsize then
BUY amount LOT AT MARKET
LastTradeDate = OpenDate
endif

//money management
liveaccountbalance = accountbalance+strategyprofit
moneyrisk = (liveaccountbalance*(riskpercent/100))
if onmarket then
onepointvaluebasket = pointvalue*countofposition
mindistancetoclose =(moneyrisk/onepointvaluebasket)*pipsize
endif

//floating profit
floatingprofit = (((close-positionprice)*pointvalue)*countofposition)/pipsize

//actual trade gains
MAfloatingprofit = average[40](floatingprofit)
BBfloatingprofit = MAfloatingprofit - std[40](MAfloatingprofit)*sd

//floating profit risk reward check
if rr>0 and floatingprofit>moneyrisk*rr then
RRreached=1
endif

//stoploss trigger when risk reward ratio is not met already
if onmarket and RRreached=0 then
SELL AT positionprice-mindistancetoclose STOP
endif

//stoploss trigger when risk reward ratio has been reached
if onmarket and RRreached=1 then
if floatingprofit crosses under BBfloatingprofit then
SELL AT MARKET
endif
endif

//resetting the risk reward reached variable
if not onmarket then
RRreached = 0
endif
SHORT:
/// Definition of code parameters
defparam preloadbars =10000
DEFPARAM CumulateOrders = true // Cumulating positions deactivated
Once LastTradeDate = 0
//COI= WEIGHTEDAVERAGE[210](ROC[165] +ROC[150])
//MAC= MACDline[180,390,135]
//CCC= CCI [60]
//AAA= ADX [14]
once RRreached = 0
accountbalance = 10000 //account balance in money at strategy start
riskpercent = 1 //whole account risk in percent%
amount = 2 //lot amount to open each trade
rr = 2 //risk reward ratio (set to 0 disable this function)
sd = 0.25 //standard deviation of MA floating profit


//dynamic step grid
minSTEP = 5 //minimal step of the grid 10
maxSTEP = 20 //maximal step of the grid 50
//ATRcurrentPeriod = 5 //recent volatility 'instant' period 60
//ATRhistoPeriod = 100 //historical volatility period 600

//ATR = averagetruerange[ATRcurrentPeriod]
//histoATR= highest[ATRhistoPeriod](ATR)

resultMAX = MAX(minSTEP*pipsize,0)
resultMIN = MIN(resultMAX,maxSTEP*pipsize)

gridstep = (resultMIN)

// Conditions to enter short positions
//c11 = (COI < COI[1])
//c12 = (COI < 0)
//c13 = (MAC < MAC[1])
//c14 = (MAC < 0)
//c15 = (CCC CROSSES UNDER 0)
//c16 = (AAA > AAA[1])
//c17 = (AAA > 23)

//first trade whatever condition
if NOT ONMARKET And LastTradeDate<>OpenDate then  //close<close[1]
SELLSHORT amount LOT AT MARKET
endif

// case SELL - add orders on the same trend
if shortonmarket and tradeprice(1)-close>=gridstep*pipsize then
SELLSHORT amount LOT AT MARKET
LastTradeDate = OpenDate
endif

//money management
liveaccountbalance = accountbalance+strategyprofit
moneyrisk = (liveaccountbalance*(riskpercent/100))
if onmarket then
onepointvaluebasket = pointvalue*countofposition
mindistancetoclose =(moneyrisk/onepointvaluebasket)*pipsize
endif

//floating profit
floatingprofit = (((close-positionprice)*pointvalue)*countofposition)/pipsize

//actual trade gains
MAfloatingprofit = average[40](floatingprofit)
BBfloatingprofit = MAfloatingprofit - std[40](MAfloatingprofit)*sd

//floating profit risk reward check
if rr>0 and floatingprofit>moneyrisk*rr then
RRreached=1
endif

//stoploss trigger when risk reward ratio is not met already
if onmarket and RRreached=0 then
EXITSHORT AT positionprice-mindistancetoclose STOP
endif

//stoploss trigger when risk reward ratio has been reached
if onmarket and RRreached=1 then
if floatingprofit crosses under BBfloatingprofit then
EXITSHORT AT MARKET
endif
endif

//resetting the risk reward reached variable
if not onmarket then
RRreached = 0
endif
I’ve had some good success using this over the last couple of weeks.
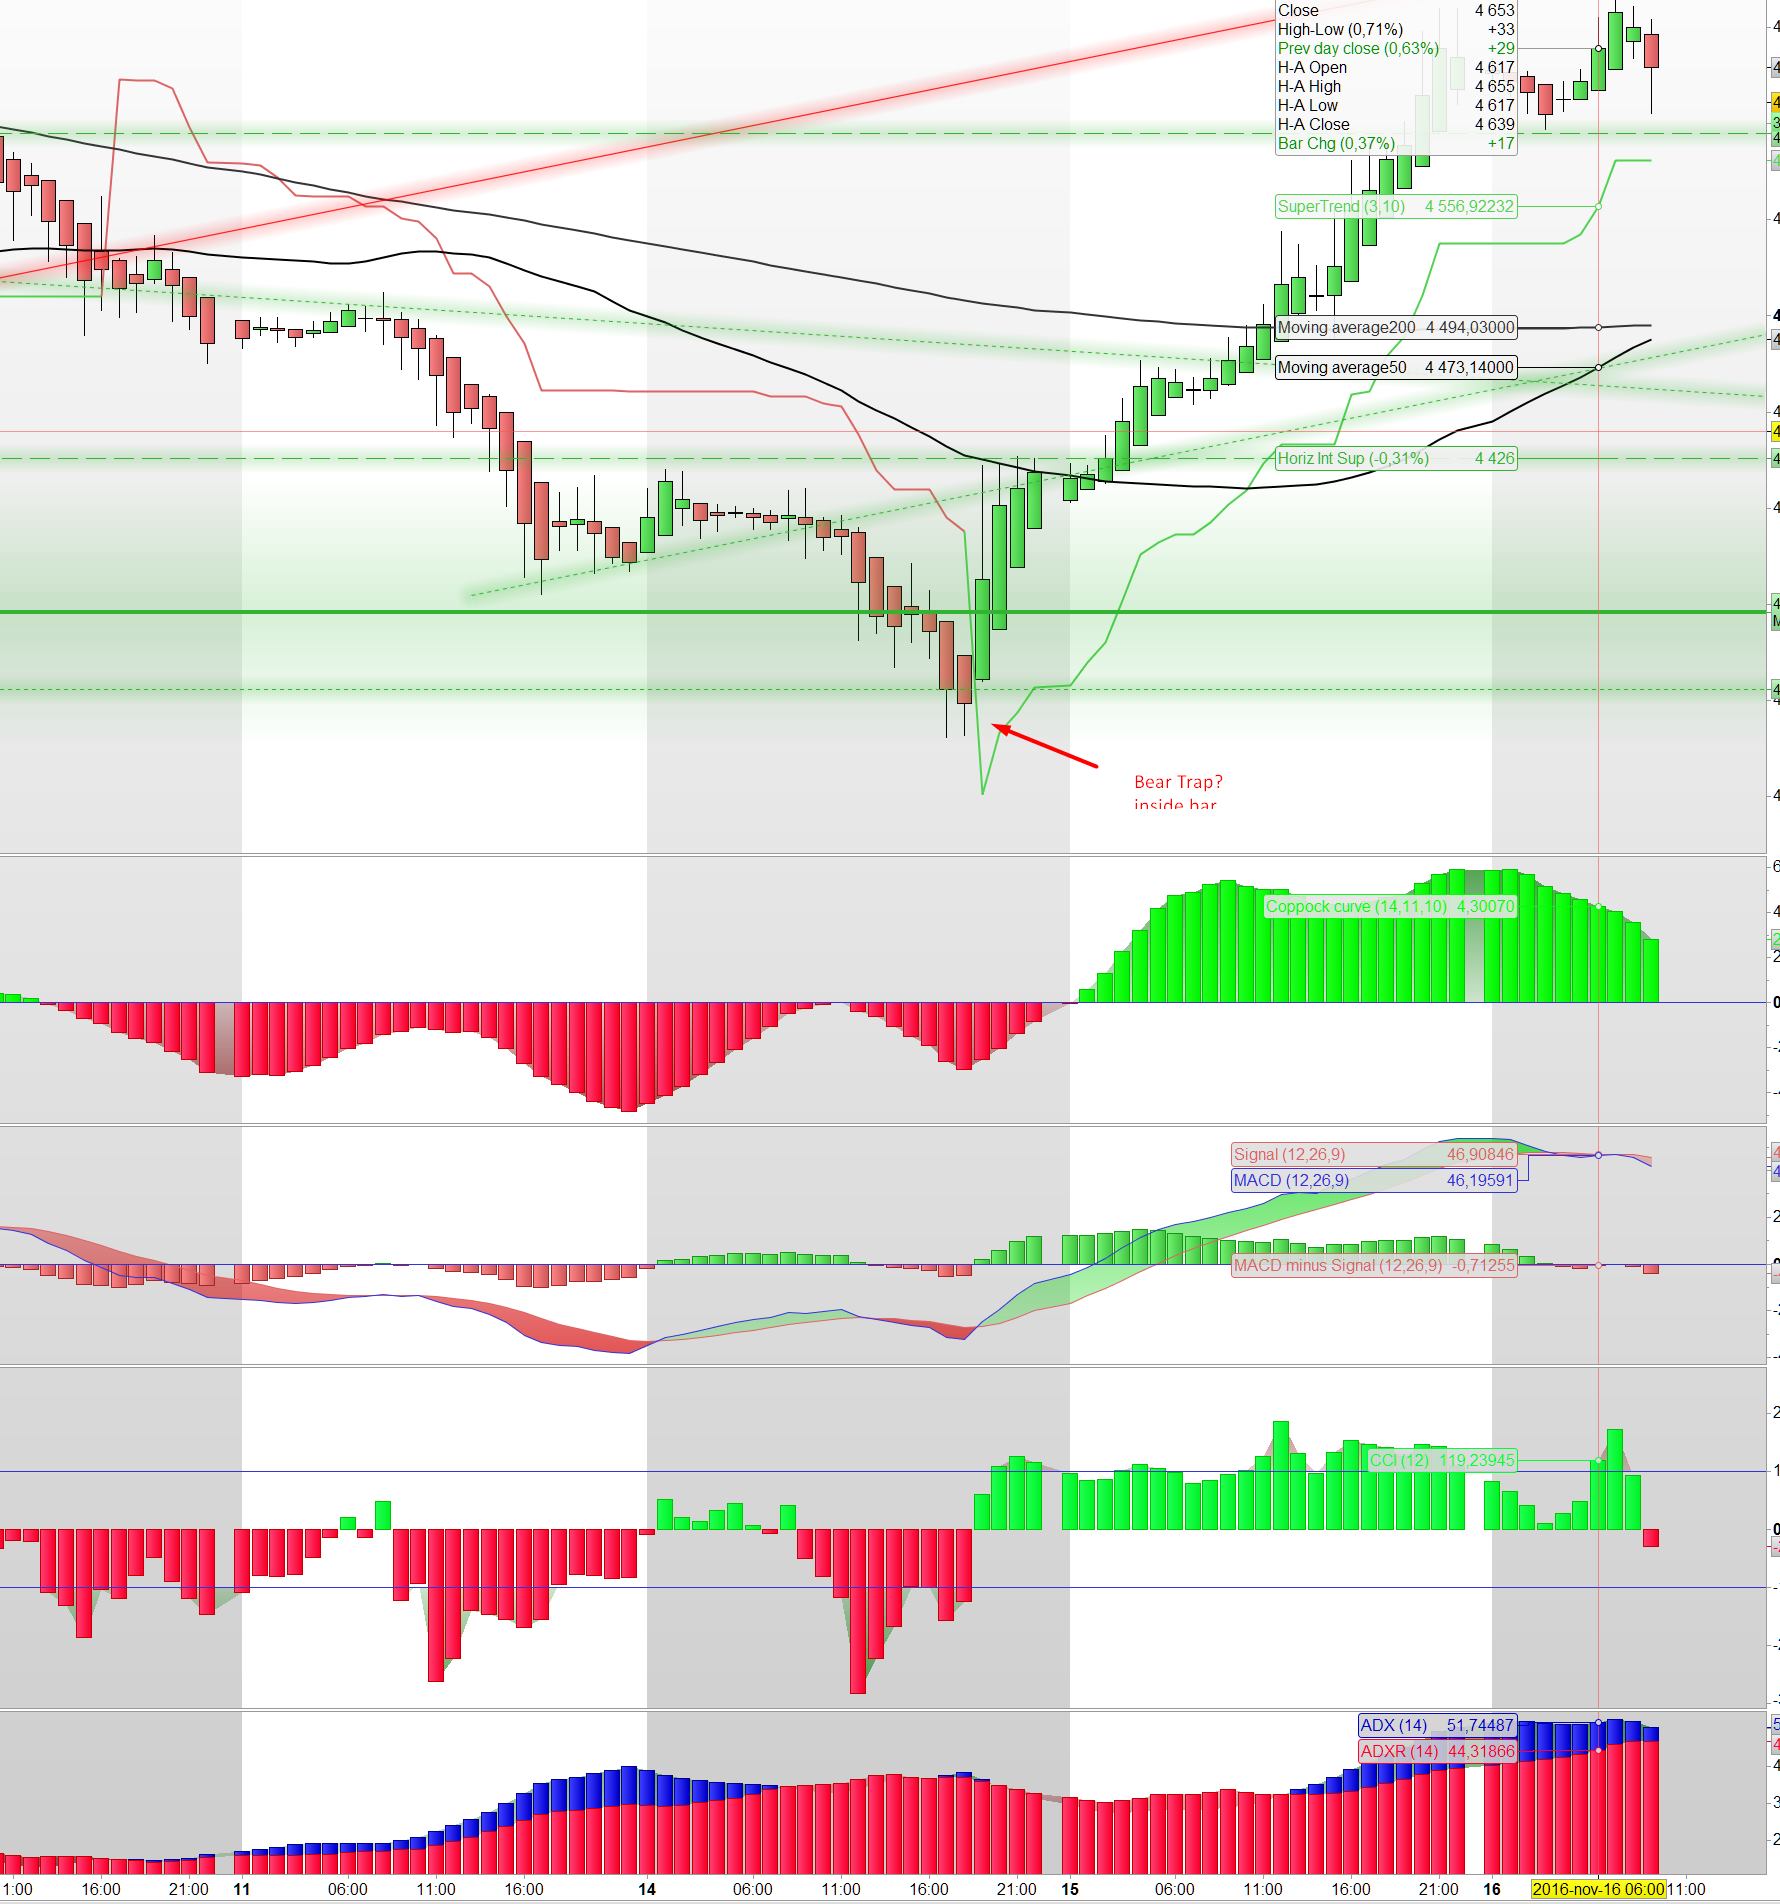
I’m sorry for your loss Cfta- looking at the chart and knowing the code you must have been stopped out with just 5 points more or less. I entered the trade manually just with one position right after the retest of monthly support(4335@12:45) but after a few hours I saw it was rapidly falling and got out with just 10 points. anyway to look at the chart and drop, was this what is called a beartrap? I also see an indside bar with usually signals a reversal?
cheers Kasper