Good Back Test Report But Bad Equity Curve

Viewing 6 posts - 1 through 6 (of 6 total)
  • Author
    Posts
  • #180536 quote
    SpreadBetMHSpreadBetMH
    Participant
    Average

    Hello

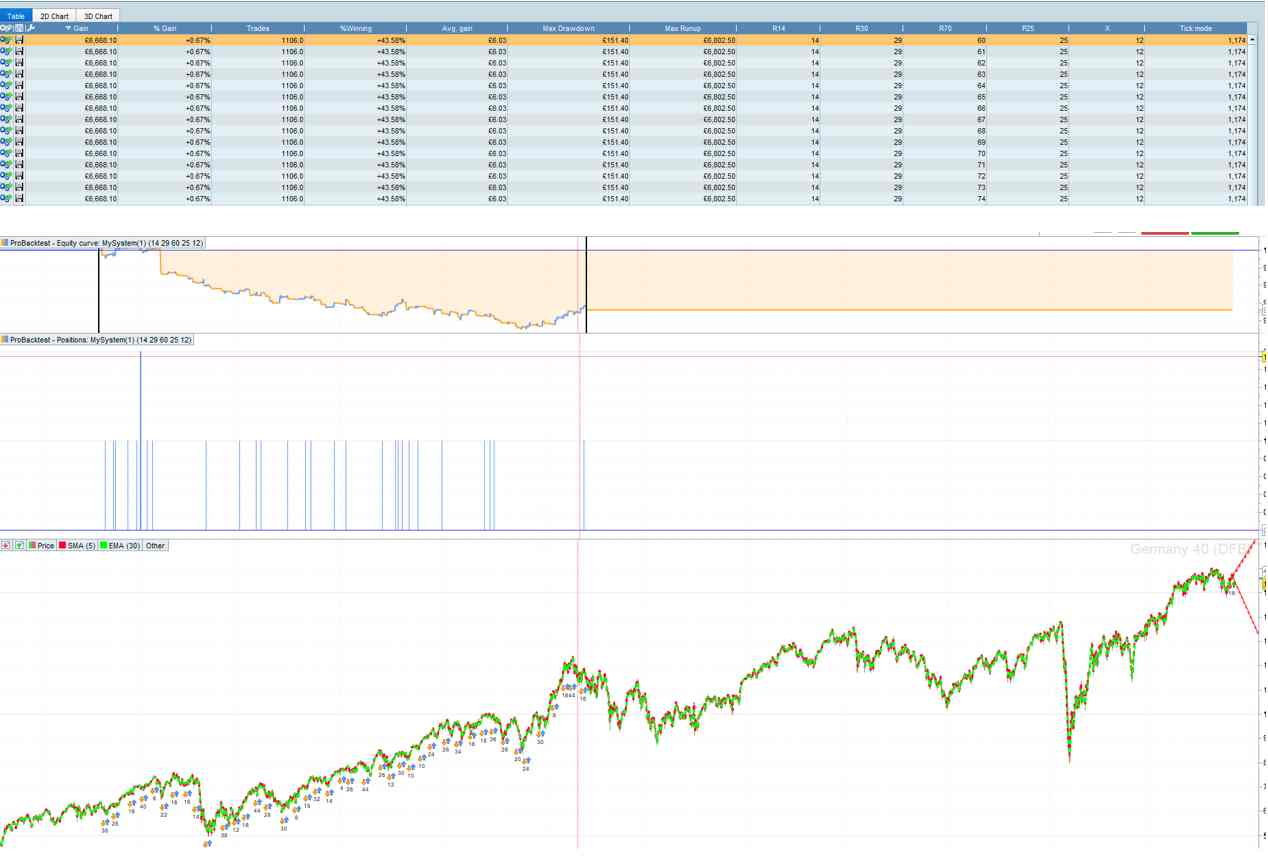
    Why is it when I back test a strategy and have Pro Back Test in Tick by Tick switched on, I get a good Optimize Report and a bad Equity Curve?

    Do I need to upgrade?


    I have attached a file showing the results.

    Thank You

    op-V-op-report.odt
    #180542 quote
    robertogozzirobertogozzi
    Moderator
    Legend

    Please attach JPG or PNG files only for pics (TXT files for unformatted text and PDF files for formatted text).
    Thank you šŸ™‚

    SpreadBetMH thanked this post
    x-13.jpg x-13.jpg
    #180544 quote
    robertogozzirobertogozzi
    Moderator
    Legend

    The optimizer doesn’t use Tick-by-Tick mode.

    SpreadBetMH thanked this post
    #180551 quote
    GraHalGraHal
    Participant
    Master

    See the 1174 in the tick mode column?Ā  Ā That is 1174 instances where – in the same bar – TP and SL were both hit … referred to as zero bars.

    The Optimiser calculates on TP being hit first, no account being taken of SL during those zero bars 1174 bars.

    Your equity curve shows the true result under tick by tick conditions where either TP or SL get hit as price would at each successive tick.

    Does that help your understanding?

    EDIT /PS

    Make TP and SL larger values or optimise for 0 / near zero in the tick column and the backtest results will be closer to the equity curve results.

    SpreadBetMH thanked this post
    #180553 quote
    SpreadBetMHSpreadBetMH
    Participant
    Average

    Saved to JPEG

    Thank You

    So, Tick Mode is when a Stop/Loss & Take Profit happen within the same Candlestick bar, and the way to avoid that is to use a longer S/L & TP

    op-V-op-report-1.odt
    #180556 quote
    GraHalGraHal
    Participant
    Master

    As you say above, yes that is what is meant by the column heading – Tick Mode – in the Optimisation Table.

    Tick by Tick refers to … using each individual price tick to determine the result of your coded strategy … just like it would be in real live data.

    SpreadBetMH thanked this post
Viewing 6 posts - 1 through 6 (of 6 total)
  • You must be logged in to reply to this topic.

ProRealAI ProRealAI New

From idea to ProBuilder code in seconds.

Your coding copilot for ProRealTimeā„¢. Ask in plain English — get clean, ready-to-paste indicators, screeners and systems.

Available in 7 languages
Try ProRealAI

Good Back Test Report But Bad Equity Curve


General Trading: Market Analysis & Manual Trading

New Reply
Author
Summary

This topic contains 5 replies,
has 3 voices, and was last updated by GraHalGraHal

4 years, 11 months ago.

Topic Details
Forum: General Trading: Market Analysis & Manual Trading
Language: English
Started: 10/29/2021
Status: Active
Attachments: 3 files
ProRealCode ProRealCode
Loading...