HI There,
I am using the below code and seems to be getting incorrect results. Wondering why this is happening.
I am looking for gap downs. I got these two stocks in my scan have no clue why they came in my scan. NAB & PNI.
I doubt I may be missing the real gaps as well. if some one can help me fixing the code would be appreciatable.
|
O |
H |
L |
C |
| NAB-5/4/19 |
24.91 |
24.95 |
24.76 |
24.79 |
| NAB-8/4/19 |
24.85 |
24.89 |
24.55 |
24.68 |
| PNI-5/4/19 |
5.33 |
5.39 |
5.205 |
5.385 |
| PNI-8/4/19 |
5.4 |
5.57 |
5.4 |
5.47 |
code:
// Initialization of Amplitude
Amplitude = 0.002
// Initialization of detector
Detector = 0
// Gap Down
// 1st condition of the existence of a gap
IF High < Low[1] THEN
// 2nd condition of the existence of a gap
IF ABS((High – Low[1]) / Low[1]) > Amplitude THEN
// Behavior of the detector
Detector = 1
ENDIF
ENDIF
c1  = volume >50000
c2 = Close > 0.20
indicator1 = ExponentialAverage[20](close)
indicator2 = Average[20](close)
c3 = (indicator1 < indicator2)
indicator3 = MACDline[12,26,9](close)
indicator4 = ExponentialAverage[9](indicator3)
c4 = (indicator3 < indicator4)
SCREENER[Detector and c1 and c2 and c3 and c4] (LOW[1] AS “% Previous Low “)
thanks
To write code, please use the <> “insert PRT code” button to make code more readable. Thank you.
As for NAB, line 9 reports 0.005 which is greater than Amplitude, so it’s ok. Maybe your formula is wrong, what did you mean to achieve with that expression?
Moreover line 15 is easily higher than 0.20, being 24.68 the closing price. Once again, what was your aim?
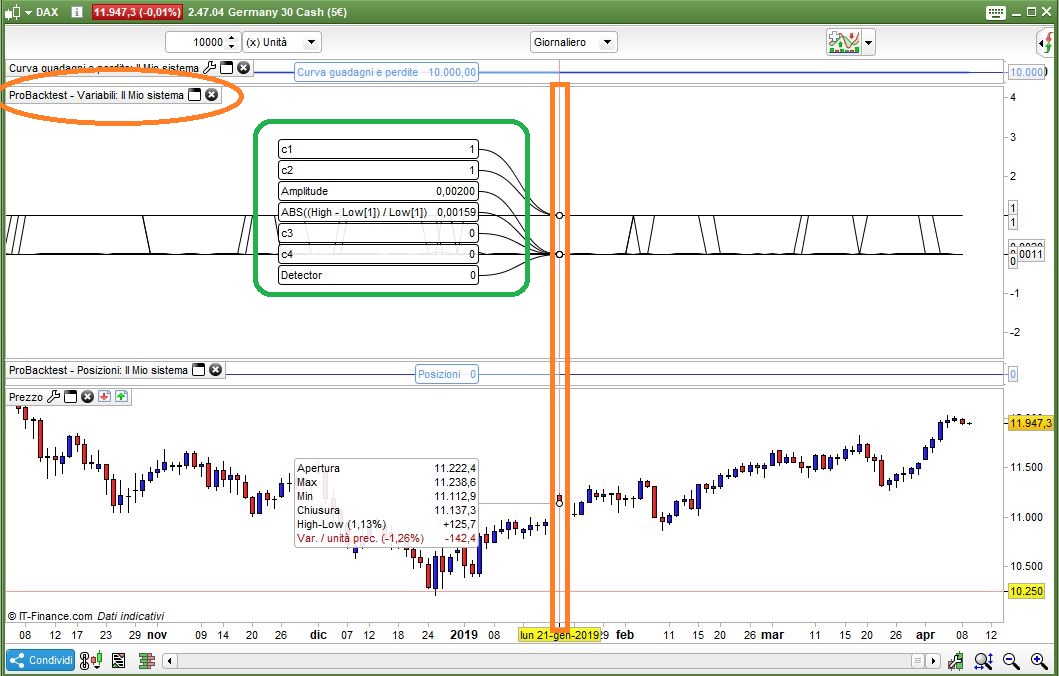
I made a strategy out of your screener. You can backtest it and use GRAPH to spot what value your variables retained at each candle closure (see pic) so that you can easily debug it:
// Initialization of Amplitude
Amplitude = 0.002
// Initialization of detector
Detector = 0
// Gap Down
// 1st condition of the existence of a gap
IF High < Low[1] THEN
   // 2nd condition of the existence of a gap
   IF ABS((High - Low[1]) / Low[1]) > Amplitude THEN
      // Behavior of the detector
      Detector = 1
   ENDIF
ENDIF
c1  = volume >50000
c2 = Close > 0.20
indicator1 = ExponentialAverage[20](close)
indicator2 = Average[20](close)
c3 = (indicator1 < indicator2)
indicator3 = MACDline[12,26,9](close)
indicator4 = ExponentialAverage[9](indicator3)
c4 = (indicator3 < indicator4)
//SCREENER[Detector and c1 and c2 and c3 and c4] (LOW[1] AS "% Previous Low ")
buy at -close limit
graph ABS((High - Low[1]) / Low[1])
graph Amplitude
graph c1
graph c2
graph c3
graph c4
graph Detector
Hi RObert,
thanks for your reply.
my aim is to find all the stocks open gap down and still gap exists. ( today high is < yesterday low)
like-2 to line 13 I am expected to filtered (NAB & PNI)
My criteria as below:
- find stocks that have current gaps today
- today volume is more than 50000
- price is more than 0.20
- EMA 20 > MA20
- MACD is above SIGNAL line
can you please check my code is meeting my criteria.
I could have used Amplitude = 0.001
I increased it to 0.002 to get little bit big gaps.
thanks
kumar
Your code is correct, you have just to change line 18, replacing “<“ with “>”.
Why NAB shouldn’t have been reported? It meets your requirements!
thanks for line 18. I will correct it.
NAB & PNI both should not be reported reason is below.
this scan was produced on 8-4-19 (Monday). Day before is 5-4-19 (Friday).
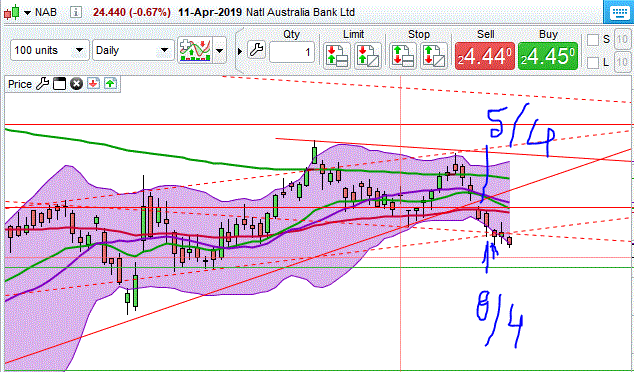
NAB do not have gap down on monday. OPEN = 24.85 & HIGH = 24.89 ; Friday LOW = 24.76 as per line 7 it should be filtered out.
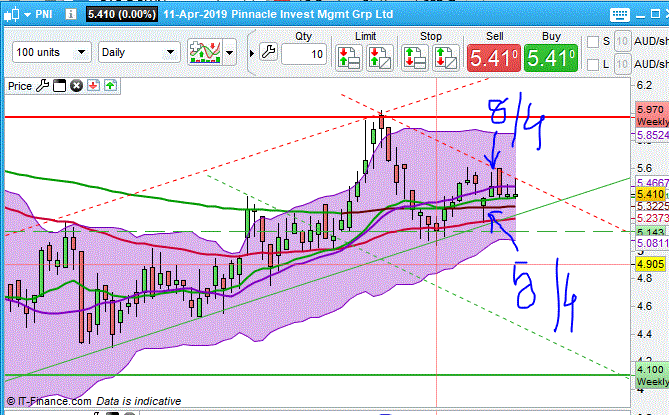
PNI do not have gap down on Monday. OPEN = 5.40 & HIGH = 5.47 ; Friday LOW = 5.205 as per line 7 it should be filtered out.
I expect if HIGH 24.89 is lower than previous day low (i.e: LOW[1] = 24.76) & PNI.
please correct me if i am wrong.
Sorry, I can’t fine ant NAB, nor PNI, stock code bot on IG and PRT. Can you provide the name of the company, please?
Do you have end-of-day data?
NAB —–National Australia Bank
PNI —Pinnacle Invert Mgmt Grp Ltd
Both are ASX- Australian stock exchange.
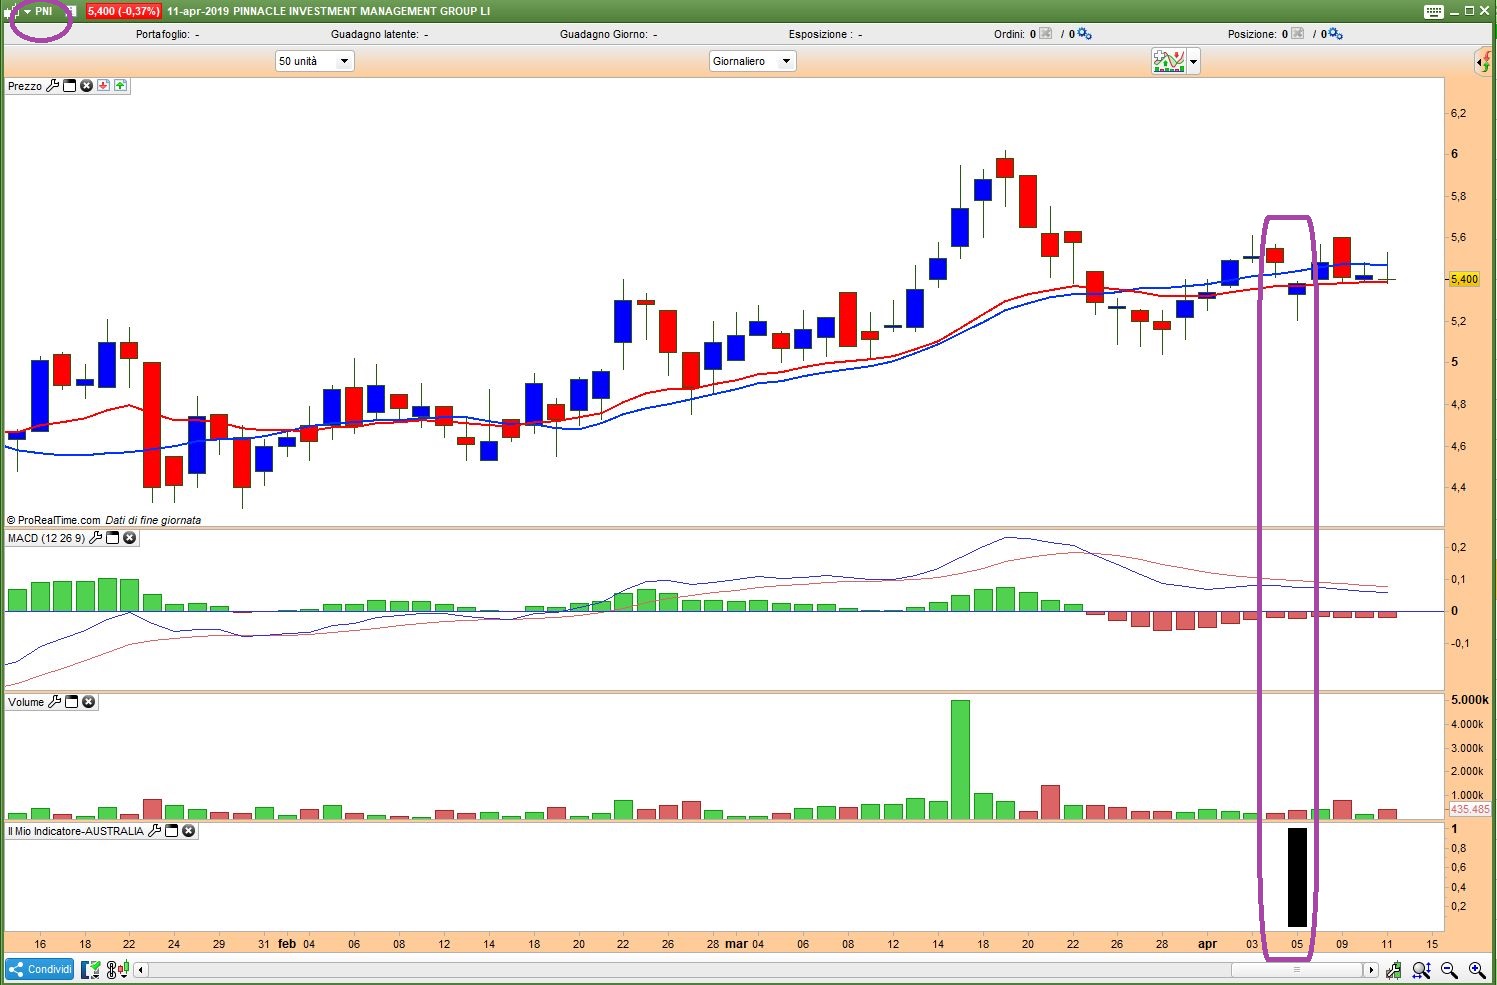
Screen shots are attached. LAst bar ON right hand side (RHS) belongs today which is 11/4. we are talking about Monday & Friday bars. That means 4th and 5th from RHS
I asked if you have emd-of-day data, but you did not answer.
I think that is the issue, since you cannot access the MONDAY data, so HIGH refers to friday 5th and LOW[1] refers to Thursday 4th, in which cases it’s ok both for NAB and PNI.
HI RObert,
I have checked with IG markets. My account is live account and all my data is live data.
I have these results on 8th during market open and even after market closed. (late night).
I have no clue. your logic seems to be correct. both stocks have gap down on 5 th april.
I will post you if I see more of this type.
thanks