Buongiorno, non è possibile rappresentare i gap in un timeframe superiore (ad esempio 1 ora) e calcolare il volume profile in un timeframe inferiore (ad esempio 1 minuto)…
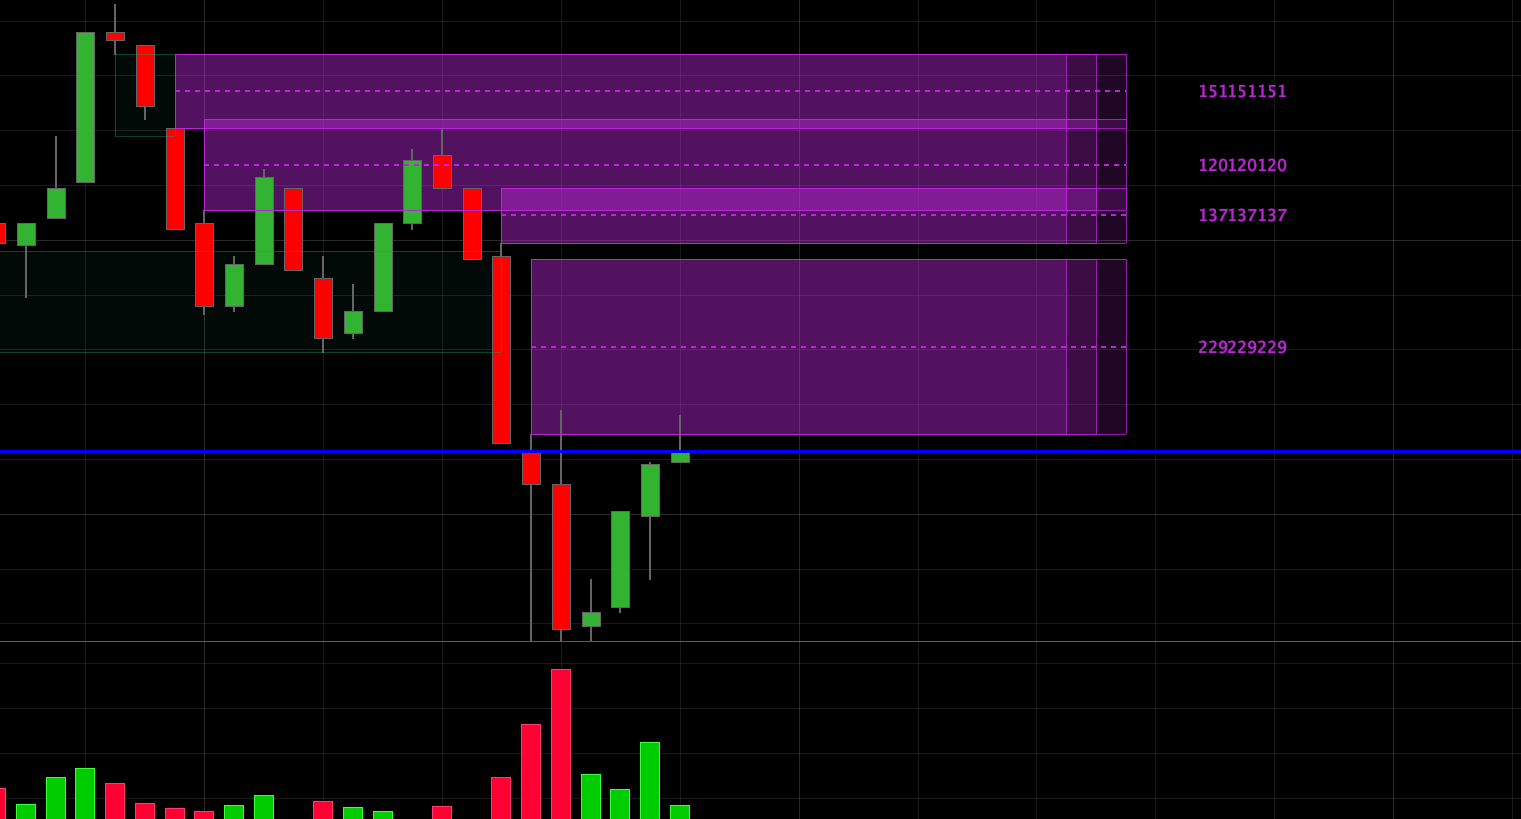
Ti passo una versione ridotta. Calcola i FVG e il volume delle 3 candele. Inoltre, calcola il punto medio del gap.
// FVG and Volume
// Versión 2.0 - 20241016
// -----------------------------------------------
// CONFIGURACIÓN DE USUARIO
// -----------------------------------------------
showBox = 20 // Número de últimos FVGs a mostrar
extendBars = 50 // Extensión del dibujo hacia el futuro
gapfilter = 0.5 // Filtro para el tamaño del gap
// -- Colores y Estilos --
bullColorR = 29
bullColorG = 163
bullColorB = 112
bearColorR = 188
bearColorG = 37
bearColorB = 214
fvgOpacity = 200
// -----------------------------------------------
// DETECCIÓN DE FVGS
// -----------------------------------------------
// Normalización del tamaño del gap
stdevBullish = STD[200](low - high[2])
IF stdevBullish > 0 THEN
   bullishgapsize = (low - high[2]) / stdevBullish
ELSE
   bullishgapsize = 0
ENDIF
stdevBearish = STD[200](low[2] - high)
IF stdevBearish > 0 THEN
   bearishgapsize = (low[2] - high) / stdevBearish
ELSE
   bearishgapsize = 0
ENDIF
// Condiciones para detectar los FVGs
bullishgapcondition = (low > high[2]) AND (high[1] > high[2]) AND (bullishgapsize > gapfilter)
bearishgapcondition = (high < low[2]) AND (low[1] < low[2]) AND (bearishgapsize > gapfilter)
// Almacenar FVG Alcista en arrays
IF bullishgapcondition THEN
   m = m + 1
   $BoxTop[m] = low
   $BoxBottom[m] = high[2]
   $BoxBarLeft[m] = barindex
   $BoxBarRight[m] = barindex
   $BoxVol[m] = volume + volume[1] + volume[2]
   $BoxType[m] = 1
   $BoxMitigated[m] = 0
ENDIF
// Almacenar FVG Bajista en arrays
IF bearishgapcondition THEN
   m = m + 1
   $BoxTop[m] = low[2]
   $BoxBottom[m] = high
   $BoxBarLeft[m] = barindex
   $BoxBarRight[m] = barindex
   $BoxVol[m] = volume + volume[1] + volume[2]
   $BoxType[m] = -1
   $BoxMitigated[m] = 0
ENDIF
// -----------------------------------------------
// DIBUJO Y GESTIÓN (Solo en la última barra)
// -----------------------------------------------
IF islastbarupdate THEN
   // --- Procesar y dibujar FVGs Alcistas ---
   FOR i = m DOWNTO 1 DO
      // Comprobar si el FVG ha sido mitigado
      IF $BoxMitigated[i] = 0 and $BoxType[i]>0 THEN
         FOR j = $BoxBarLeft[i] + 1 TO barindex DO
            IF low[barindex-j] < $BoxBottom[i] THEN
               $BoxMitigated[i] = 1
               $BoxBarRight[i] = barindex[barindex-j]
               BREAK
            ENDIF
         NEXT
      elsif $BoxMitigated[i] = 0 and $BoxType[i]<0 then
         FOR j = $BoxBarLeft[i] + 1 TO barindex DO
            IF high[barindex-j] > $BoxTop[i] THEN
               $BoxMitigated[i] = 1
               $BoxBarRight[i] = barindex[barindex-j]
               BREAK
            ENDIF
         NEXT
      ENDIF
   next
   // Dibujar solo los FVGs solicitados por el usuario
   for i=m downto m-showBox do
      pocLevel = ($BoxTop[i] + $BoxBottom[i]) / 2
      vol = $BoxVol[i]
      if $BoxType[i]>0 then
         IF $BoxMitigated[i] = 0 THEN // No mitigado
            DRAWRECTANGLE($BoxBarLeft[i], $BoxTop[i], barindex + extendBars, $BoxBottom[i]) COLOURED(bullColorR, bullColorG, bullColorB, fvgOpacity)fillcolor(bullColorR, bullColorG, bullColorB, 45)
            DRAWSEGMENT($BoxBarLeft[i], pocLevel, barindex + extendBars, pocLevel) STYLE(DOTTEDLINE, 2) COLOURED(bullColorR, bullColorG, bullColorB)
            DRAWTEXT("#vol#", barindex + extendBars+5, pocLevel, Dialog, Standard, 10) COLOURED(bullColorR, bullColorG, bullColorB)
         ELSE // Mitigado
            DRAWRECTANGLE($BoxBarLeft[i], $BoxTop[i], $BoxBarRight[i], $BoxBottom[i]) COLOURED(bullColorR, bullColorG, bullColorB, fvgOpacity / 2)fillcolor(bullColorR, bullColorG, bullColorB, 15)
         ENDIF
      else
         IF $BoxMitigated[i] = 0 THEN // No mitigado
            DRAWRECTANGLE($BoxBarLeft[i], $BoxTop[i], barindex + extendBars, $BoxBottom[i]) COLOURED(bearColorR, bearColorG, bearColorB, fvgOpacity)fillcolor(bearColorR, bearColorG, bearColorB, 45)
            DRAWSEGMENT($BoxBarLeft[i], pocLevel, barindex + extendBars, pocLevel) STYLE(DOTTEDLINE, 2) COLOURED(bearColorR, bearColorG, bearColorB)
            DRAWTEXT("#vol#", barindex + extendBars+5, pocLevel, Dialog, Standard, 10) COLOURED(bearColorR, bearColorG, bearColorB)
         ELSE // Mitigado
            DRAWRECTANGLE($BoxBarLeft[i], $BoxTop[i], $BoxBarRight[i], $BoxBottom[i]) COLOURED(bearColorR, bearColorG, bearColorB, fvgOpacity / 2)fillcolor(bearColorR, bearColorG, bearColorB, 15)
         ENDIF
      endif
   next
ENDIF

RETURN