All my algos have the best results using optimized fixed stop loss/targets/trailing stops.
ive tried using stuff like
set Stop ploss = averagetruerange[x1](close) * x2
but again, optimized fixed numbers just seem to perform better for me, at least thus far. Any thoughts on this?
What do you guys use the most and why? And have u tried fixed/dynamic?
Would like to add that i do belive that a more dynamic sounds more logically useable than a fixed number over 10 years backtest, but somehow fixed still works better for me..
now im not sure it works better because its more “curve fitted” but is this such a bad curvefit? thoughts?
I’m not a big user of any sort of take profit target or stop loss levels but if I do use one then it is % of price based rather than fixed. I think that if you use a fixed level across all of history then you are 100% curve fitting and it is unlikely to work going forward or will at least slowly stop performing going forward.
I am assuming that you test values either side of your chosen SL and TP levels to see how the equity curve looks with slightly different values? I guess a good test is to do a WF optimization of SL and TP and then see how a complete equity curve would look with the values chosen for each WF sample. This will let you see how tolerant your strategy is of different values – perhaps they all fall within a % band of price anyway.
Forgot to add:
Perhaps the SL and TP are the most important values for regular re-optimization?
Also I am not a fan of ATR to choose levels – too laggy and sometimes too susceptible to sudden price spikes leaving you with your dangly bits on a chopping block for the next few trades even though the market has settled down quickly.
I also have found that fixed TP and SL have given me the best results.
I have tried loads of the various trailing stops off here, and also stops based on ATR etc etc.
I only ever choose my value for TP and SL if many of the values either side are acceptable also on a gradually increasing and reducing basis. None of this using the exceptional outlier that gives unrealistic profits!
Also – having done tons of manual trading – my preference is to choose a value for fixed TP and SL which (from my manual experience) are comfortably attainable against any respective timescale.
I do also choose values for TP and SL that are outside of the above comfortable values if it is seen that many of the values either side are acceptable also on a gradually increasing and reducing basis.
Well i got a theory on why the fixed works better. If you draw in suppport/horisontal lines in a chart (say 1h if ur algo is in 1h) and you will quickly see that theres a roughly fixed XX pips in between the levels of support/resistance. Obviously sometimes price barely dosnt hit the level and sometimes it zooms past it. But with fixed you can at least (sort of) put your stop/target on those levels.
At least from my own personal experience i see my algos setting stop loss + target more or less on the levels of support and resistance, its quite amazing to watch to be honest.. might sound crazy but it has happened in the majority of the trades ive watched happen.
And yea Vonasi, obviously its curvefitting, but logically, lets say you make your strategy, you optimize your entry and exit, then you add your stop loss and profit target. You have already “made” your entry and exit, all your asking is to optimize the target and stop loss of those trades. And im not talking about “crazy stuff” like Set target 24 pips on 5 hour chart..
Like in wall st im usually around 70-100 optimized pips stop loss is working good on 1h breakout/momentum systems. Again, this is my experience only..
Again, this is my experience only.
No not just you, I agree also.
I used to trade the 1 min TF manual loads and minor Support and resistance levels were often 11 to 13 points ish so when I see TP and SL at 12 or so after optimising on 1 min TF I think ahaha!!!
I think that because we are now talking 1 hour charts I can see why fixed SL and TP values work for you both. On 1 hour charts we don’t have enough history to worry too much about curve fitting those values. However if you could take your 2018 to 2019 SL and TP values and test them on a 1995 chart I think you would soon declare them as being very much curve fitted to the most recent data.
Vonasi – Yea i agree, i had fixed pip stop /target on a couple of daily systems as well and i can clearly see in the backtest, if i go far enough back, that the fixed targets are basicly just rubish. This is also mainly why i want to know about better alternatives. im not loving the ATR myself..
Whats my options? Just go with a fixed %?
Whats my options? Just go with a fixed %?
Maybe better but still far from perfect as volatility pays only little respect to price.
This is an interesting question and has got my mind thinking – what if we used an all time average of true range as a percentage of price as our starting point for TP and SL levels?
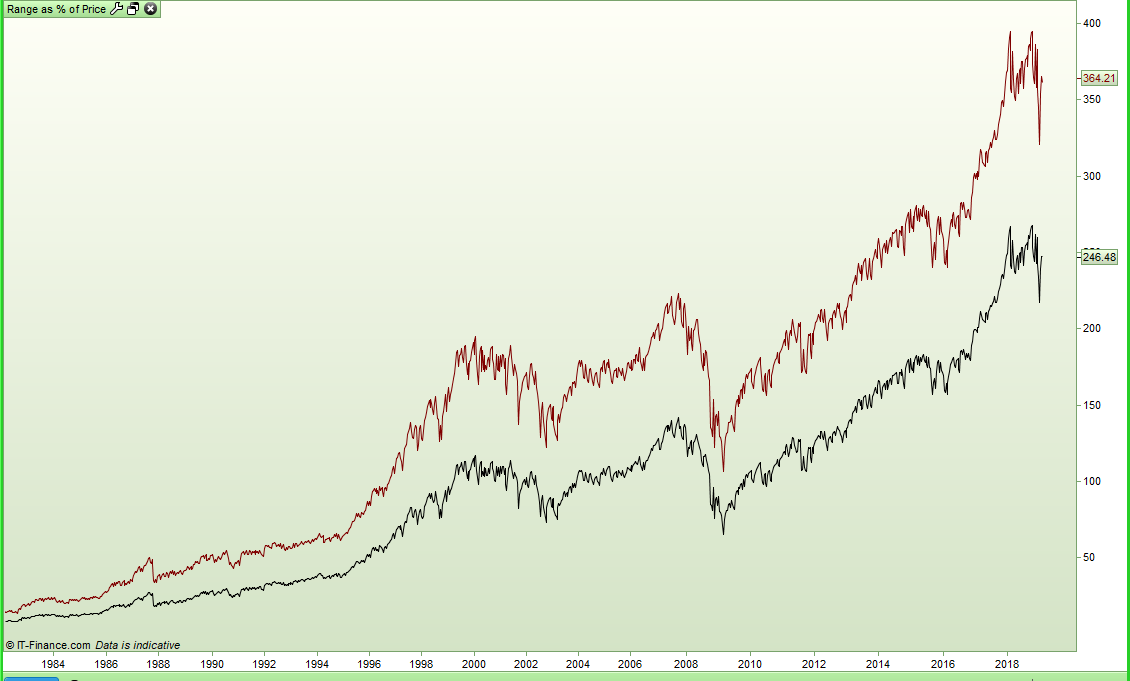
Here is an indicator showing 1% of price and a calculated all time true range percentage of price average:
if barindex >= 1 then
a = a + (tr/open)
b = b + 1
c = (a / b) * open
endif

d = open * 0.01

return d coloured(0,0,0) as "1%", c coloured(128,0,0) as "All Time Average TR as %"
[attachment file=90071]
Not sure if the average is better than a fixed percentage but it might be interesting to test it out.
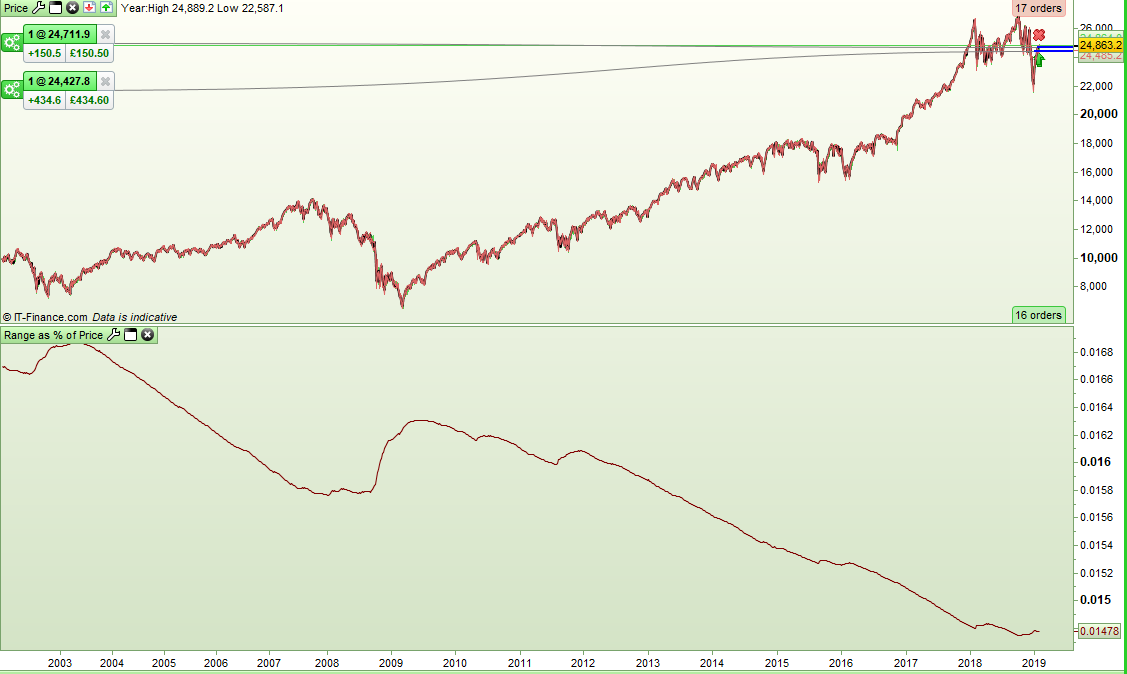
Changing the calculation so that we can see what percentage the all time average is of price creates a very interesting chart:
if barindex >= 1 then
a = a + ((tr/open)*100)
b = b + 1
c = (a / b) //* open
endif

return c coloured(128,0,0) as "All Time Average TR as %"
[attachment file=90078]
We can see that the range average percentage drops in rising markets and rises in falling markets. All this is on the DJI.
Im not exactly getting what the charts are saying, can u explain a little further?
Nice trade(s) u got going on.. dow jones just popped up, im up a few pips myself, lets hope for a big fat green day 🙂
We can see that the range average percentage drops in rising markets and rises in falling markets.
Fear stronger than greed and punters bottling out at lower lows / breaks in support levels?
In a rising market there are not always Highs to the near left of price to base trade decisions on as easily as Lows to the near left (where price has been!) in a falling market.
The first chart is just a comparison of how many pips a fixed percentage of price would be compared to using an all time average of true range as a percentage of price calculated into pips. The latter could be a base for calculating TP and SL. The fixed percentage and all time average follow similar paths but it can be seen that when rising they slowly get further apart and when falling they slowly get closer together. A good test would be to have a strategy and directly compare the two to see if one provides better SL and TP than the other.
The second image just changes things so that we can see what percentage of price the all time average of true range as a percentage of price actually is – rather than a number of pips. It seems that on the DJI at least that as a trend continues on up the range compared to price drops off. Maybe less money going in to the market and more people thinking this can’t go on forever leads to less volatility which is represented by true range. Then as price drops people buy value and then sell when in profit or panic and get out in a loss which equals volatility and increased range and so the true range becomes a larger percentage of price.
All just guess work from a five minute look at one chart – and from a quick look at other indices it may work better as a theory on DOW and SP500 than on smaller indices but still it might be an interesting calculation to maybe base your TP and SL on to try to stay tuned to the market.