Paul
PaulParticipant
Master
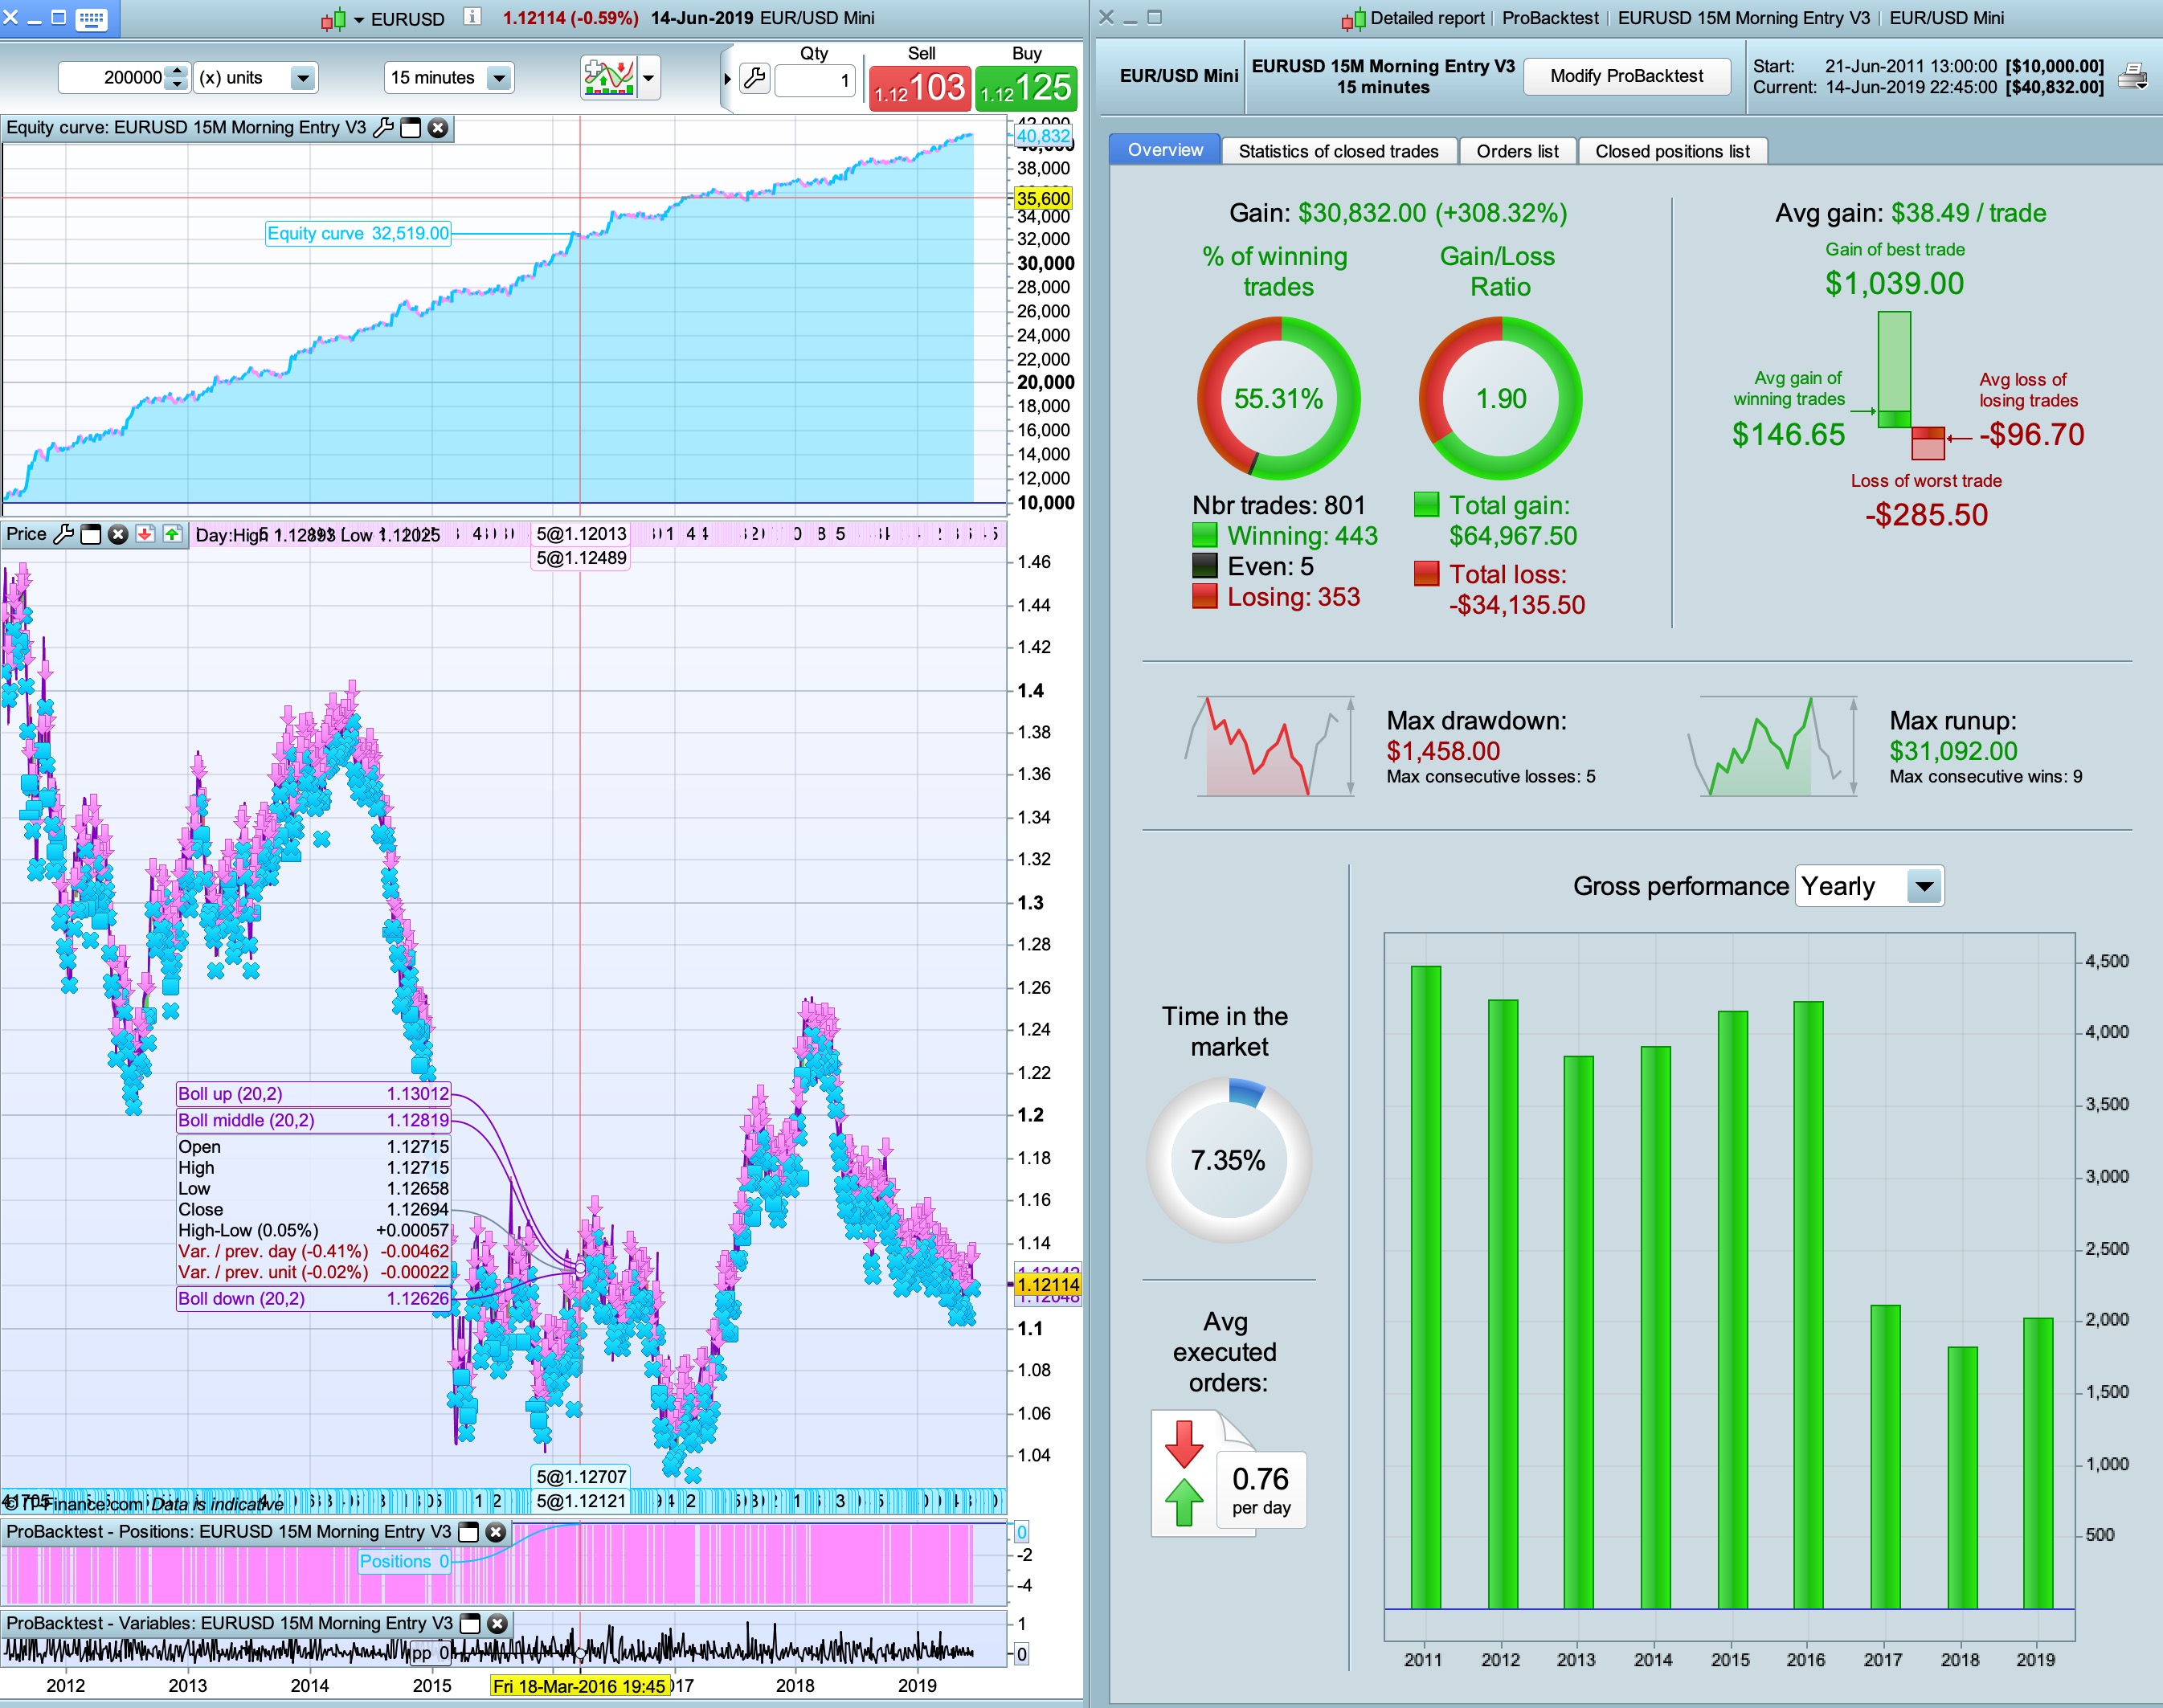
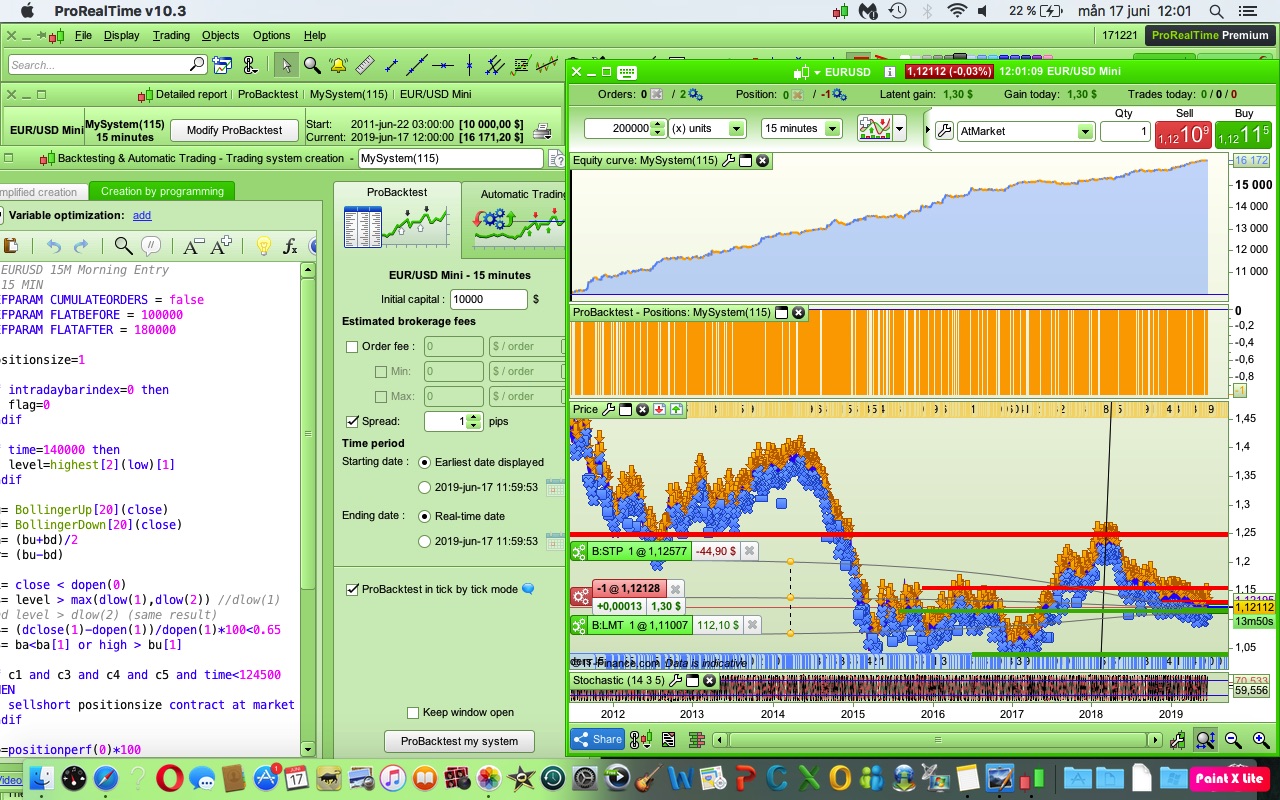
Found that if you don’t use breakeven, and use this version, you don’t have to use a profit-target too.
Payout is higher, the only cost is a slightly higher drawdown. Equity-curve is about the same.
Much quicker calculations!
//EURUSD 15M Morning Entry
//15 MIN
DEFPARAM CUMULATEORDERS = false
DEFPARAM FLATBEFORE = 100000
DEFPARAM FLATAFTER = 200000

positionsize=5

if intradaybarindex=0 then
flag=0
endif

if time=140000 then
level=highest[2](low)[1]
endif

bu= BollingerUp[20](close)
bd= BollingerDown[20](close)
ba= (bu+bd)/2
br= (bu-bd)

c1= close < dopen(0)
c3= level > max(dlow(1),dlow(2)) //dlow(1) and level > dlow(2) (same result)
c4= (dclose(1)-dopen(1))/dopen(1)*100<0.65
c5= ba<ba[1] or high > bu[1]


if c1 and c3 and c4 and c5 and time<130000 THEN
sellshort positionsize contract at market
endif

pp=positionperf(0)*100

if shortonmarket and time=141500 and pp<0.30 then
exitshort at market
else
if time> 141500 and pp>0.40 then
flag=1
endif
if flag=1 and br<br[1] and br[1]<br[2] and br[2]<br[3] and br[3]<br[4] then
exitshort at market
endif
endif

SET STOP %LOSS 0.4
//SET TARGET %profit 1
PaulParticipant
Master
//EURUSD 15M Morning Entry
//15 MIN
DEFPARAM CUMULATEORDERS = false
DEFPARAM FLATBEFORE = 100000
DEFPARAM FLATAFTER = 200000

positionsize=5

if intradaybarindex=0 then
flag=0
endif

if time=140000 then
level=highest[2](low)[1]
endif

bu= BollingerUp[20](close)
bd= BollingerDown[20](close)
ba= (bu+bd)/2
br= (bu-bd)

c1= close < dopen(0)
c3= level > max(dlow(1),dlow(2)) //dlow(1) and level > dlow(2) (same result)
c4= (dclose(1)-dopen(1))/dopen(1)*100<0.65
c5= ba<ba[1] or high > bu[1]

if c1 and c3 and c4 and c5 and time<130000 THEN
sellshort positionsize contract at market
endif

pp=positionperf(0)*100

if shortonmarket and time=141500 and pp<0.40 and low>bd then
exitshort at market
else
if time> 141500 and pp>=0.15 then
flag=1
endif
if flag=1 and br<br[1] and br[1]<br[2] and br[2]<br[3] and br[3]<br[4] then
exitshort at market
endif
endif

SET STOP %LOSS 0.4
set TARGET %profit 1.5

graph pp
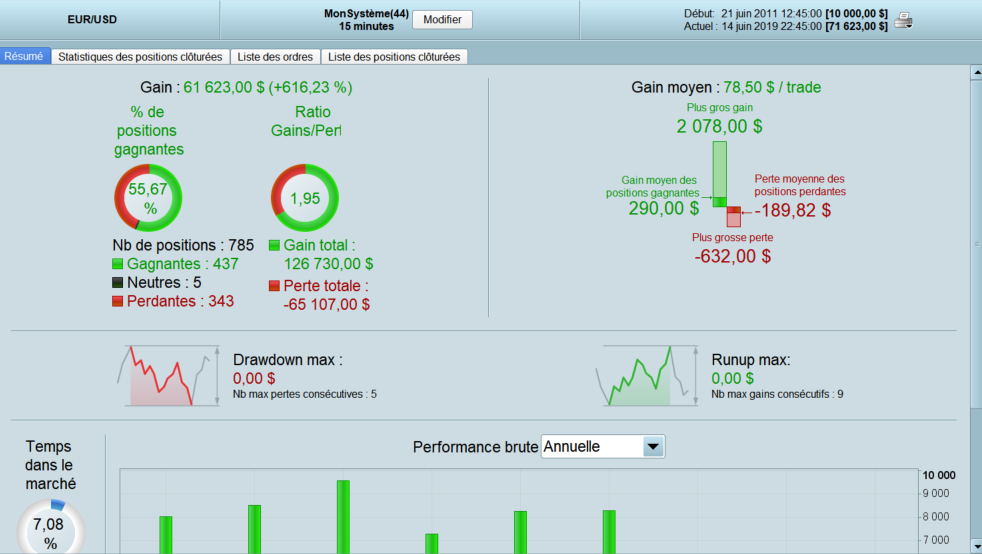
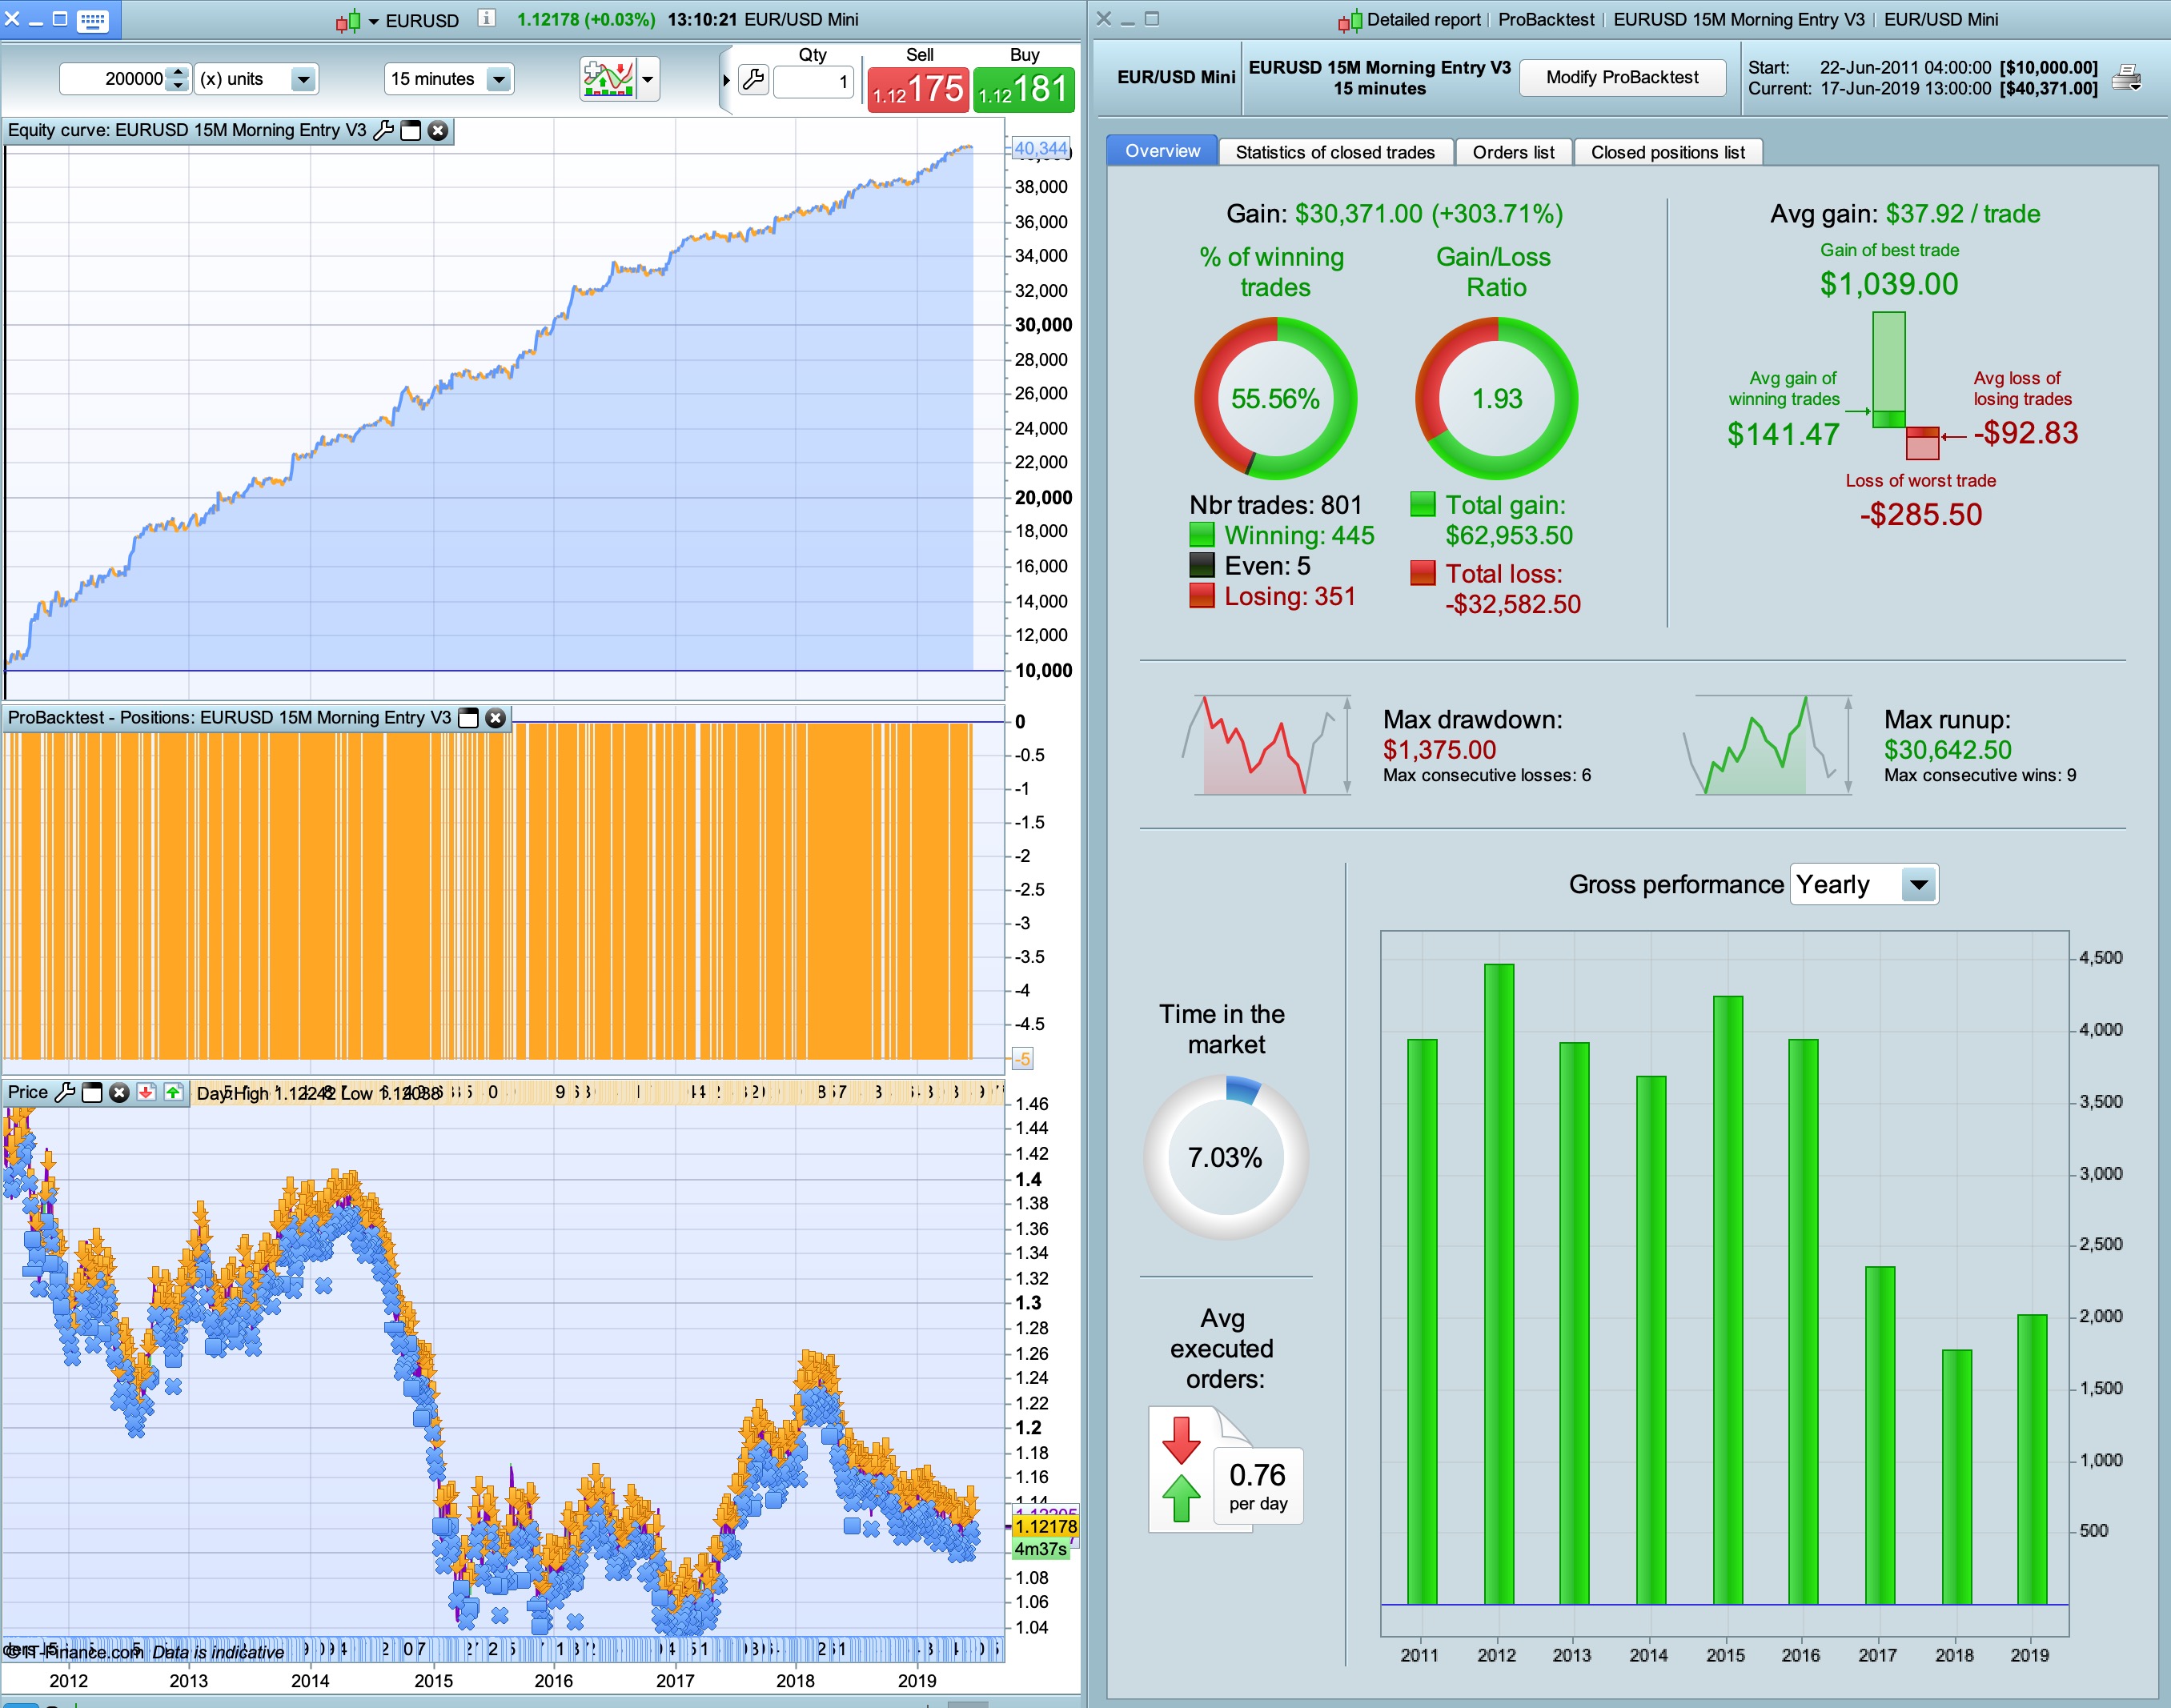
Use of bollingerbands is working very nicely
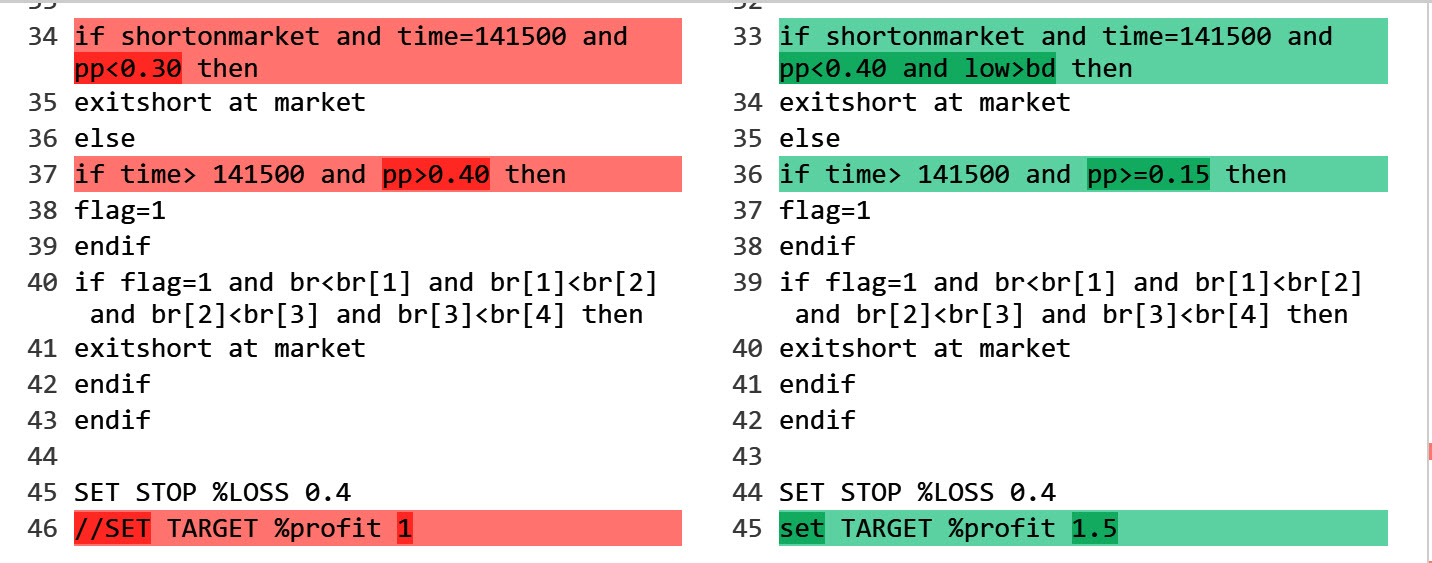
For your convenience … attached is a screen shot of the differences between the above 2 version of code.
Keep ’em coming Paul.
Thank you for sharing.
@stefou102 @stefou102 Have u seen a difference using market vs limit orders? Whats your preference and why?
Hello,
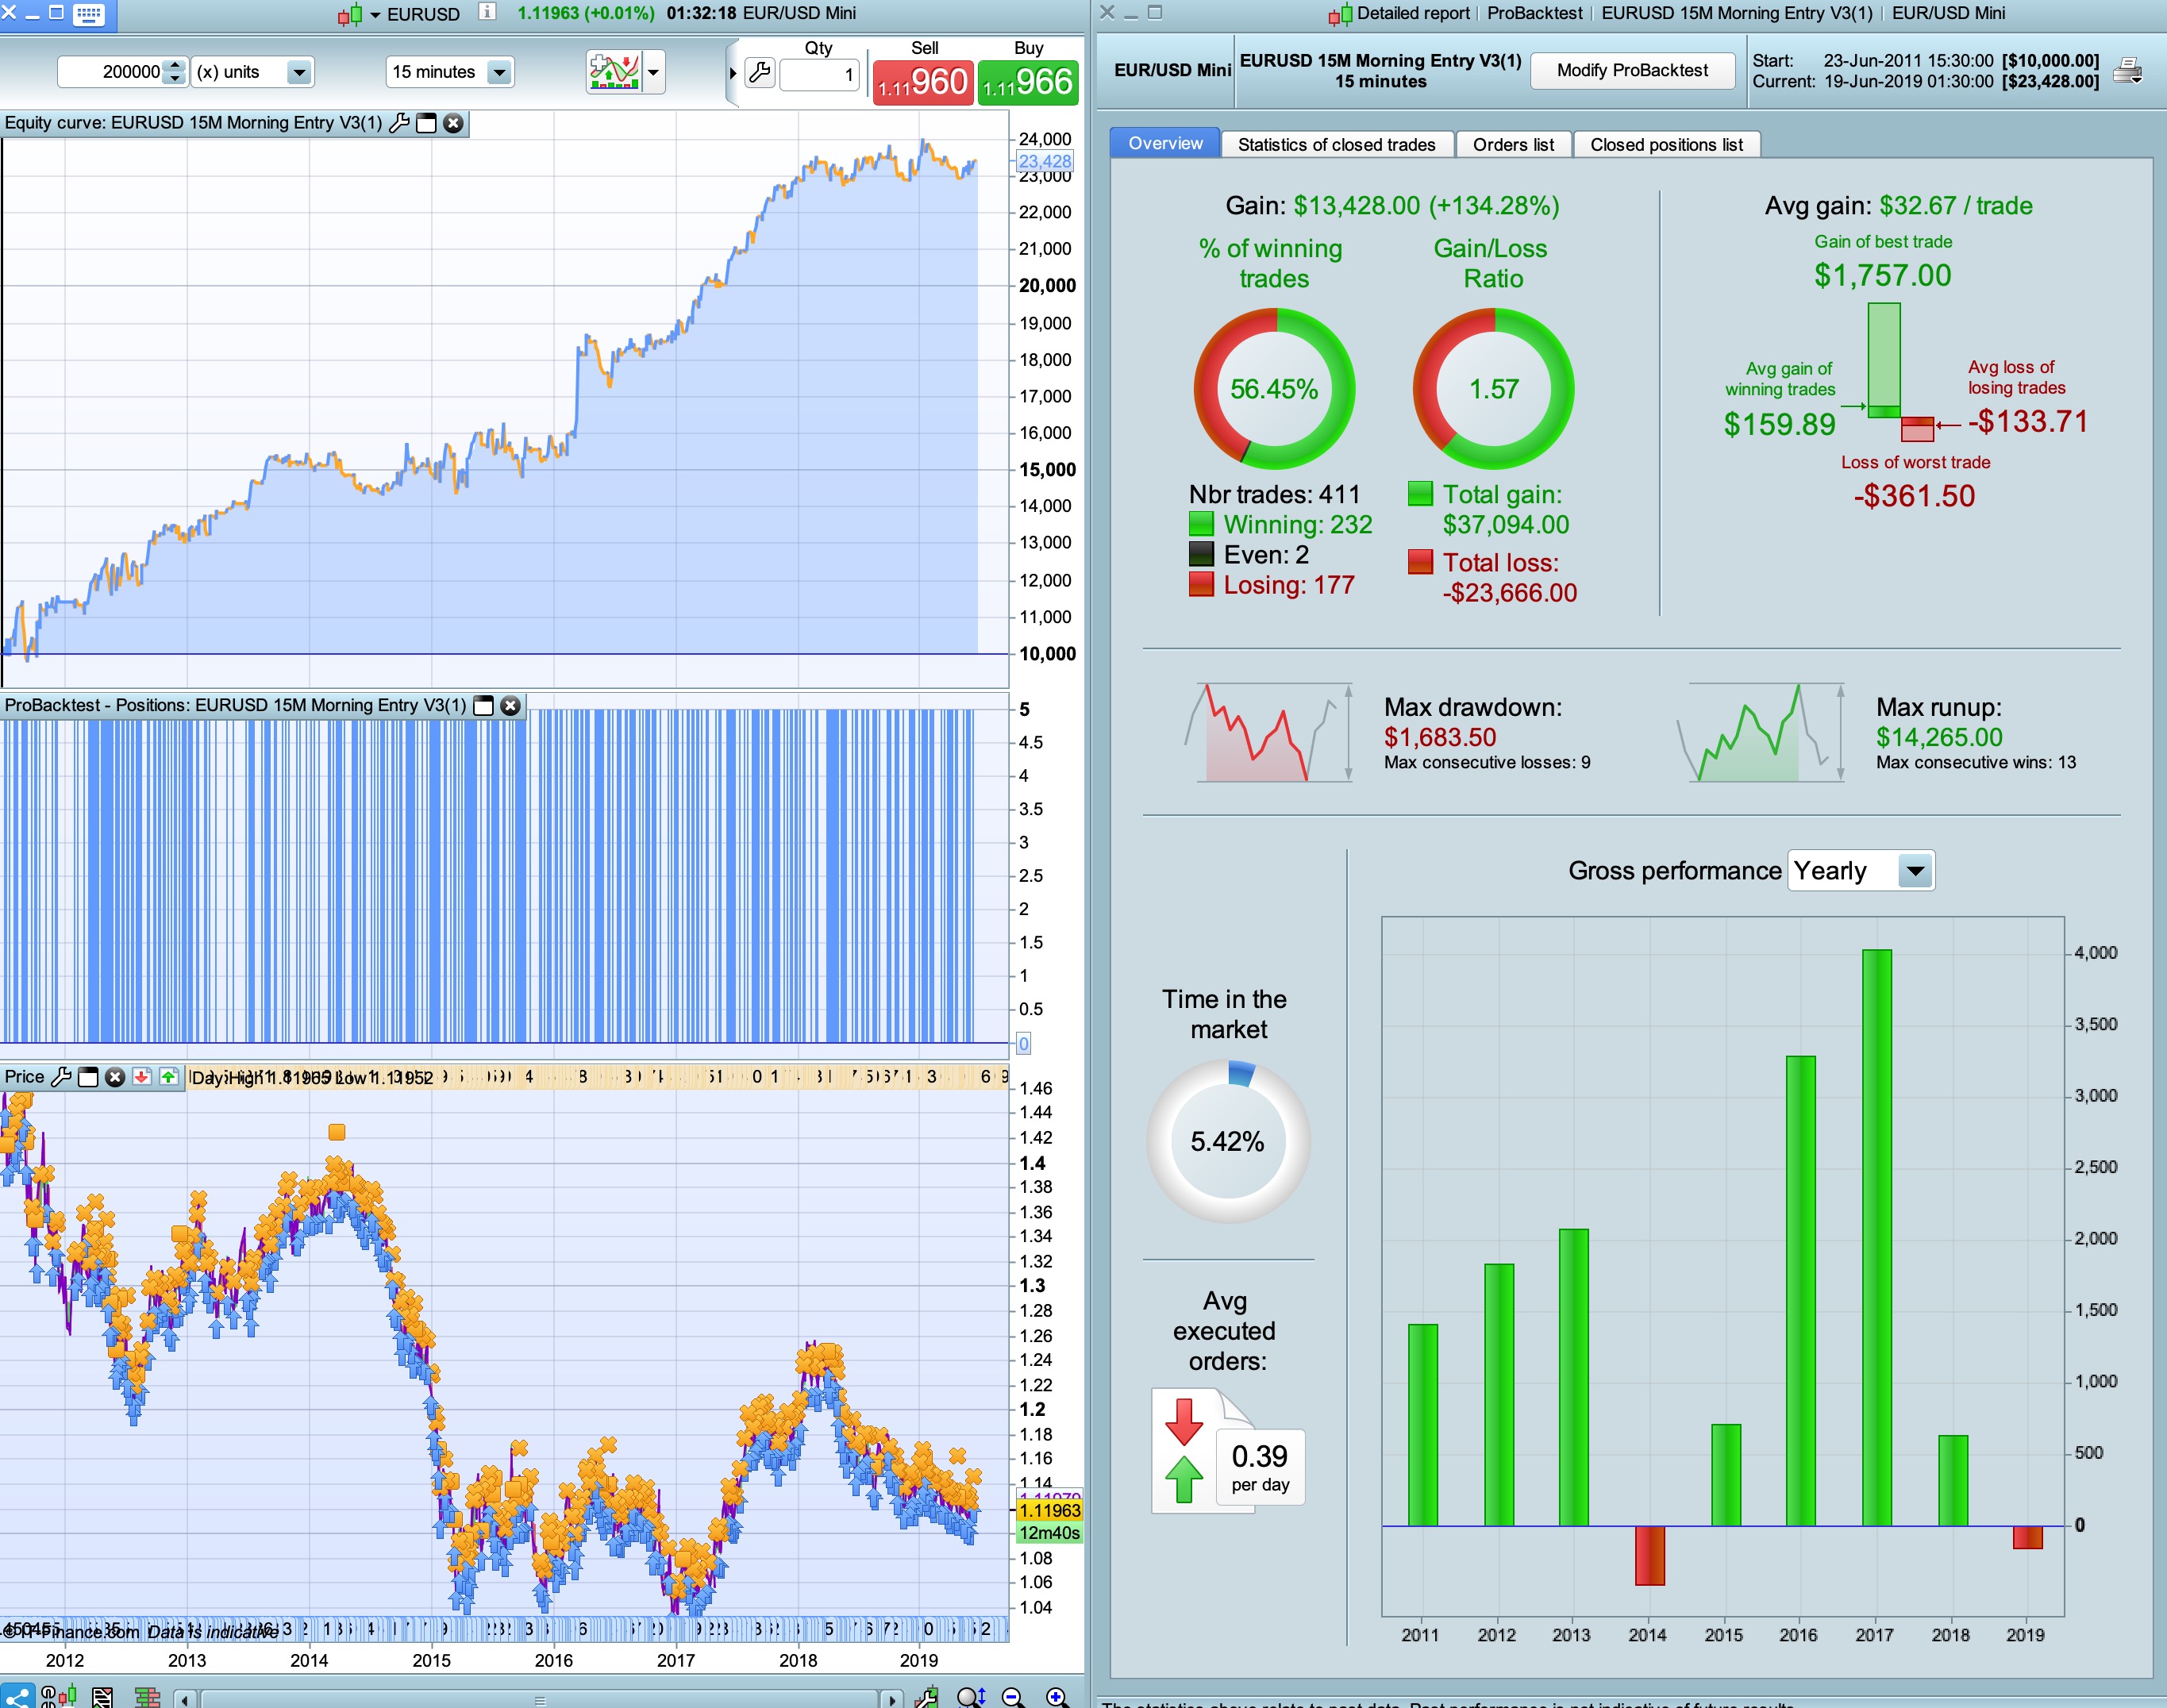
I modify the Flatafter time to 180000 and the sellshort time condition < 124500 instead of 130000
//EURUSD 15M Morning Entry
//15 MIN
DEFPARAM CUMULATEORDERS = false
DEFPARAM FLATBEFORE = 100000
DEFPARAM FLATAFTER = 180000

positionsize=1

if intradaybarindex=0 then
flag=0
endif

if time=140000 then
level=highest[2](low)[1]
endif

bu= BollingerUp[20](close)
bd= BollingerDown[20](close)
ba= (bu+bd)/2
br= (bu-bd)

c1= close < dopen(0)
c3= level > max(dlow(1),dlow(2)) //dlow(1) and level > dlow(2) (same result)
c4= (dclose(1)-dopen(1))/dopen(1)*100<0.65
c5= ba<ba[1] or high > bu[1]

if c1 and c3 and c4 and c5 and time<124500 THEN
sellshort positionsize contract at market
endif

pp=positionperf(0)*100

if shortonmarket and time=141500 and pp<0.40 and low>bd then
exitshort at market
else
if time> 141500 and pp>=0.15 then
flag=1
endif
if flag=1 and br<br[1] and br[1]<br[2] and br[2]<br[3] and br[3]<br[4] then
exitshort at market
endif
endif

SET STOP %LOSS 0.4
set TARGET %profit 1.5
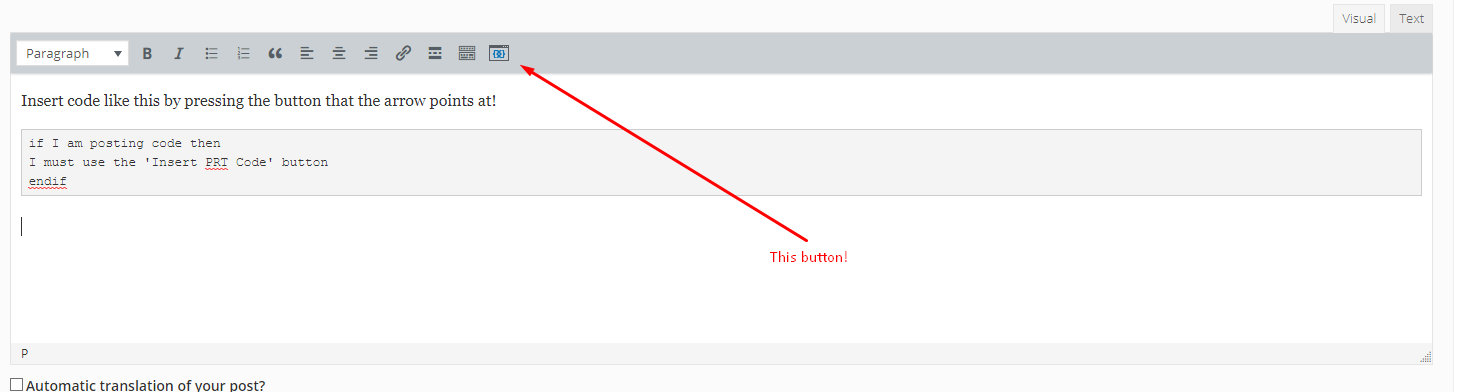
Lifen – Please use the ‘Insert PRT Code’ button when posting code as it makes it much easier for others to read. I have tidied up your last post for you. 🙂
It looks like you did not use the tick-by-tick mode, since 8-year data history for a 15-minute TF is way too much.
I suggest that you tick that box and backtest again.
Vonasi : Thanks for your help, well noted for next time
Robertogozzi : the strategy has been tested in “tick by tick”, 200kbars and spread 1
Robertogozzi: This is 200k with “Tick by Tick”
i have 8 Year history data on 15 min TF.
But i do not have same profit as “Liften” with size 1 contract.
PaulParticipant
Master
@Barney Your are looking a the the eurusd mini, Lifen at the eurusd.
PaulParticipant
Master
Hi, I got a few questions.
1st.
I’am a bit unsure about the tick-by-tick box. It doesn’t make a difference if it’s checked or not, even when you select 25 units of 15 min to display.
If it doesn’t take tick-by-tick into account when backtesting, when using a conditions with close as parameter it’s useless because that changes throughout the bar in live trading and so it can flip-flop during 15 minutes?
If that’s the case; open, high and low are usable as condition without tick-by-tick data?
2nd;
If using not onmarket or to check if shortonmarket, it slows backtesting down.
The end-result in backtesting is the same when used or not.
That’s mainly because of cumulateorders=false.
So I believe it’s not needed to check the condition of the market when live trading the way it’s coded now. Is that correct?
Thanks.
last thing though
The position-performance was included before, but it didn’t seem necessary for the end result.
I removed it and got rid of 2 values which normally would be optimised.
Flat-after time decides a bit the drawdown between
Hi Paul,
I don’t have the answer to your questions but I have made a few test with your strategy.
My conclusions:
– Shorts are performant because since 2008 EURUSD is in a long bearish tendency. Strategy is less performant in bullish trends like in 2017.
– On your last screenshot we can see that annual performance is decreasing. Maybe it is a sign that the bearish tendency is slowly ending.
– The trading hours impacts a lot the strategy performances. For short trades 10 to 14 seems the best period. For long trades I got interesting results between 18 to 20 or between 23 to 5 o clock (with increasing night cost!)
– During Ranges or Uptrends the equity curve is flat during long periods. Condition c5 with Bollinger Bands seems to improve performances. Testing another volatility indicator may do better.
– Condition c1 and c2 don’t improve performance.
PaulParticipant
Master
@Magifina Yeah it works less in a bullish market, but still profitable.
But this year is on track for a good result. Only halve way yet!
I tried to find for long trades the best times and started blank.
My finding after optimising the best time to go long is at 14u sharp and close at 21u. (flexible)
Optimised a few conditions. Quickly got result worth digging further. No BB yet.
//EURUSD 15M Afternoon Entry LONG
//15 MIN
DEFPARAM CUMULATEORDERS = false
DEFPARAM FLATBEFORE = 140000
DEFPARAM FLATAFTER = 210000

c1= dopen(0) > dclose(1)
c2= dopen(1) > high

if time=140000 and c1 and c2 THEN
buy 5 contract at market
endif

//if time = x then
//sell at market
//endif


SET STOP %LOSS 0.5
didn’t had the time to come back, because I’m busy with coding a DB/DT indicator, but will look at improving further the strat asap