To generate interest (quiet on here lately) would members like to post their equity curves of results on real-time data (can be on Demo Real Live) ?
Results posted need to be in the same format for all, else it will be near impossible to compare between curves.
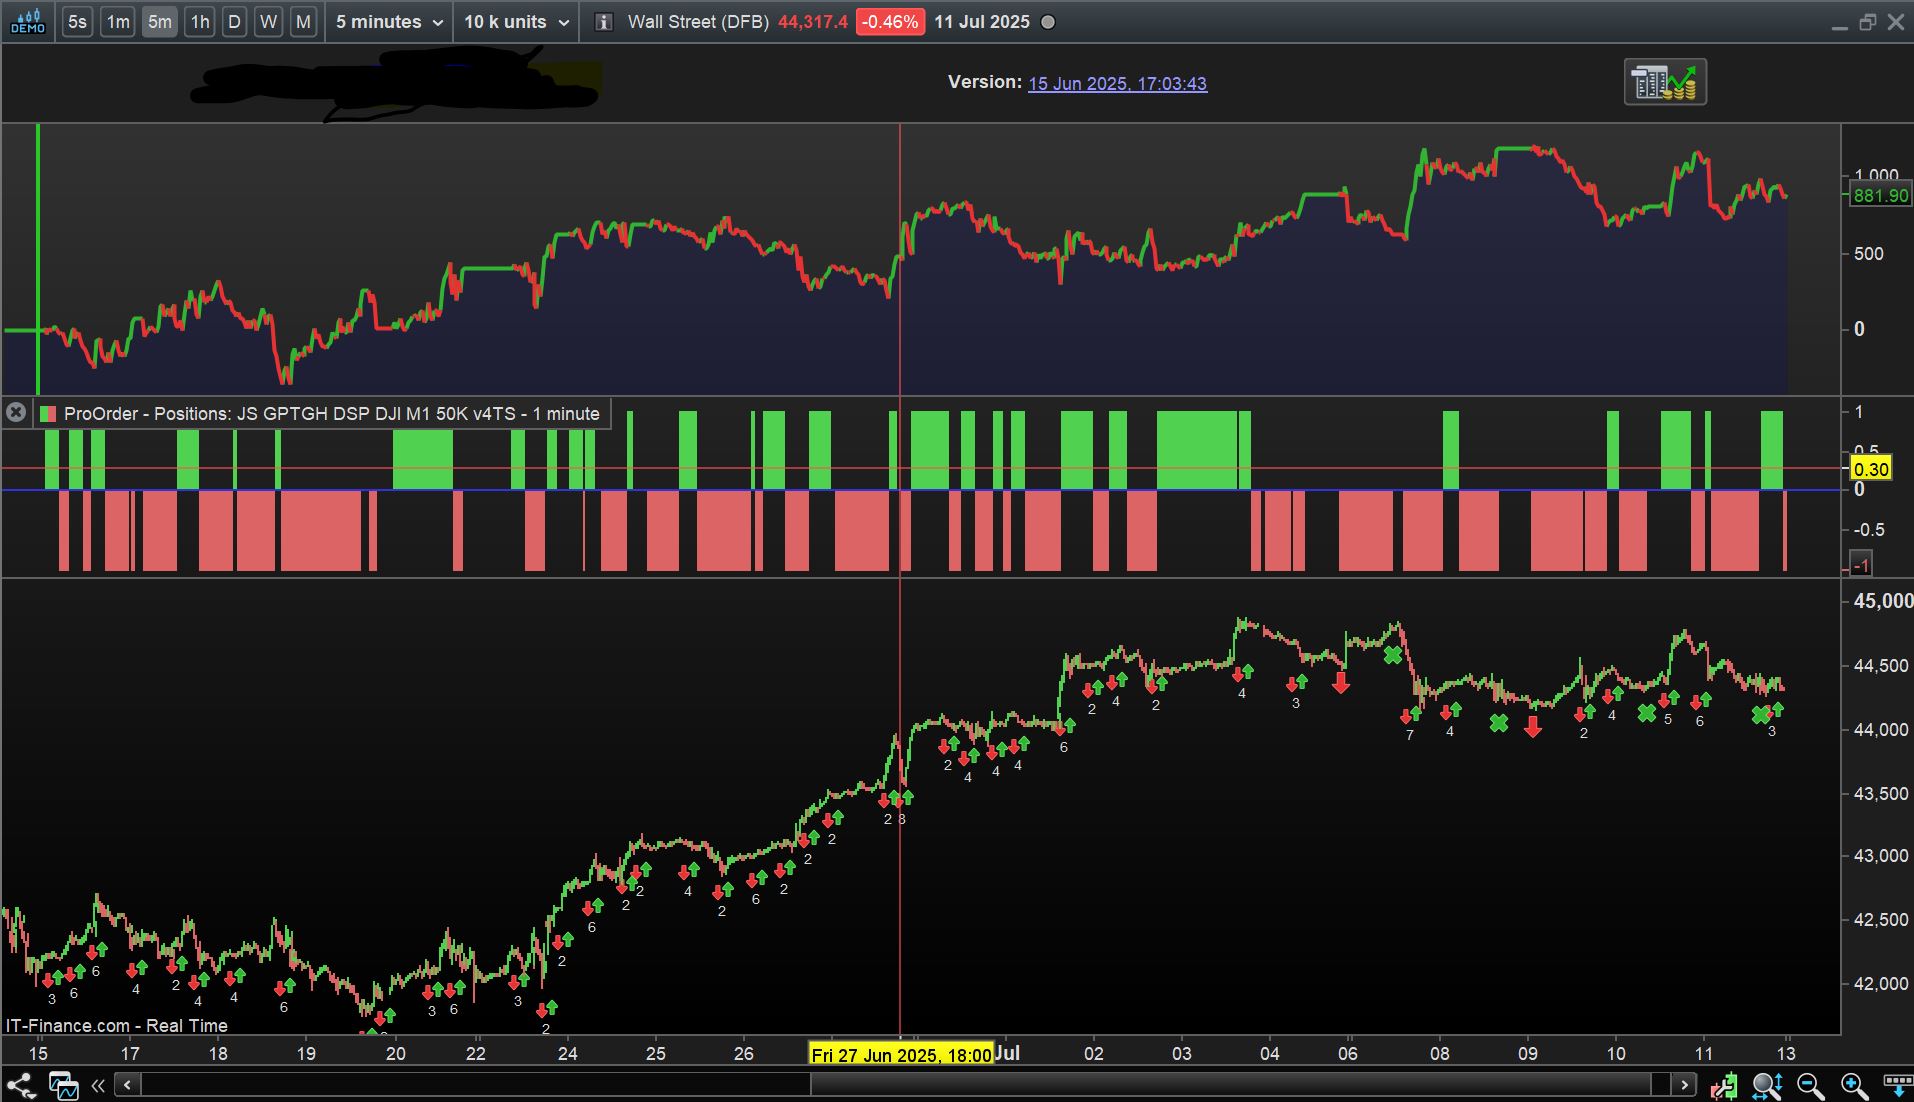
The format is 5 min TF over 10k units / bars … this shows the most recent 1 month trading. Also to include positions with full layout as specified below. It can be any Instrument, but needs to be …
- TF = 5 mins
- Units = 10K bars
- Include positions under equity curve
- Include Price Curve under Positions
- Show Platform in Top Left Corner (e.g. my curve in next post shows DEMO)
- Show Date on scale along the bottom and also show values on right-hand scale.
It’s easy to change TF from 1 min to 5 min or 1 hour to 5 mins etc on your equity curve results on Live data so that you comply with above.
MarketPlace Vendors can also post on here as long as they comply with above Format 1. to 6.
We need a way to show that equity curves are NOT from Backtest data … anybody any ideas?
Any questions, feel free. but let’s keep it simple … no heavy / long text posts etc?
I’m not saying attached is my best Curve; if better are posted then it will motivate me to find a better curve (out of my 100’s of tested Algo’s).
Apart from encouraging Community Spirit, part of the idea of this Topic is to facilitate benchmarking the performance of our own Algo’s to that of others on here … hence Format 1. to 6. (see above post).
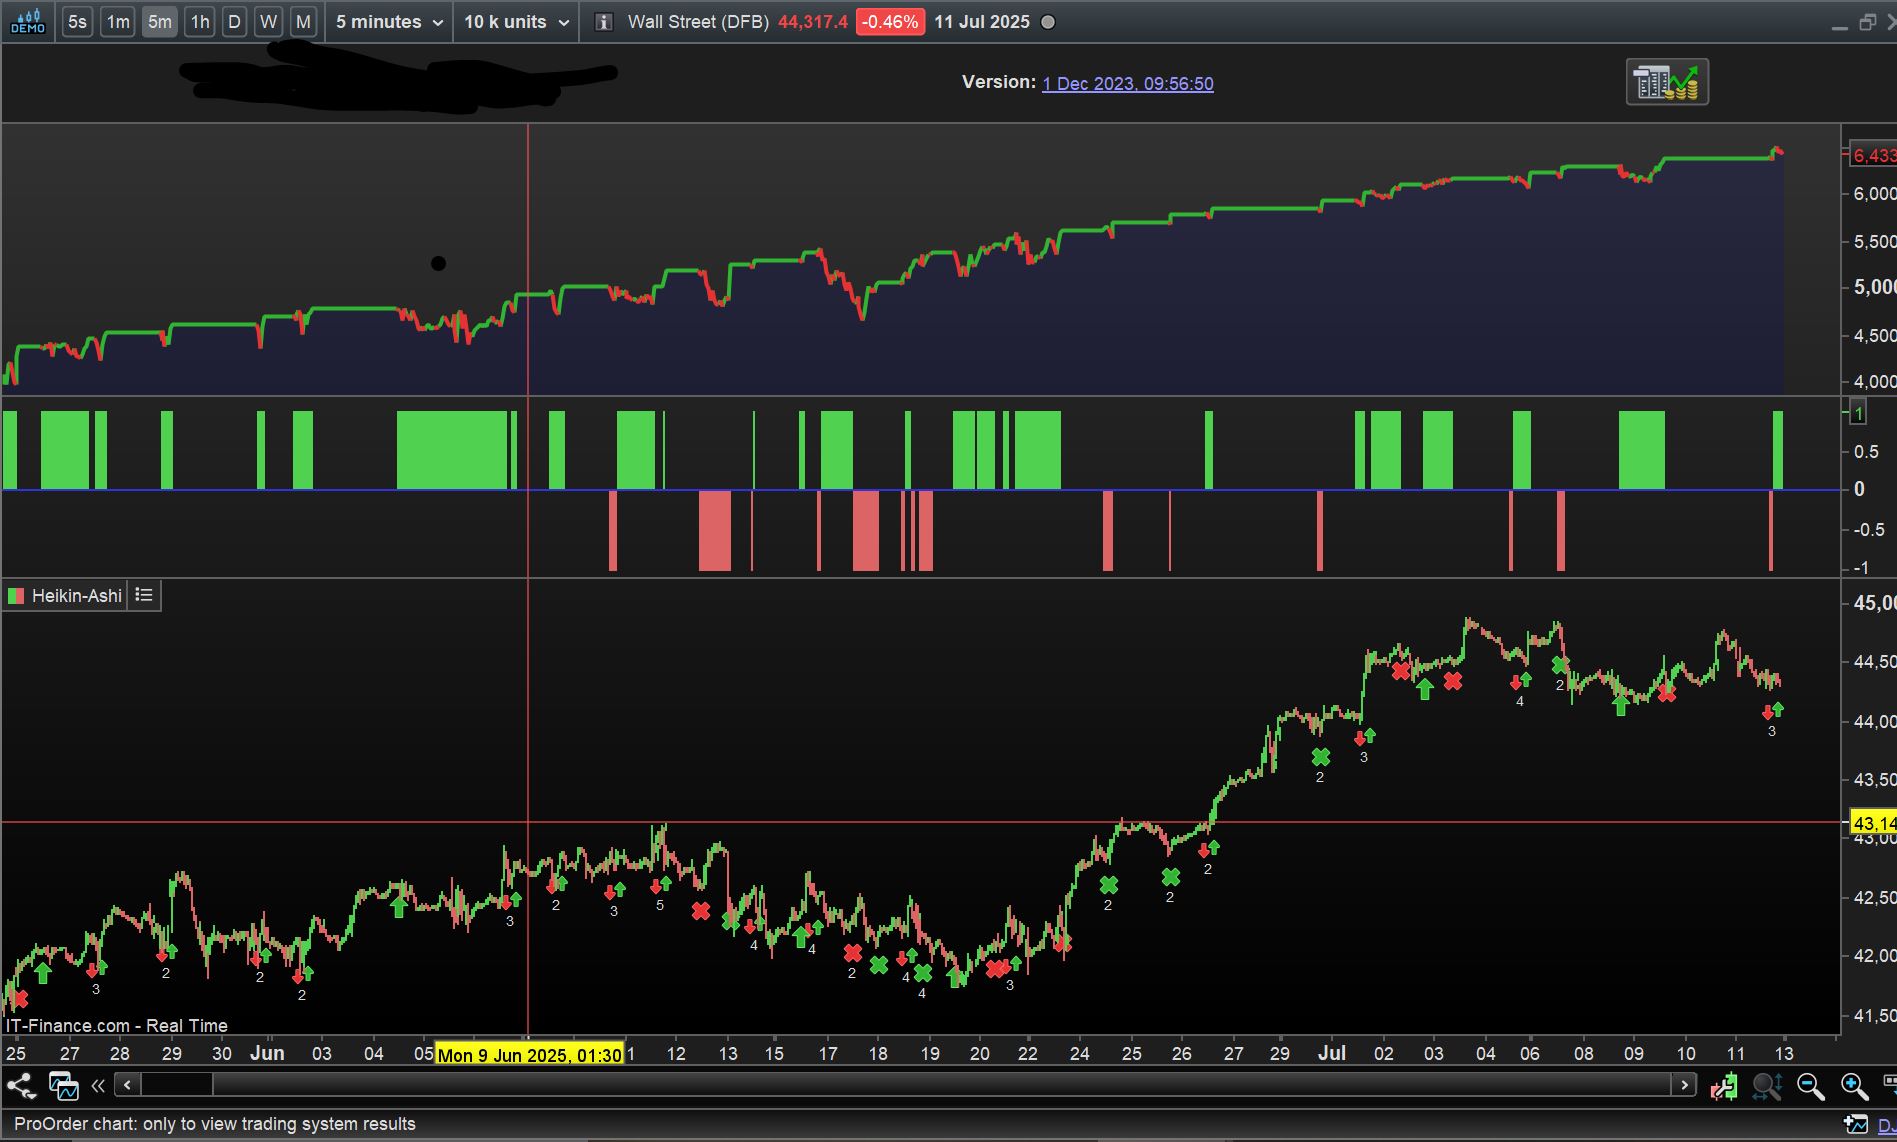
Attached has been running longer than 10k bars @ 5 min TF so – for comparison you can see from right hand scale – the equity curve starts at around £4k and is £6.4k on Friday 11 July 25.
Aha … I’m 95% sure I have spotted 2 ways to see if an Equity Curve is a result of a Backtest.
I won’t draw attention to these 2 ways now … there would be no point in a Community member trying to deceive others for the purpose of this Topic (Benchmarking)?
A good idea to revive the now nearly dead forum, but why limit it to just 5 minutes?
You could set any time frame, but starting from a specific date. That way, perhaps more people would be involved.
Okay fair enough, good point.
Despite looking on MarketPlace many times since inception, I always exit after a few minutes (feeling dizzy! 🙂 ) due to the many and various presentations that Vendors make of their wares. There needs to be at least one – easy to find – standardised method of presentation of performance on MP?
The aim of this Topic is, in part, to address the above Issue with the hope that MP Vendors will post their Equity Curves here.
I am always more interested in recent Out of Sample performance as markets change so quickly these days.
So after me rambling on, the question is …
Do you think the most recent 4 weeks (can be a few days + or -) is a good idea?
why limit it to just 5 minutes?
1. TF = 5 mins … does not mean that posted Algo Curves have to run on 5 mins.
It is easy to select 5 mins – to convert a 1 min Curve of results to display 5 mins TF or 1 hour to 5 mins TF etc – but I guess you knew that?
As for the starting date, perhaps it could be open for at least a month until January 1st of this year. Perhaps someone can demonstrate good performance for a longer period.
As for MarketPlace, I’ve looked at it often, too, but a quick look immediately reveals some who only show backtests, or worse still, only profit figures, or not even that, and claim to be making thousands of euros. Then there are those who show live results; just look if you’re only interested in those.
Standardizing everything this way would be great for those who want to buy, but there would probably be few sellers left.
My first remark would have been that 4 weeks could already be too much. Why ? who says that the current System is running that long ? So personally I think 4 weeks is fine (but or I have them running from of June 19, or I stopped others at that same date – so literally I can’t comply already.
Next up would be my practicing with one system out of many for one instrument – this is IG. But I can’t start PRT for IG today … (“Unexpected Error”).
N.b.: Why people would hold back in the necessity to change the TF of the chart to 5 minutes, is a bit beyond me ? it won’t change the trading for the already running system ?
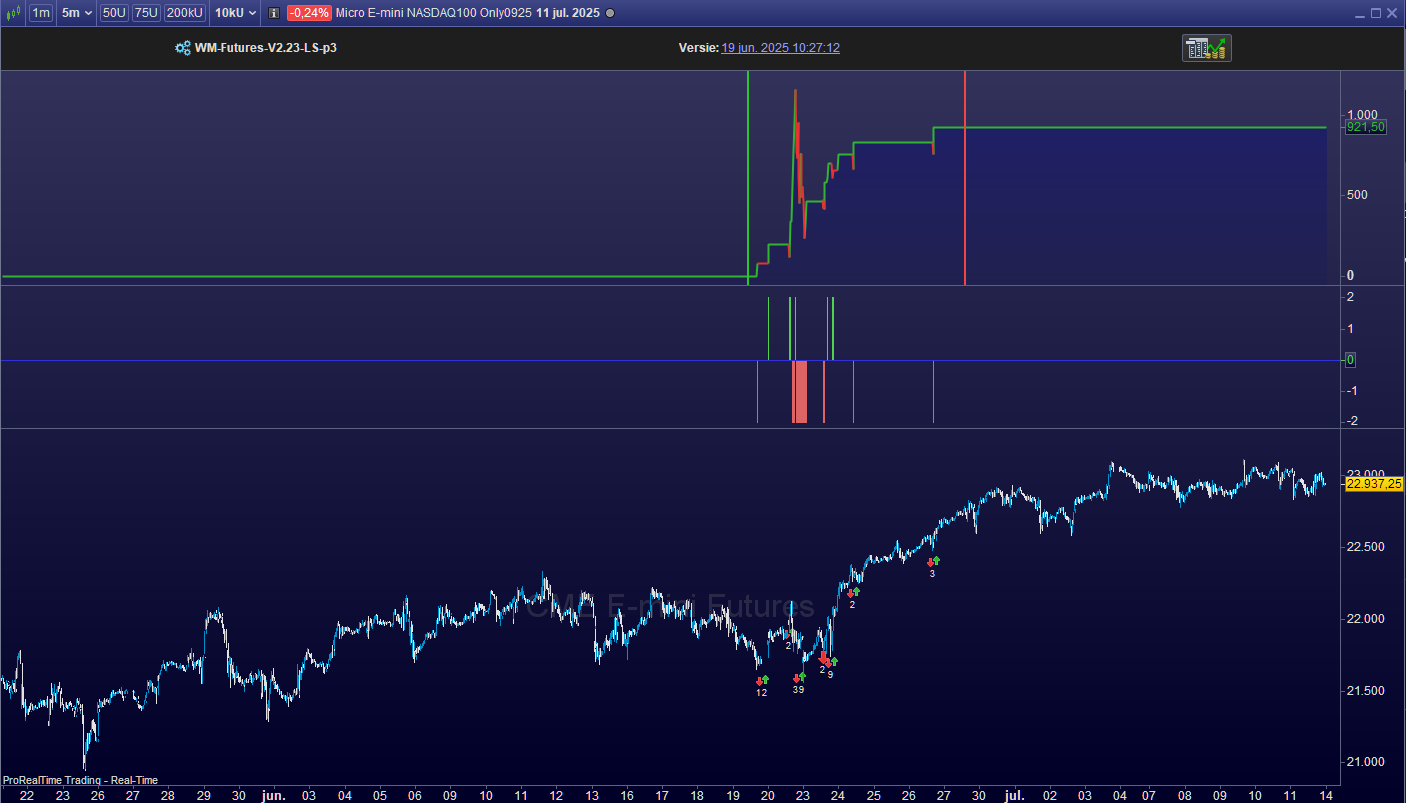
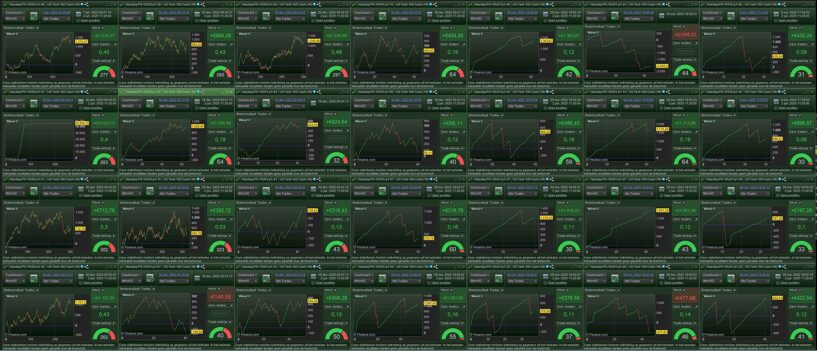
Another issue you see below; real futures would not be able to comply throughout because they expired on June 20. They will comply (to the 4 weeks) again after next week, if only the System was restarted for the new (Sept.) contract. But that is IB (though in IG it could exist for some just the same). Anyway, this IB example fails because the period that particular system ran was shorter than the required 4 weeks (or better : the 10K bars). See the green and red vertical bars. Meanwhile I have running systems always, but that is thus different than one system running always.
I hope this makes sense ?
Anyway, I now see that I like your idea. Every Market Place vendor should comply to this. Here’s another one from me (from IB). This one is still running (so-so).
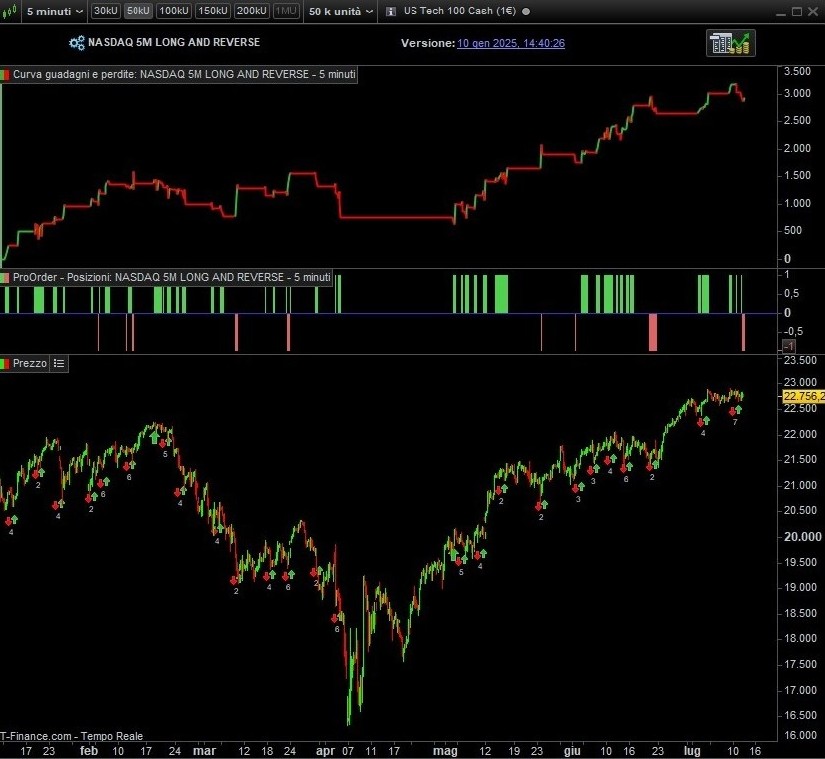
This has been in use with a 5-minute time frame since January 10, 2025……I would say it has also well overcome the collapse that occurred from mid-February to early April.
N.b.: Why people would hold back in the necessity to change the TF of the chart to 5 minutes, is a bit beyond me ? it won’t change the trading for the already running system ?
It could be that they have never changed the Display TF from that in which the Algo is running on ProOrder?
Okay so let’s leave TF = 5 mins and display period as 4 weeks-ish / 10k units … for now anyway. If enough want a longer display period and / or TF then we can reconsider.
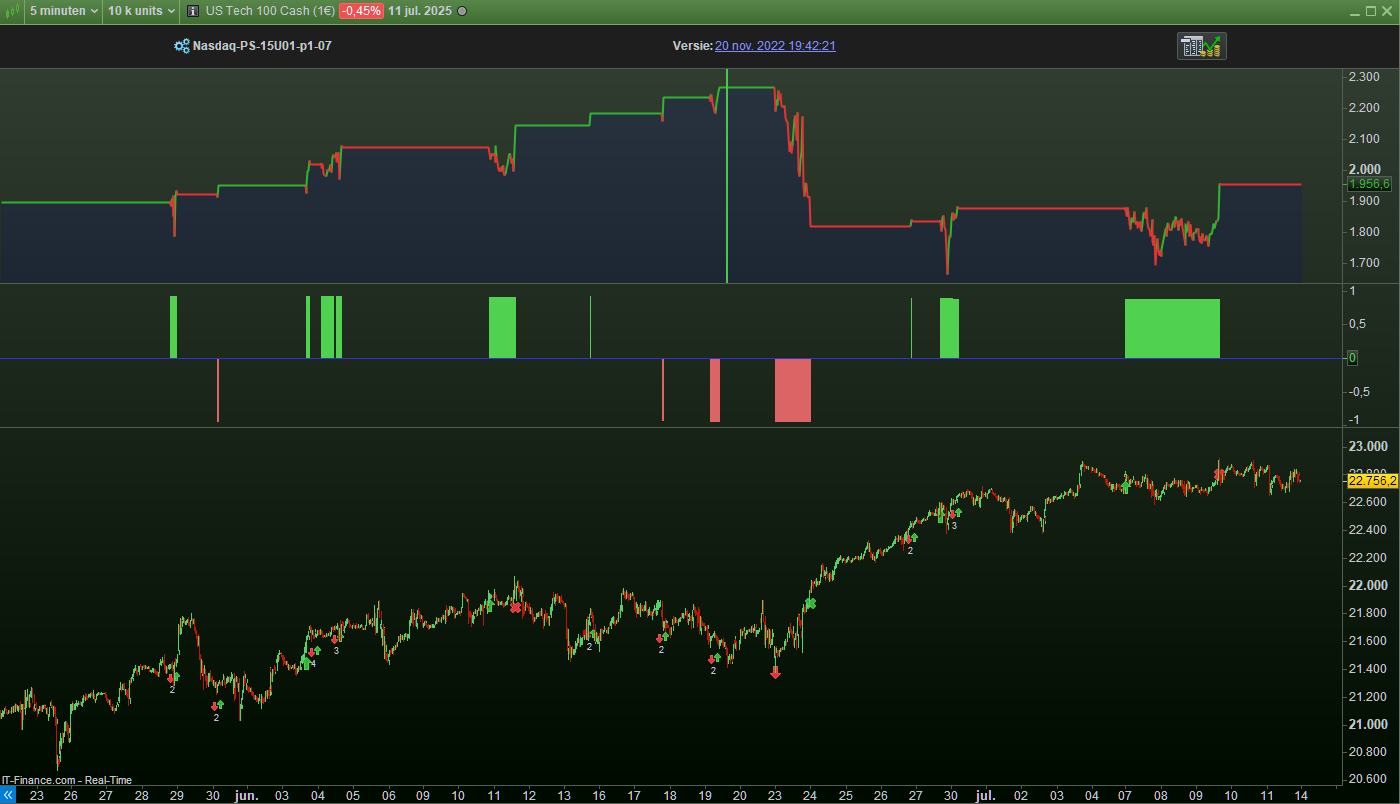
PRT-IG works again for me, so here is one result. But it again shows a “situation”, because see the green vertical line – this was started on June 19 once again, but now because it was thrown out by the IG quirks. Otherwise it shows nicely what it did the past month.
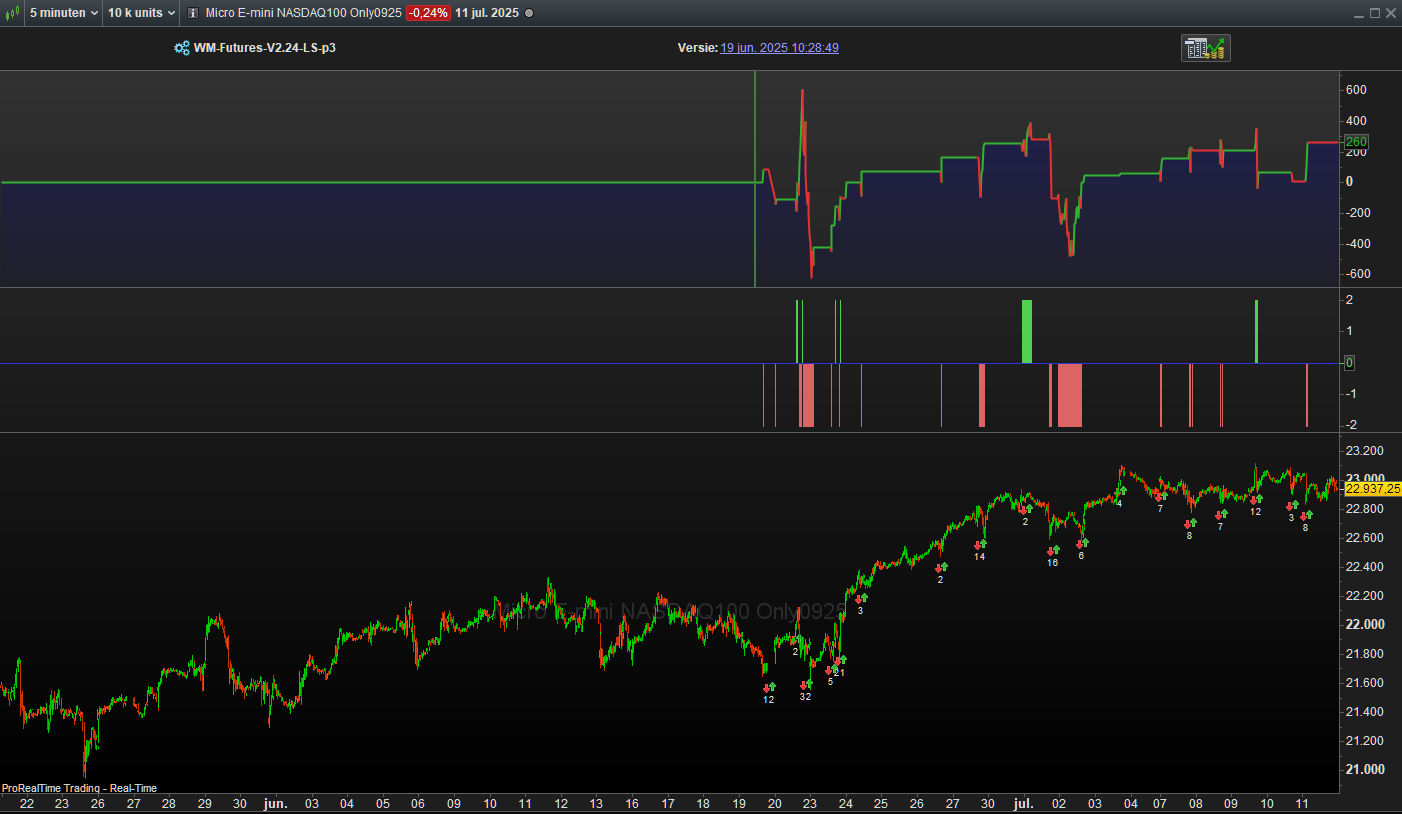
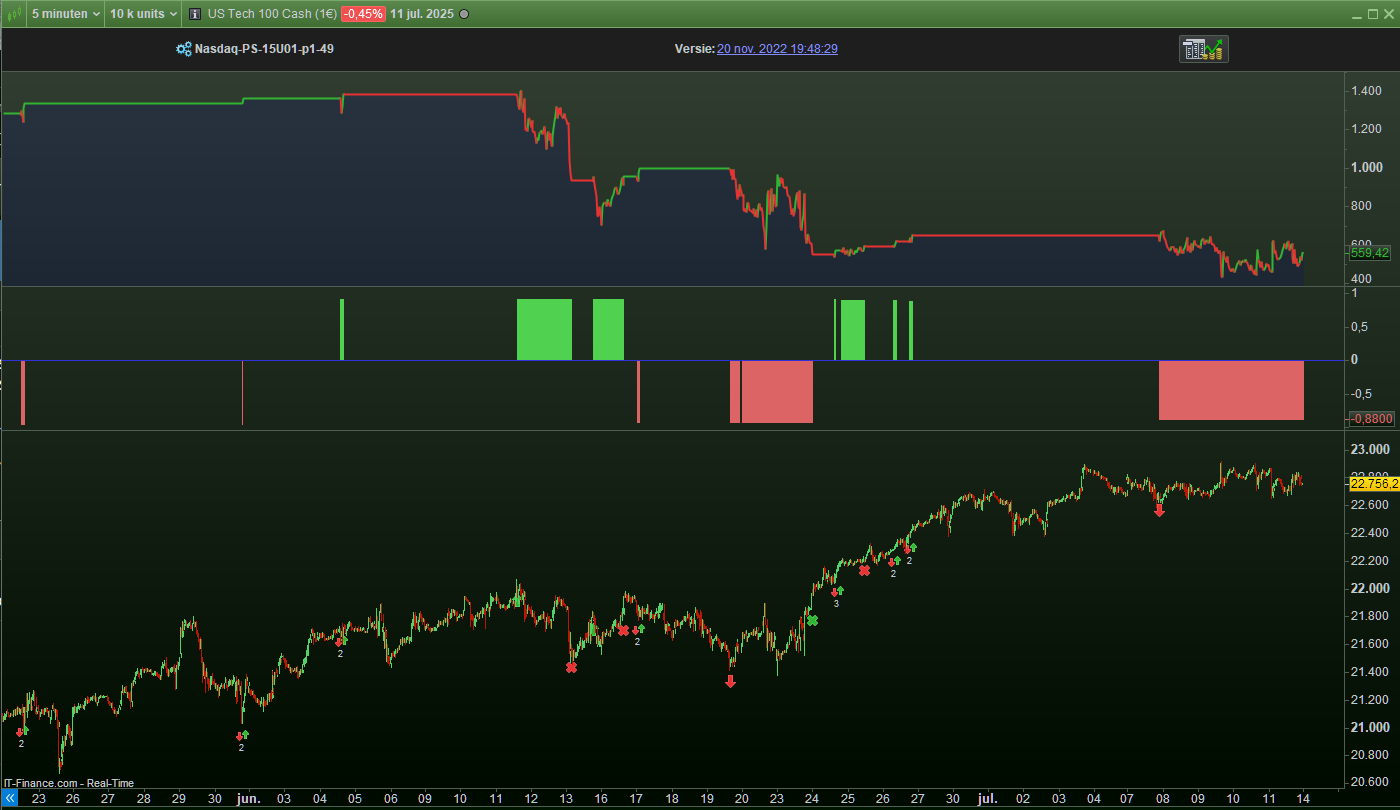
And another example, again with a slightly different story.
This one runs from of April 1 2025, and was reactivated with quite many others, “feeling” that the market would be right for them again, after being dormant for maybe a year because the market turned against it/them (you can see that net it still makes profit).
Now, currently I have 5 more of these (2 with loss, 3 with profit, but it is going to be more of the same so no need to show those I think. Would you have asked before June 2, then I could have shown you each of what you see in the 2nd attachment. If you look hard in the top left, you can see that this is still Real-Live (as you are aware, I don’t use Demo).
Anyway, I stopped all these somewhere in the beginning of June, to give way to some “larger projects”.
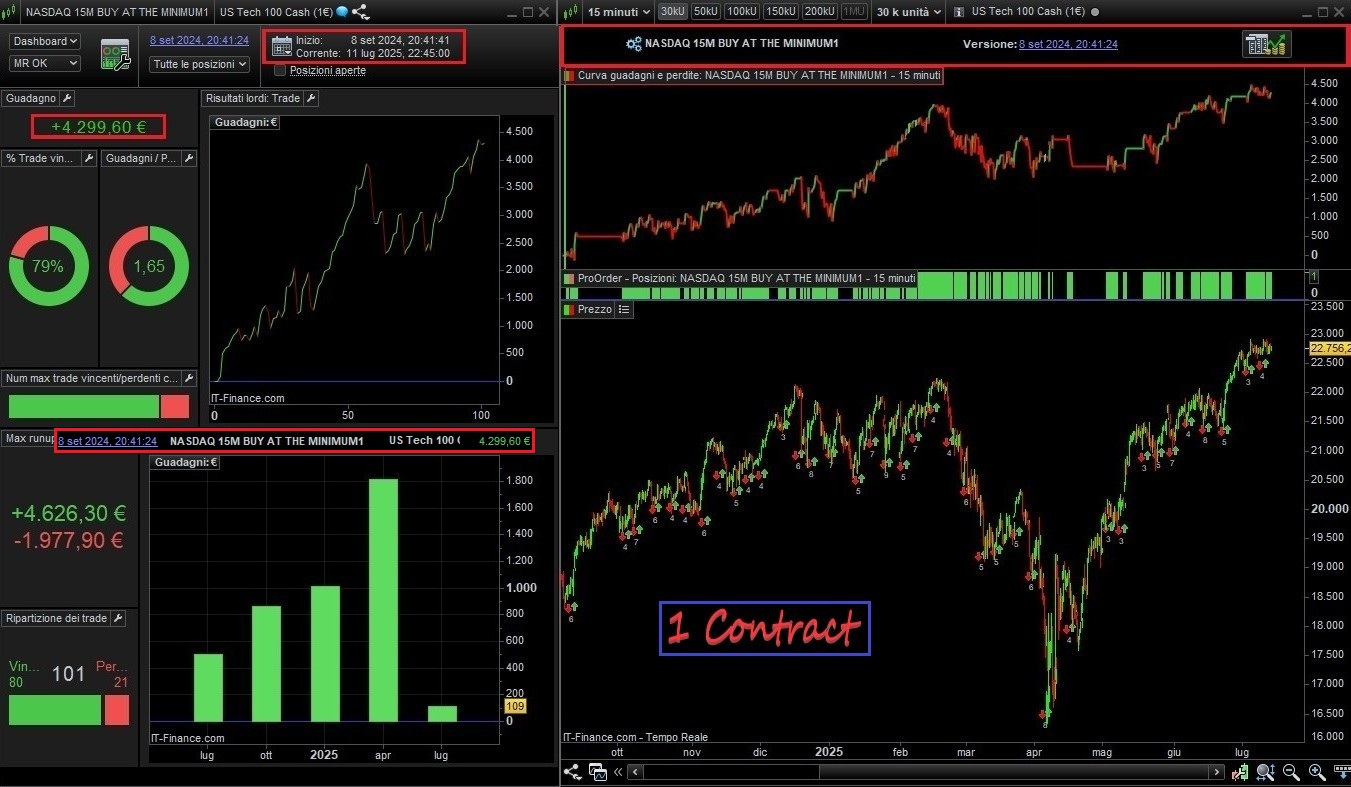
This is another example, but with a 15-minute time frame. Unlike what was written above, I believe an algorithm must work for a long time in all market conditions, even the most extreme ones, as in mid-February.
I included this example (this time, unlike the previous one, it’s in the store) since the request was that Market Place sellers should adapt and display charts this way.
Mauro T. “Algorithm System”