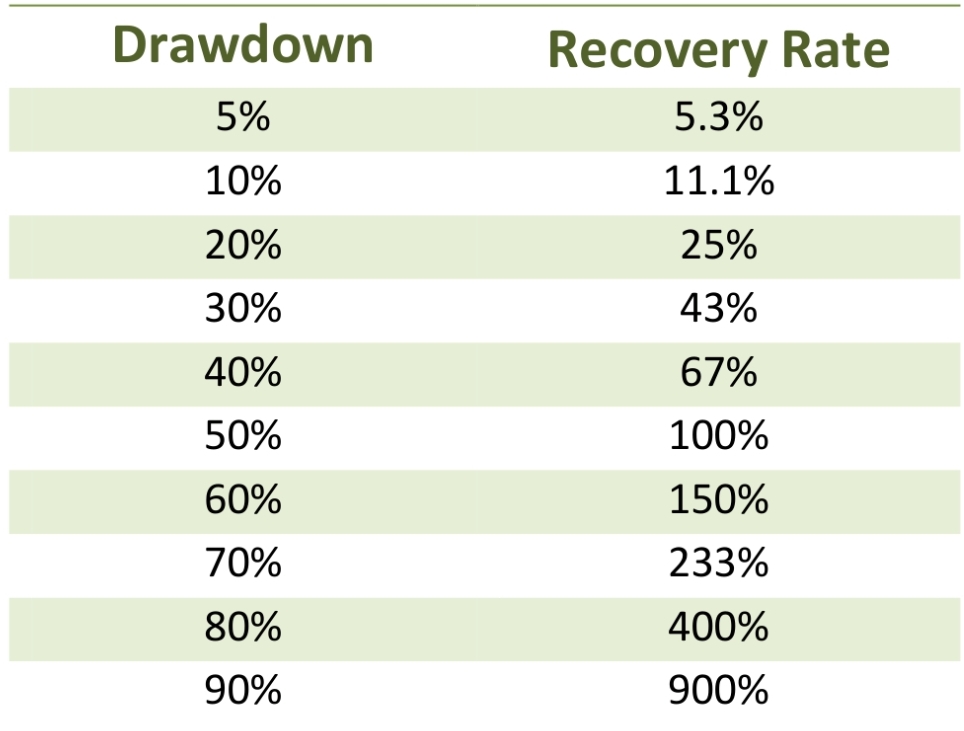
I think you know all that it takes a 67% increase on our capital to recover the 40% drop, Even if the strategy with 40% draw down and positive it’s still a shame to lose the 40% you had won
The next step would be to use stop followers and maybe also to improve the Take profit with this thread
If you have other ideas or other contributions I’m interested, the goal is to improve the code a bit and especially for me and to improve myself in programming and why not for some beginners and the community
Let’s go with a first improvement that is not really an improvement, the Hit & Run, as you can see on the original code the setting value of TP and SL is :
// STOP LOSS & TAKE PROFIT (%)
SL = 1
TP = 0.8
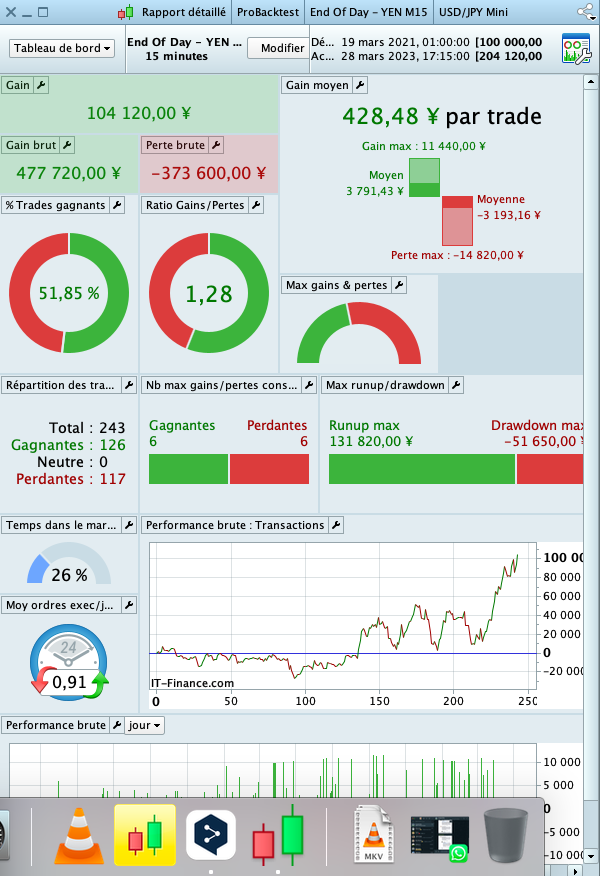
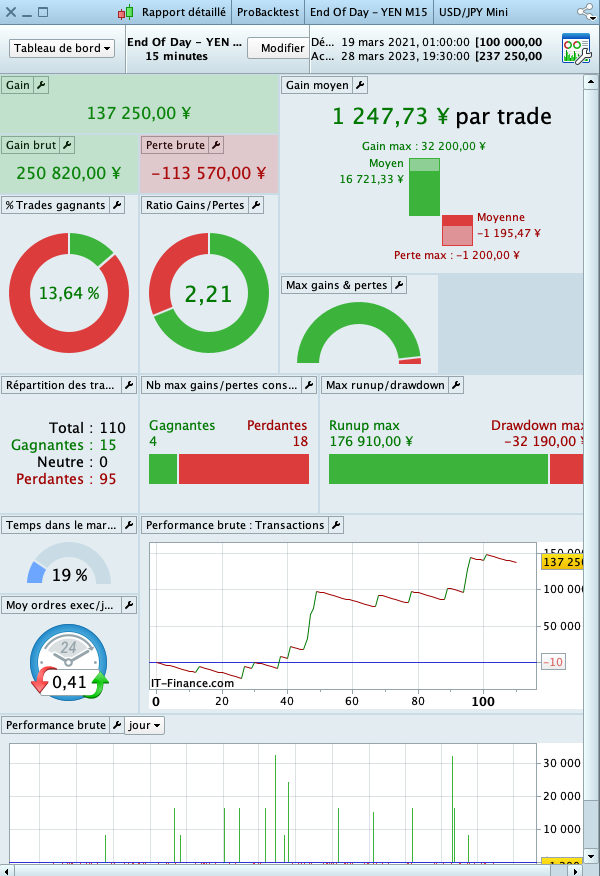
with this value we are from 100K to 204K JPY
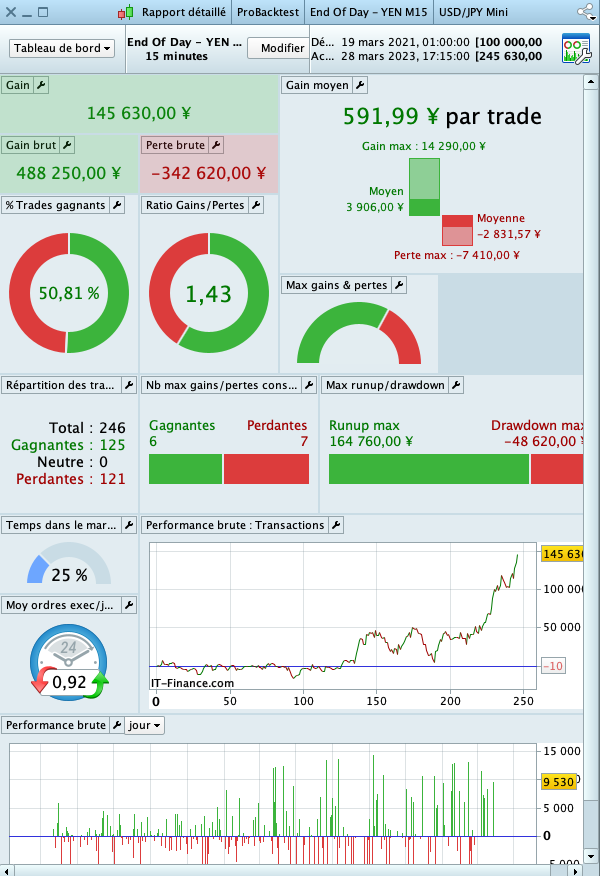
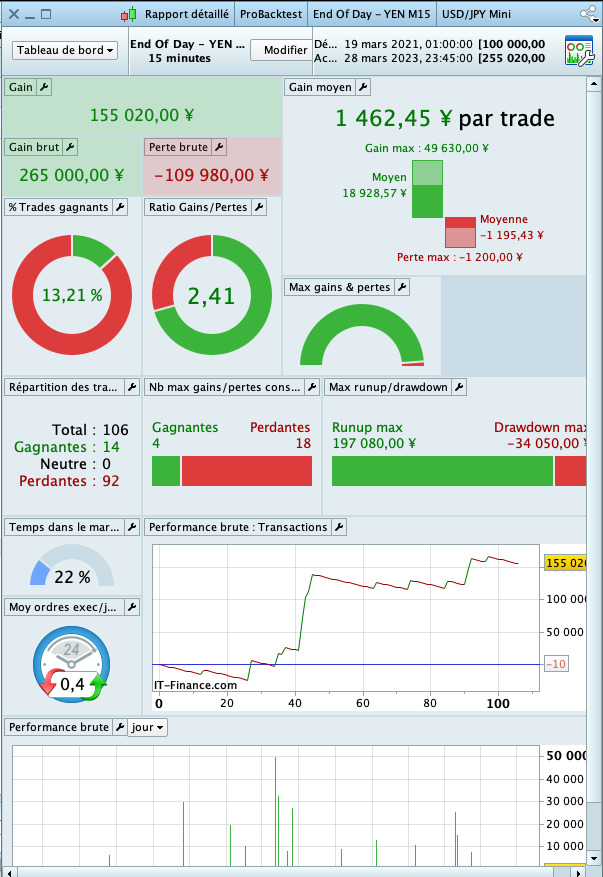
but with just reduce the SL from 1 to 0,5% of the trade and increasing the profit from 0,8 to 1% we are from 100K to 245K JPY
Let’s go with the second improvement :
– I reduced the code and remove some code (maybe stupid condtion for try to ride the position, I will come back to this next time)
– at this time I use only Long position, because if I’m not wrong it’s not possible to be Long and Short in he same time with the same code (I on’t know if it’s possible to be long and shot in the same time with 2 different algo on the same stoks with IG ?)
– I add some trule even it’s not perfect for magane the SL
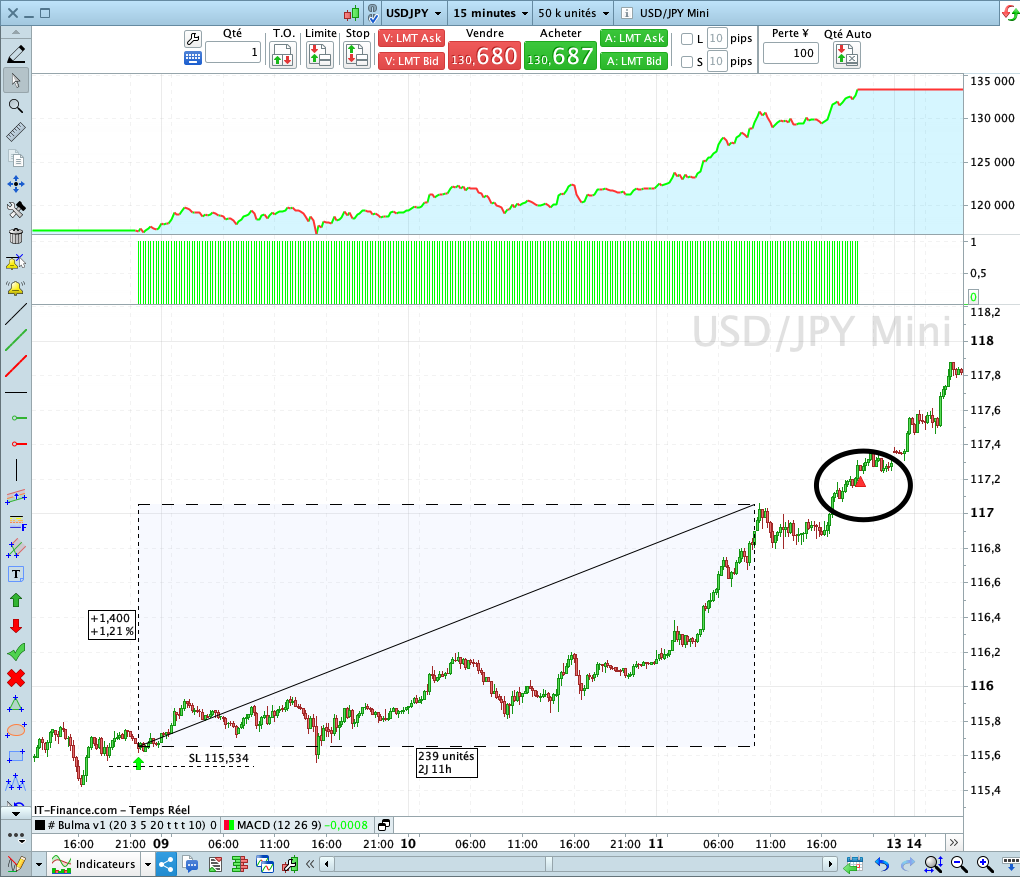
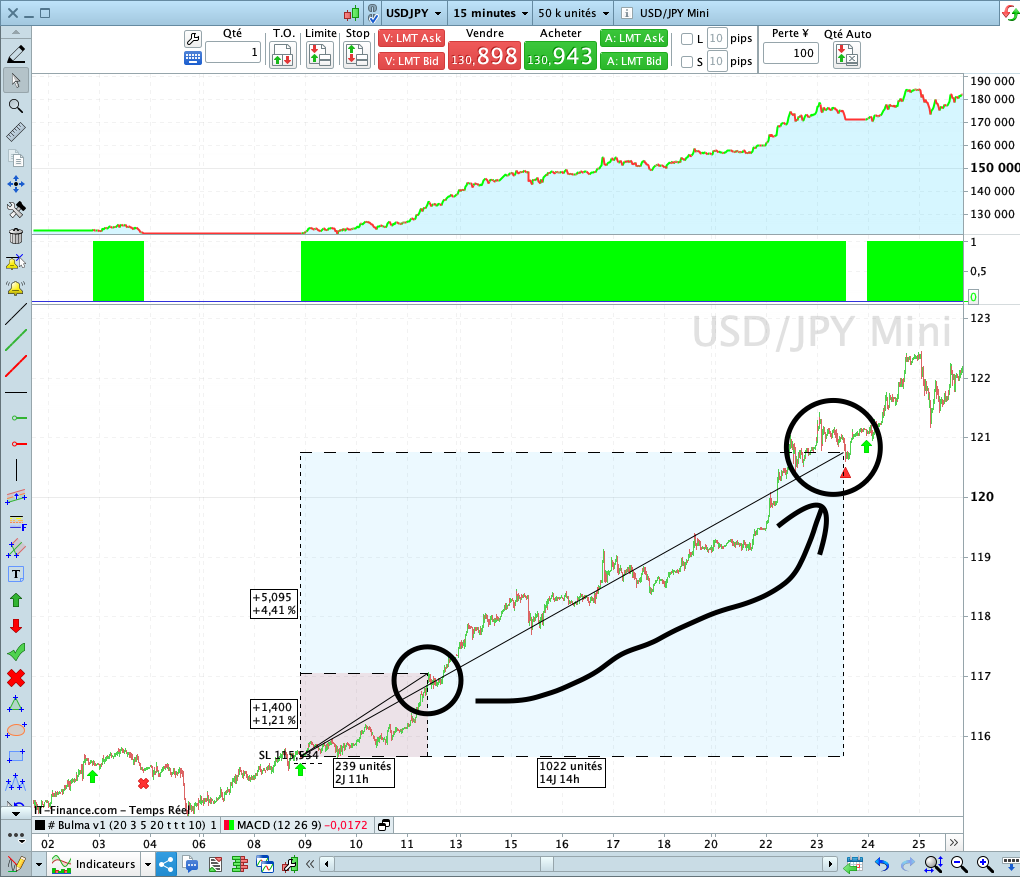
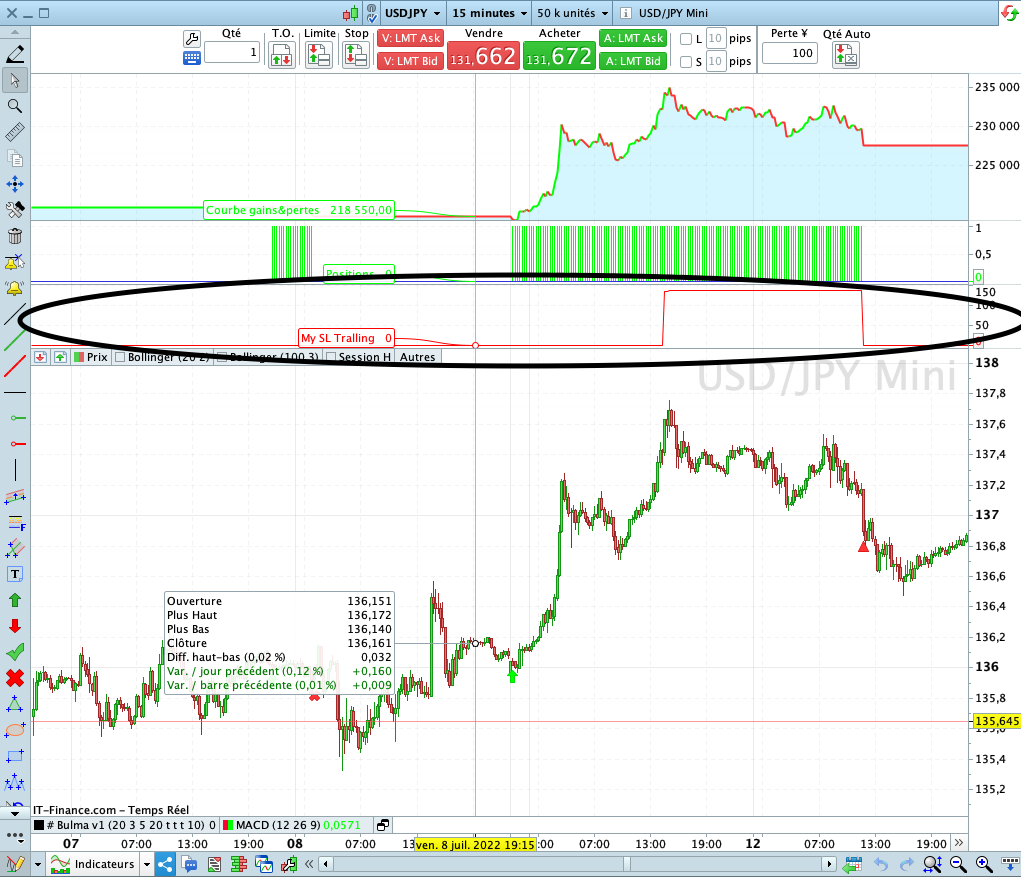
My question is : Why the algorithm takes me out of position at 9pm ?, You can see on the screenshot the output is represented by a red triangle
// Strategy Name    : END OF DAY  -  YEN
// Version          : 2.0
// Information      : I don't know what is this Strategie means ;-)
// Stroks           : USD/JPY Mini
// Initial Capital  : 100 000 JPY
// Test on          : 50K Candles
// Spread           : 2
// ============================================================

Defparam cumulateorders = false
Once Capital    = 100000

// SIZE OF THE POSITIONS
N = 1
Ratio = 0.5

// TIMETABLE
StartTime     = 210000
EndTime       = 231500

// STOP LOSS & TAKE PROFIT (%)
SL = 12
Period = 12
Spread = 2

// CANDLE REFERENCE to StartTime
IF Time = StartTime THEN
Amplitude = Highest[Period](High) - Lowest[Period](Low)
Opening = Close
ENDIF

// LONGS & SHORTS
IF Not LongOnMarket AND Time >= StartTime AND Time <= EndTime AND DayOfWeek < 5 THEN
Buy N Shares AT (Opening - Amplitude * Ratio) Limit
ENDIF

IF LongOnMarket Then
Set Stop pLoss SL
ENDIF

trailingstart = 140 //trailing will start @trailinstart points profit
trailingstep = 80 //trailing step to move the "stoploss"
points2BE   = SL    //points to keep at breakeven = Set Stop pLoss 12

startBreakeven = 30
PointsToKeep = 5

IF NOT ONMARKET THEN //reset
newSL=0
breakevenLevel=0
ENDIF

//manage long positions
IF LONGONMARKET THEN
//first move (breakeven)
IF newSL=0 AND close-tradeprice(1) >= trailingstart * pipsize THEN
newSL = tradeprice(1) + Spread * pipsize // BE + 2 x Spread
ENDIF

//next moves
IF newSL>0 AND Close - newSL >= trailingstep * pipsize THEN
newSL = newSL + trailingstep * pipsize
ENDIF
ENDIF

IF newSL>0 THEN
SELL AT newSL STOP
ENDIF

// STOP STRATEGIE DrawDown
MaxDrawDownPercentage = 40 // Max DrawDown of x%
Equity = Capital + StrategyProfit
HighestEquity = Max (HighestEquity,Equity) // Save the Maximum Equity we got
MaxDrawdown = HighestEquity * (MaxDrawDownPercentage/100)
ExitFromMarket = Equity <= HighestEquity - MaxDrawdown
IF ExitFromMarket Then
Quit
ENDIF
it’s not possible to be Long and Short in he same time with the same code
Above is correct.
Why the algorithm takes me out of position at 9pm ?, You can see on the screenshot the output is represented by a red triangle?
How you know the red triangle is a 9pm? You are not using crosshairs on your cursor and the x axis shows 16:00 and 13 and 14?
Or am I missing something?
It does put long and short positions at the same time.
But be careful, you must have an account with a non-guaranteed stop.
You are right I made a mistake, I had an exit by chance at 9pm and I thought it was an error in my code but indeed I see on the screenshot and on my test right now that I exited around 7:45pm,
So the problem comes from my management of stops and trailing stops
Here I think I have understood Nicolas’ reasoning on the stop follower, it’s not perfect yet but I think it’s already better than the post just before :
// Strategy Name    : END OF DAY  -  YEN
// Version          : 2.0
// Information      : I don't know what is this Strategie means ;-)
// Stroks           : USD/JPY Mini
// Initial Capital  : 100 000 JPY
// Test on          : 50K Candles
// Spread           : 2
// ============================================================

Defparam cumulateorders = false
Once Capital    = 100000

// SIZE OF THE POSITIONS
N = 1
Ratio = 0.5

// TIMETABLE
StartTime     = 210000
EndTime       = 231500

// STOP LOSS & TAKE PROFIT (%)
SL = 12
Period = 12
Spread = 2

// CANDLE REFERENCE to StartTime
IF Time = StartTime THEN
Amplitude = Highest[Period](High) - Lowest[Period](Low)
Opening = Close
ENDIF

// LONGS & SHORTS
IF Not LongOnMarket AND Time >= StartTime AND Time <= EndTime AND DayOfWeek < 5 THEN
Buy N Shares AT (Opening - Amplitude * Ratio) Limit
ENDIF

IF LongOnMarket Then
Set Stop pLoss SL
ENDIF

points2BE = 140 //trailing will start @trailinstart points profit
trailingstep = 80 //trailing step to move the "stoploss"

IF NOT ONMARKET THEN //reset
newSL=0
breakevenLevel=0
ENDIF

//manage long positions
IF LONGONMARKET THEN
//first move to BreakEven
IF newSL=0 AND close-tradeprice(1) >= points2BE * pipsize THEN
newSL = tradeprice(1) + Spread * 2 * pipsize // BE + 2 x Spread fees
ENDIF

//next moves
IF newSL>0 AND Close - newSL >= trailingstep * pipsize THEN
newSL = High - trailingstep * pipsize
ENDIF
ENDIF

IF newSL>0 THEN
SELL AT newSL STOP
ENDIF

// STOP STRATEGIE DrawDown
MaxDrawDownPercentage = 40 // Max DrawDown of x%
Equity = Capital + StrategyProfit
HighestEquity = Max (HighestEquity,Equity) // Save the Maximum Equity we got
MaxDrawdown = HighestEquity * (MaxDrawDownPercentage/100)
ExitFromMarket = Equity <= HighestEquity - MaxDrawdown
IF ExitFromMarket Then
Quit
ENDIF
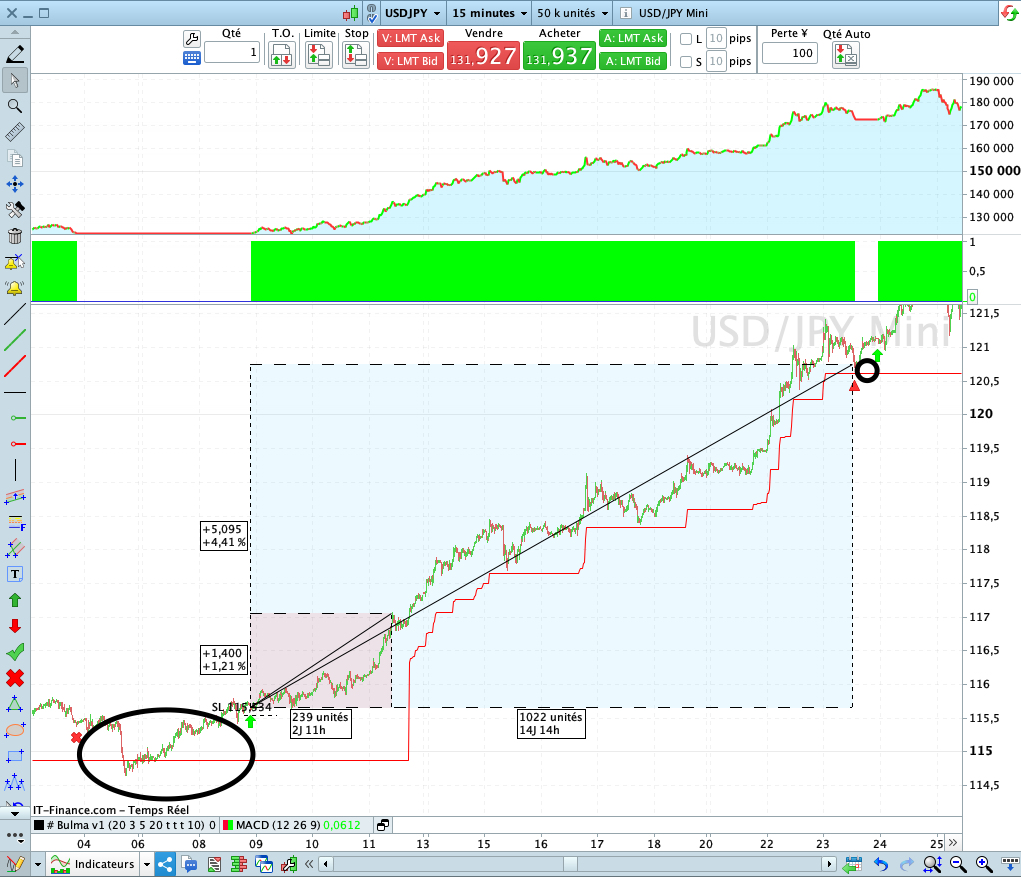
We can see that in the position just before the exit was around 140 pips (red frame), while now for the same trade the trailing stop makes us exit with a gain of 509 pips, Of course the code is not perfect, it tends to go the other way
For the first movement of the StopLoss to the breakeven with the variable Points2BE, I voluntarily left the number 140 in order to let the position breathe, On the other hand, if you have any other ideas or proposals on this point, I’d be happy to hear them.
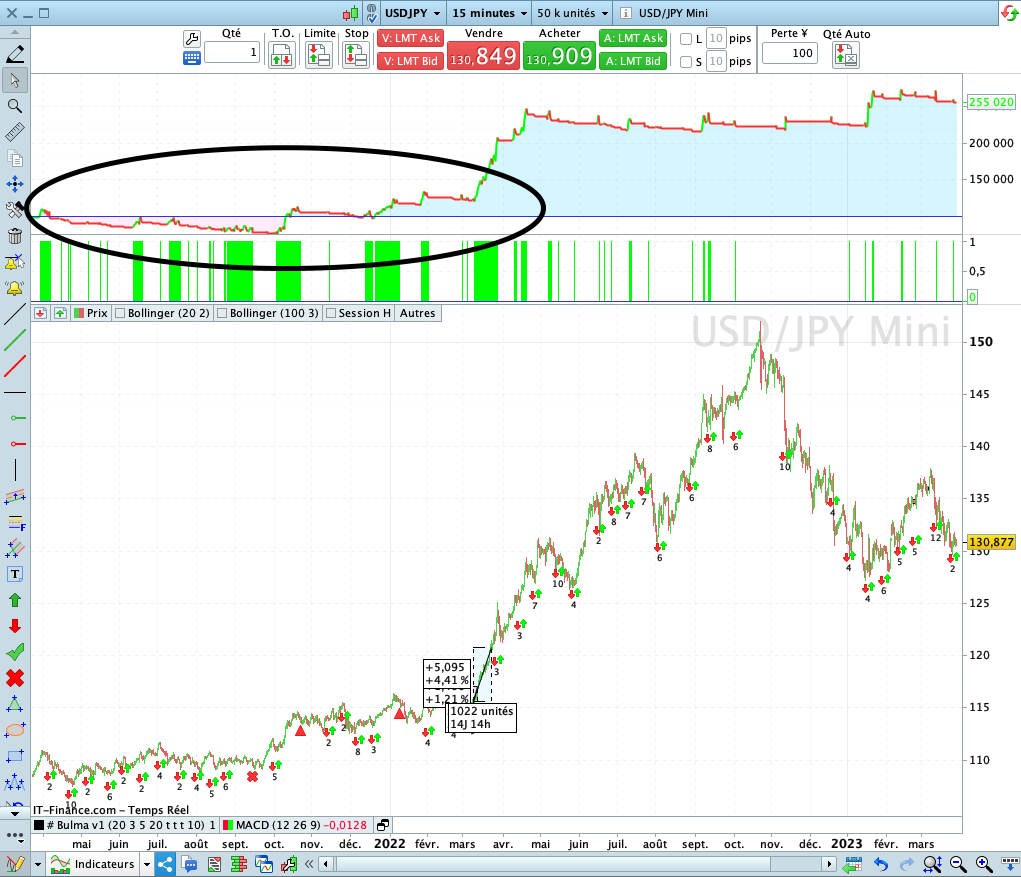
We should also not forget the disastrous performance at the beginning of the backtest 😅
Hi
some one can tell me how to draw my newSL Variable in my graphic price pls ?, I add this line but as you can see the graphic is on a frame alone, but I want to draw if with candles price together :
GRAPH newSL coloured(255,0,0) AS "My SL Tralling"
even my variable going from 0 to a big value, that is not a problem now, but if you also have a solution for this ?
@JC_Bywan
tks you, I will read it in the end of day and come back with a solution for my problem 😄, maybe if I find a solution for the 0 value 😅
I found this solution for draw the traling stop (tks you @JC_Bywan), but how to don’t draw it when we don’t have a trade open :
// Drawing Trailing Stop
IF newSL > 0 Then
TrailingSL = newSL
ELSE
TrailingSL = Undefined
ENDIF

GraphOnPrice TrailingSL coloured(255,0,0) AS "My Tralling Stop"
I also tryed this but not working :
// Drawing Trailing Stop
IF newSL > 0 Then
TrailingSL = newSL
GraphOnPrice TrailingSL coloured(255,0,0) AS "My Tralling Stop"
ELSE
TrailingSL = Undefined
ENDIF
Try …
IF onmarket AND newSL > 0 Then
TrailingSL = newSL
ELSE
TrailingSL = Undefined
ENDIF

GraphOnPrice TrailingSL coloured(255,0,0) AS "My Tralling Stop"
but how to don’t draw it when we don’t have a trade open :
// Drawing Trailing Stop
IF newSL > 0 Then
  TrailingSL = newSL
  If OnMarket then
    GraphOnPrice TrailingSL coloured(255,0,0) AS "My Tralling Stop"
  endif
ELSE
  TrailingSL = Undefined
ENDIF
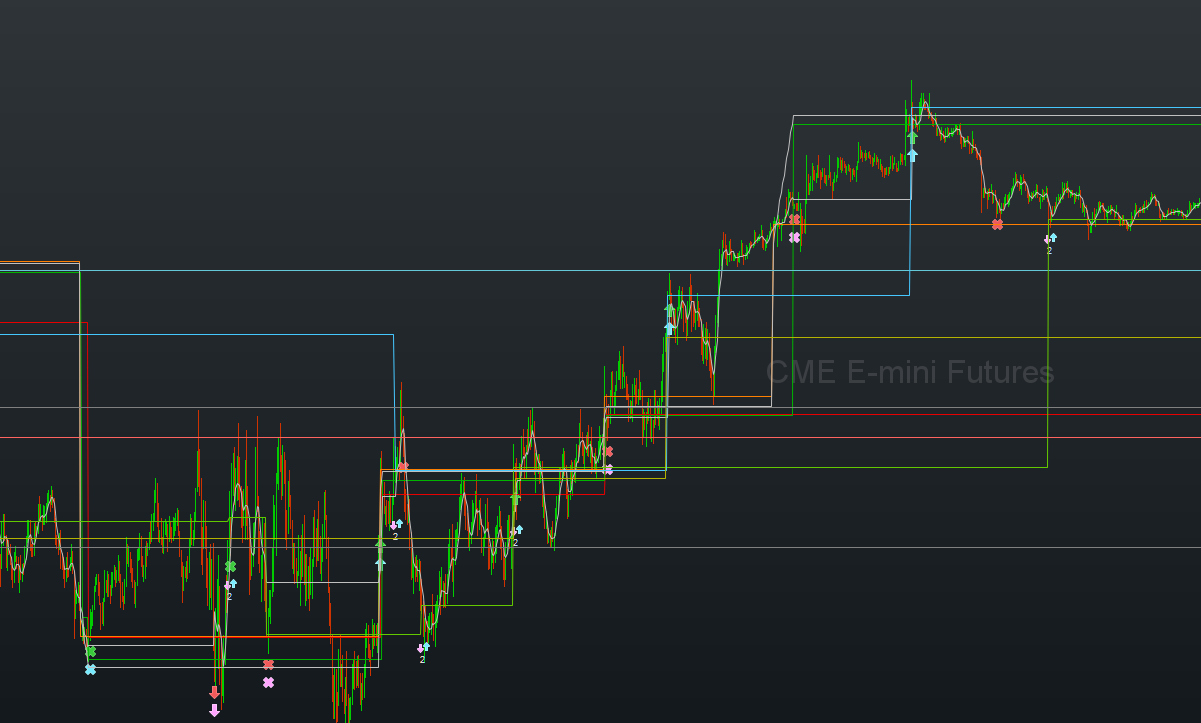
Note that really “don’t draw” does not exist. Here you see the exit from this morning (in the coffee-spoiling topic 😉 ) and it is depicted by the green line. So this line changes position because I tell it to, but when the position is exited I stop drawing that green line (and more). Now this line keeps on drawing automatically, but while this seems strange, it is even convenient. See 2nd screenshot. You can easily see where this green line was in action, and can zoom in to it when you want. In my case these are the trailing stop exits (the darker green line). Just learn a bit to utilize this feature. You will see it is quite handy.