Ehler’s MESA indicators constantly reload/recalculate?

Forums ProRealTime English forum ProRealTime platform support Ehler’s MESA indicators constantly reload/recalculate?

Viewing 15 posts - 1 through 15 (of 20 total)
  • #65415

    Hi there,

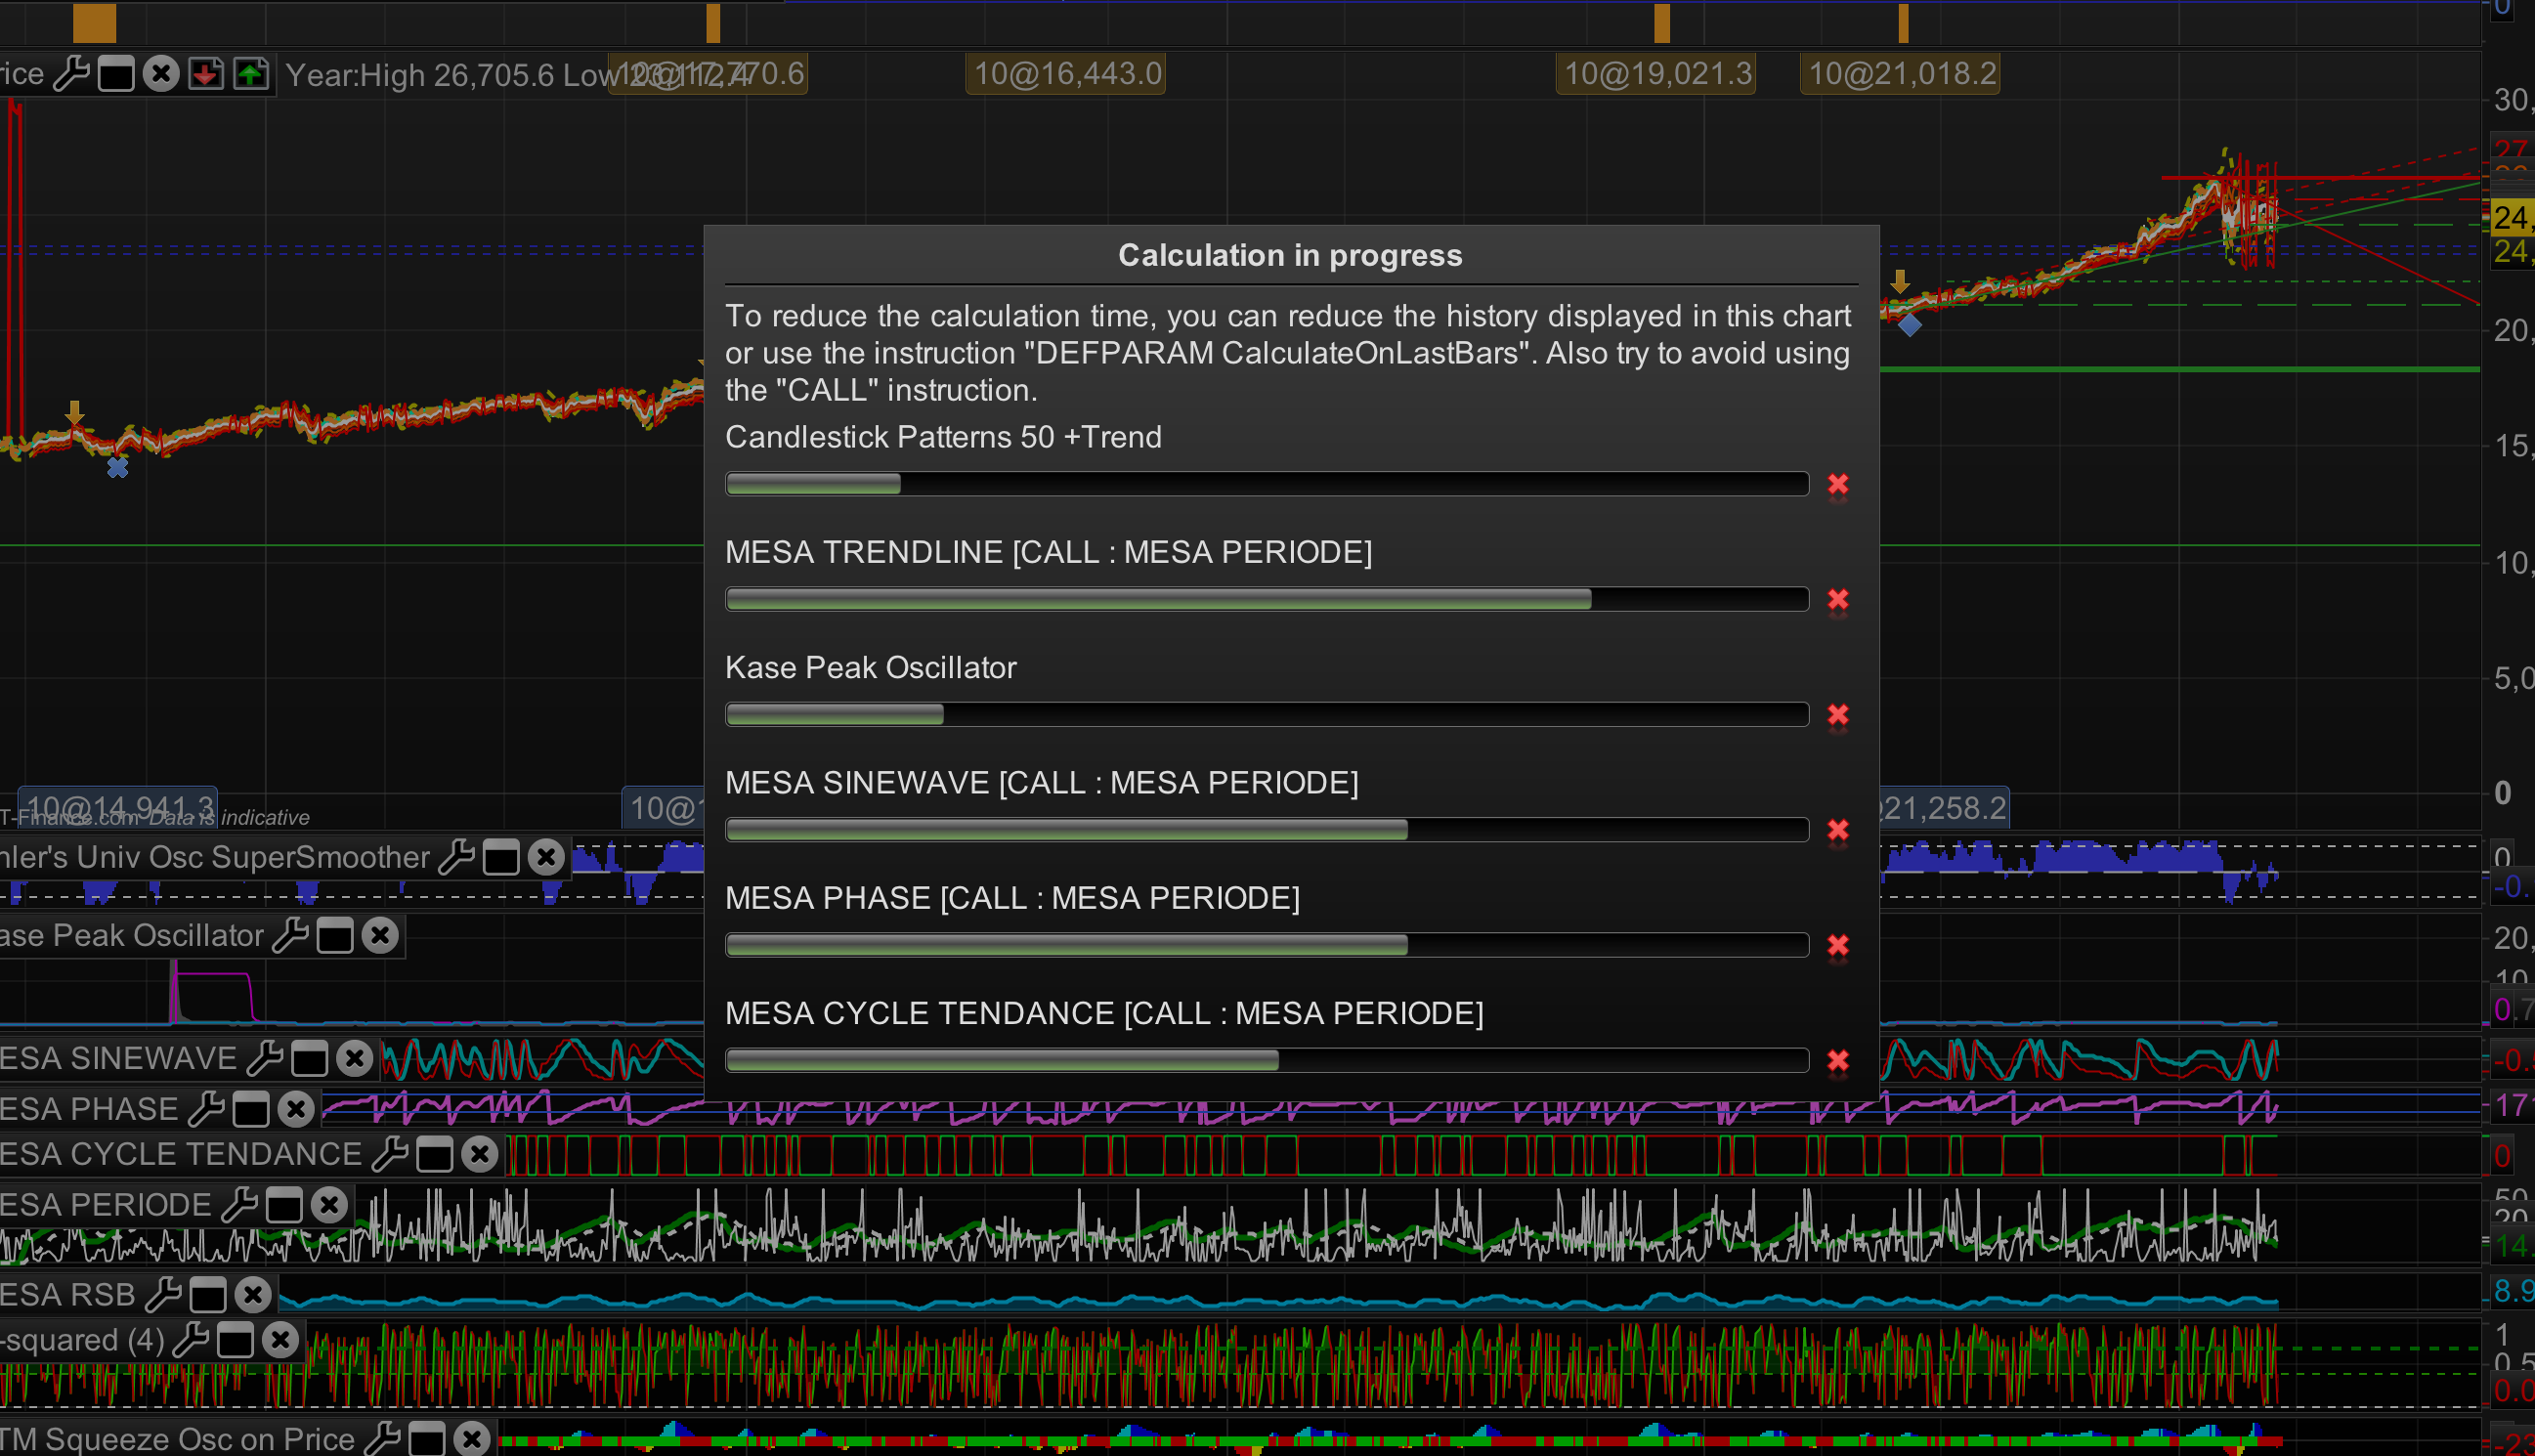
    I was wondering if anyone can explain why since the upgrades of PRT last year I have the John Ehler’s MESA series of indicators that constantly reload/recalculates?

    This happened the other day on the Hour Chart of the Dow Jones charts after setting units from 1,000 to 10,000? (On 1,000 units the chart does not reload/recalculate)

    If I recall correctly this was pinpointed by PRT Tech last year as being an issue with my 2.4ghz MacBook 17” 16GB although it never redrew the charts every couple of minutes when using the v10.2 (or it might have been v10.1). This only happened after the PRT upgrade. (Otherwise this PRT platform just keeps getting better and better).

    I now have the MacBook 15” 3.1ghz with 4.1ghz Turbo Boost, 16 GB but it’s still redrawing on longer unit settings (which, just to clarify it never did before updates to PRT)?

    Any ideas?

    Thanks very much,

    Bard

    #65420

    Stocks & Commodities V. 36:03 (8–11): Recursive Median Filters by John F. Ehlers

    Impulsive noise spikes or extreme price or volume data are not unusual in the nancial markets and these extreme values can throw off your averaging calculations. How can you set up a data lter to re- move these extreme price movements? This STOCKS & COMMODITIES Contributing Editor shows you a way to handle this by using a lter that discards all data except the median value.

    Median lters are best applied to remove impulsive or spiking types of noise. Rather than averaging the spike into the lter out- put, median lters simply ignore the spike. Median lters are routinely used for pro-

    cessing photographs and video because they preserve the sharp edges in the images rather than smoothing them as is done by averaging lters. Median lters have the unique characteristic of being idempotent, that is, if you repeatedly perform median ltering on a time waveform, the output rapidly converges to being exactly the input waveform except for com- putational lag. That a price waveform converges to a core waveform has some interesting philosophical rami cations for trading.

    HOW SO?

    Median lters are nonlinear. Since a median lter is not a convolution lter, it cannot be suitably represented in the Fourier frequency domain. Also, its output is not differentiable and therefore does not have a Taylor series expansion. This precludes curve- tting by a higher-order polynomial.

    There are many academic articles describing rather arcane algorithms for recursive median lters. The rea- son I consider the algorithms arcane is they exclusively study nite impulse response (FIR) types of lters.

    This is because the applications being considered are being implemented in hardware rather than software. “Recursive” means using a previous calculation in the current calculation.

    APPLYING IT

    An example of a recursive lter used in trading is the exponential moving average (EMA). I propose a recur- sive median lter for trading be implemented as the EMA of a ve-bar median lter. A simple pseudocode representation of a recursive median lter is:

    Output = a*Median(Input, 5) + (1 – a)*Output[1];

    The EMA a is a constant between zero and 1. I prefer to calculate it in terms of the critical period of the lter. The critical period is where shorter wavelengths are passed by the lter and longer wavelengths are rejected at the lter output. The relationship between the EMA constant and critical period is expressed by the equation:

    a = (Cosine (360 / Period) + Sine (360 / Period) – 1) / Cosine (360 / Period)

    where the arguments of the trigonometric terms are in degrees.

    An easier-to-remember approximation to the re- lationship between the EMA constant and critical period is:

    a = 5 / Period

    MORE FILTERING

    An interesting and unique oscillator-type indicator can be cre- ated from the recursive median lter by further ltering with a second-order highpass lter. The highpass lter removes the DC (constant) values and very long wavelength components from the recursive median lter output. Using a second-order lter guarantees attenuation of the long wavelength components resulting from the statistical fractal pink-noise spectral shape of market data.

    The second-order nature of the highpass lter reduces its critical period about 70% relative to the critical period of an EMA lter. The EasyLanguage code to compute the recursive median oscillator is given in sidebar “EasyLanguage Code For Recursive Median Oscillator.”

    You can see the uniqueness and novelty of the recursive median oscillator when you compare it to the RSI (Figure 1). The recursive median oscillator is displayed in the rst sub- graph and the RSI is plotted in the second subgraph. The RSI is scaled to swing from -1 to +1 instead of the standard swing from zero to 100. The price data for Figure 1 is of the SPY for

    the calendar year 2017. The recursive median oscillator uses a 40-bar (two-month) critical highpass period and the RSI uses a standard 14-bar calculation. Both indicators have a smoothing lter critical period of 16 bars. From Figure 1 you can see that the recursive median oscillator has less lag and generally has faster response to the larger moves in the price data.

    SMOOTH AND EFFICIENT

    When data contains impulsive noise or uctuations in data, a trader needs to gure out how to smooth that data with the least amount of lag. The recursive median oscillator meets this need by ltering out outlier data, which gives a better view of the bigger picture.

    S&C Contributing Editor John Ehlers is a pioneer in the use of cycles and DSP technical analysis. He is president of MESA Software and cofounder of StockSpotter.com. MESASoftware. com offers the MESA Phasor and MESA intraday futures strategies.

    The code given in this article is available in the Article Code section of our website, http://www.Traders.com.

    (See our Traders’ Tips section beginning on page 48 for commentary and implementation of John Ehlers’ technique in various technical analysis programs. Accompanying program code can be found in the Traders’ Tips area at Traders.com.

    The EasyLanguage code to compute the recursive median Filter is given in sidebar “EasyLanguage Code For Recursive Median Filter.”)

    1 user thanked author for this post.
    #65721

    Hi Bard,

    I advise to send a technical report by following these instructions:

    – As soon as you encounter the issue, go to the “Help” menu on the ProRealTime toolbar.
    – Click on “Technical support”
    – Select “Code”
    – Giving as many details as possible, explain the issue you are having in the text box and mention the name of the code you are referring to.
    – To receive in depth assistance, it is necessary to analyze the code itself which is encrypted on our servers. To allow our technicians temporary access, please check the box marked “I authorize the decryption of the codes…”
    – Click “Send report”

    This will send a report containing technical information concerning your platform, which will allow the technical team to run a diagnostic analysis of the issue you have come across.

    Many thanks in advance,

    Ulrike

    1 user thanked author for this post.
    #67058

    Thanks Ulrike

    I have already done this via PRT help window in March 2018.

    I got a reply from IG Index in early March saying that IT-Finance does not support custom indicators and that I should address the problem to the PRT Forum, which I did above. I was informed that it was a glitch with the PRT software by IG Index support.

    I have just resubmitted my support request via the PRT help window again.

    Fingers crossed that PRT can finally fix the issue as it makes using the charts with MESA impossible to use with the constant re-load issue.

    Cheers
    Bard

    #67317

    Hi Bard,

    could you please send your IG account number to “contact@prorealtime.com” including a link to this post, please?

    I will then get in touch with the technical team in order to see if I can get any further information.

    Best,

    Ulrike

    #69713

    Hi Ulrike,

    Have you had any feedback from PRT?
    I replied by email to contact@prorealtime.com on the 16th April with my account details.

    Thanks
    Bard

    #69793

    Hi Bard,

    The ticket is taken care of by our programming team.

    I hope to have a quick answer and will revert to you asap.

    Best,

    Ulrike

    #71726

    Hi Ulrike,

    I was wondering if there had been any progress on this ticket?
    I would like to be able to use the MESA charts with a longer look back than the minimum look back unit setting I’m currently having to use (because the charts re-load themselves over and over with longer units).

    Thanks
    Bard

    #72370

    Dear Bard,

    Our technical team is still working on the issue.

    We will come back to you you shortly.

    Best regards,

    #72381

    Much appreciated Ingrid, it’d be great to get back to using MESA as an automated trading tool on the latest version of PRT.

    Cheers
    Bard

    #72490

    Dear Bard,

    Our technical team confirms that the problem with the Ehler’s MESA indicators has been resolved. The last test on the DOW instrument in 4 hours timeframe and with 1 000 units did not show any recalculation.

    If the situation occurs again, please send us a technical report following these instructions:

    – As soon as you encounter the issue, go to the “Help” menu on the ProRealTime toolbar.
    – Please assure that the window concerned by this issue is open.
    – Click on “Technical support”
    – Choose the category (e.g. “Data” for a spike)
    – Select the concerned window in the drop-down menu.
    – Giving as much detail as possible, explain the issue you are having in the text box.
    – Click “Send report”

    Best Regards,

    1 user thanked author for this post.
    #72562

    Thank you very much Ingrid and PRT Techs, it’s really appreciated as this is much better. 1,000 units works well with the Daily chart as well as the 4 hour chart.

    I still notice though that if the 4 hour chart is set to 10,000 units, I still get recalculating of the MESA RSB indicator every 15 seconds and if set to Daily, 10,000 units (for backtesting) all of the 5 MESA indicators still recalculate every 15 secs?

    Cheers
    Bard

    #72623

    Hello,

    The problem is corrected. If it persists on your platform, I would thank you for sending us a new technical report.

    Regards,

    Carine

    #73103

    Thanks Carine, I have sent another report concerning using higher unit values like 10,000 of eg: Daily charts using MESA.

    #73367

    Dear Bard,

    The ticket is taken care of by our programming team.

    They will revert to you asap.

    Best regards,

Viewing 15 posts - 1 through 15 (of 20 total)

Create your free account now and post your request to benefit from the help of the community
Register or Login