smn
smnParticipant
New
Bonsoir Smn
Sur prix : petit tableau à droite, configurer mettre les prix à l’échelle logarithmique
Merci Supertiti, j’avais bien vu cette possibilité, mais quand je l’active la droite de régression part en sucette 🙂
De mon côté ça marche quand je passe de linéaire à logarithmique .
smnParticipant
New
Bonjour Supertiti,
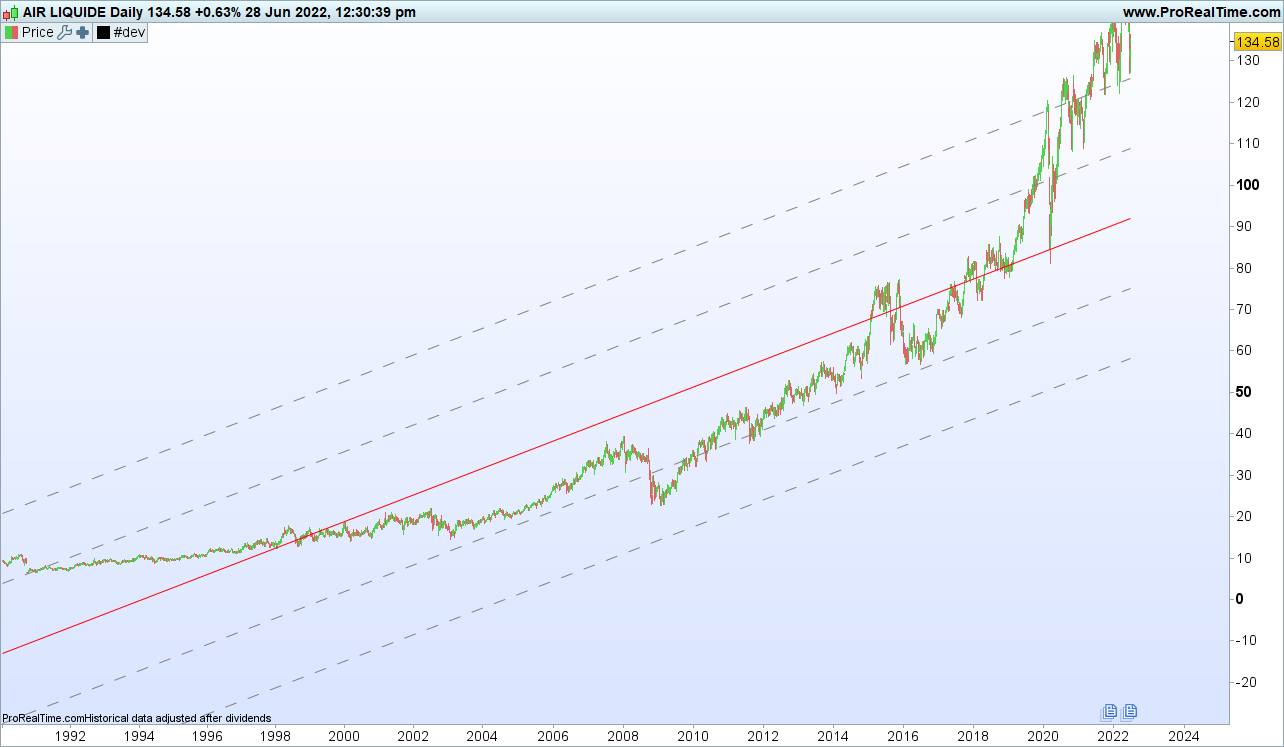
Alors, tu trouveras ci-joint la capture d’écran de la régression linéaire de Air Liquide.
lorsque je cherche à avoir la même chose avec ton code je n’y arrive pas. Est-ce que tu peux me dire si tu as le même problème et éventuellement pourquoi ?
Merci
En effet c’est une échelle logarithmique, donc l’apparence de la régression ne sera pas la même.
1/ j’ai modifié un peu le code pour qu’il soit plus rapide au calcul:
//PRC_Std and Ste LinRegChannel | indicator
//Standard Deviation and Standard Error
//Linear Regression Channel
//12.03.2019
//Nicolas @ www.prorealcode.com
//Sharing ProRealTime knowledge

defparam drawonlastbaronly=true
if islastbarupdate then
// --- settings
lookback= max(1,barindex) //channel period
ChannelType = 1 //1= Standard Deviation ; 2= Standard Erro
NbDeviation = 1 //Deviation multiplier
colorRed = 255
colorGreen = 255
colorBlue = 0
// --- end of settings

sumx = 0
sumy = 0
sumxy = 0
sumx2 = 0

for cmpt = lookback downto 0 do
tmpx = cmpt
tmpy = close[cmpt]
sumy = sumy+tmpy
sumx = sumx+tmpx
sumx2 = sumx2 + (tmpx*tmpx)
sumxy = sumxy + (tmpy*tmpx)
next

n = lookback+1

if (sumx2 = sumx * sumx) then // protection to avoid infinite values
b = sumxy - sumx * sumy
else
b = (n * sumxy - sumx * sumy) / (n * sumx2 - sumx * sumx)
endif
a = (sumy - b * sumx) / n

drawsegment(barindex[lookback],a+b*lookback,barindex,a+b*0) coloured("red")

//channel
if ChannelType = 1 then //Standard Deviation
dat = std[lookback]*NbDeviation
else
dat = ste[lookback]*NbDeviation
endif
drawsegment(barindex[lookback],(a+b*lookback)+dat,barindex,a+b*0+dat) coloured("gray") style(dottedline2)
drawsegment(barindex[lookback],(a+b*lookback)-dat,barindex,a+b*0-dat) coloured("gray") style(dottedline2)
endif

return
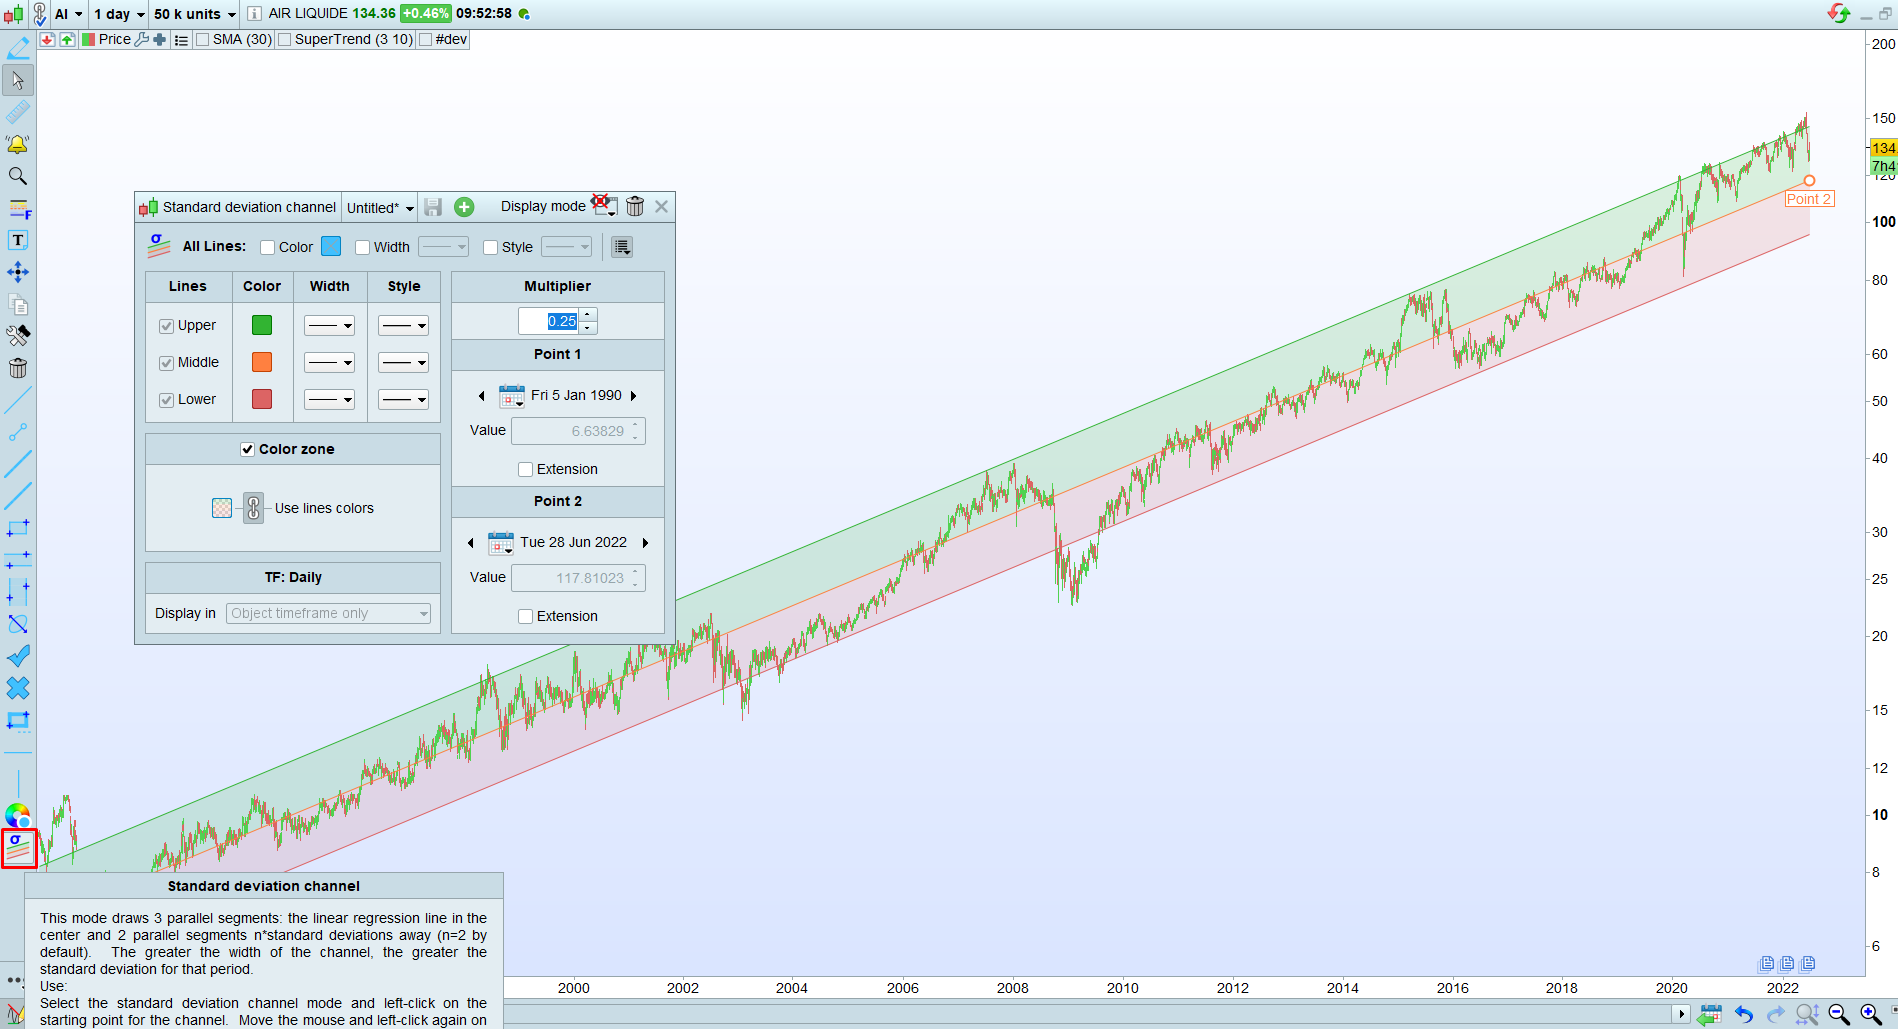
2/ pour obtenir une régression linéaire sur votre graphique, il n’est pas obligatoire d’utiliser un code personnalisé, utilisez simplement l’outil de regression dans la plateforme (fonctionne sur échelle logarithmique) = voir image jointe.
Bonjour Nicolas,
J’ai voulu doubler les lignes de déviation comme je l’avais fais mais cette fois ci le systeme me dit :
“parametre entier avec STD” en place de loockback sur les lignes de “DAT2”
nota : a la ligne 48 il doit y avoir une coquille ?
Où est le bug dans mon code ?
merci de me dire, bonne journée
defparam drawonlastbaronly=true
if islastbarupdate then
// --- settings
lookback= max(1,barindex) //channel period
ChannelType = 1 //1= Standard Deviation ; 2= Standard Erro
NbDeviation = 1 //Deviation multiplier
colorRed = 255
colorGreen = 255
colorBlue = 0
// --- end of settings

sumx = 0
sumy = 0
sumxy = 0
sumx2 = 0

for cmpt = lookback downto 0 do
tmpx = cmpt
tmpy = close[cmpt]
sumy = sumy+tmpy
sumx = sumx+tmpx
sumx2 = sumx2 + (tmpx*tmpx)
sumxy = sumxy + (tmpy*tmpx)
next

n = lookback+1

if (sumx2 = sumx * sumx) then // protection to avoid infinite values
b = sumxy - sumx * sumy
else
b = (n * sumxy - sumx * sumy) / (n * sumx2 - sumx * sumx)
endif
a = (sumy - b * sumx) / n

drawsegment(barindex[lookback],a+b*lookback,barindex,a+b*0) coloured("red")

//channel
if ChannelType = 1 then //Standard Deviation
dat = std[lookback]*NbDeviation
else
dat = ste[lookback]*NbDeviation
endif
drawsegment(barindex[lookback],(a+b*lookback)+dat,barindex,a+b*0+dat) coloured("gray") style(dottedline2)
drawsegment(barindex[lookback],(a+b*lookback)-dat,barindex,a+b*0-dat) coloured("gray") style(dottedline2)
endif
//////////////////////////////////////////////////////////////////////
//////////////////////////////////////////////////////////////////////

//lookback= max(1,barindex) //channel period
ChannelType2 = 1 //1= Standard Deviation ; 2= Standard Erro
NbDeviation2 = 2 //Deviation multiplier
//channel
if ChannelType2 = 1 then //Standard Deviation
dat2 = std[lookback]*NbDeviation2
else
dat2 = std[lookback]*NbDeviation2
endif
drawsegment(barindex[lookback],(a+b*lookback)+dat2,barindex,a+b*0+dat2) coloured("gray") style(dottedline2)
drawsegment(barindex[lookback],(a+b*lookback)-dat2,barindex,a+b*0-dat2) coloured("gray") style(dottedline2)

return
Trop complexe de reprendre ton code, voici le mien modifié avec 2 lignes de canal haute et basse.
//PRC_Std and Ste LinRegChannel | indicator
//Standard Deviation and Standard Error
//Linear Regression Channel
//12.03.2019
//Nicolas @ www.prorealcode.com
//Sharing ProRealTime knowledge

defparam drawonlastbaronly=true
if islastbarupdate then
// --- settings
lookback= max(1,barindex) //channel period
ChannelType = 1 //1= Standard Deviation ; 2= Standard Erro
NbDeviation = 1 //Deviation multiplier
NbDeviation2 = 0.5 //Deviation multiplier
colorRed = 255
colorGreen = 255
colorBlue = 0
// --- end of settings

sumx = 0
sumy = 0
sumxy = 0
sumx2 = 0

for cmpt = lookback downto 0 do
tmpx = cmpt
tmpy = close[cmpt]
sumy = sumy+tmpy
sumx = sumx+tmpx
sumx2 = sumx2 + (tmpx*tmpx)
sumxy = sumxy + (tmpy*tmpx)
next

n = lookback+1

if (sumx2 = sumx * sumx) then // protection to avoid infinite values
b = sumxy - sumx * sumy
else
b = (n * sumxy - sumx * sumy) / (n * sumx2 - sumx * sumx)
endif
a = (sumy - b * sumx) / n

drawsegment(barindex[lookback],a+b*lookback,barindex,a+b*0) coloured("red")

//channel
if ChannelType = 1 then //Standard Deviation
dat = std[lookback]*NbDeviation
dat2 = std[lookback]*NbDeviation2
else
dat = ste[lookback]*NbDeviation
dat2 = ste[lookback]*NbDeviation2
endif
drawsegment(barindex[lookback],(a+b*lookback)+dat,barindex,a+b*0+dat) coloured("gray") style(dottedline2)
drawsegment(barindex[lookback],(a+b*lookback)-dat,barindex,a+b*0-dat) coloured("gray") style(dottedline2)
drawsegment(barindex[lookback],(a+b*lookback)+dat2,barindex,a+b*0+dat2) coloured("gray") style(dottedline2)
drawsegment(barindex[lookback],(a+b*lookback)-dat2,barindex,a+b*0-dat2) coloured("gray") style(dottedline2)
endif

return
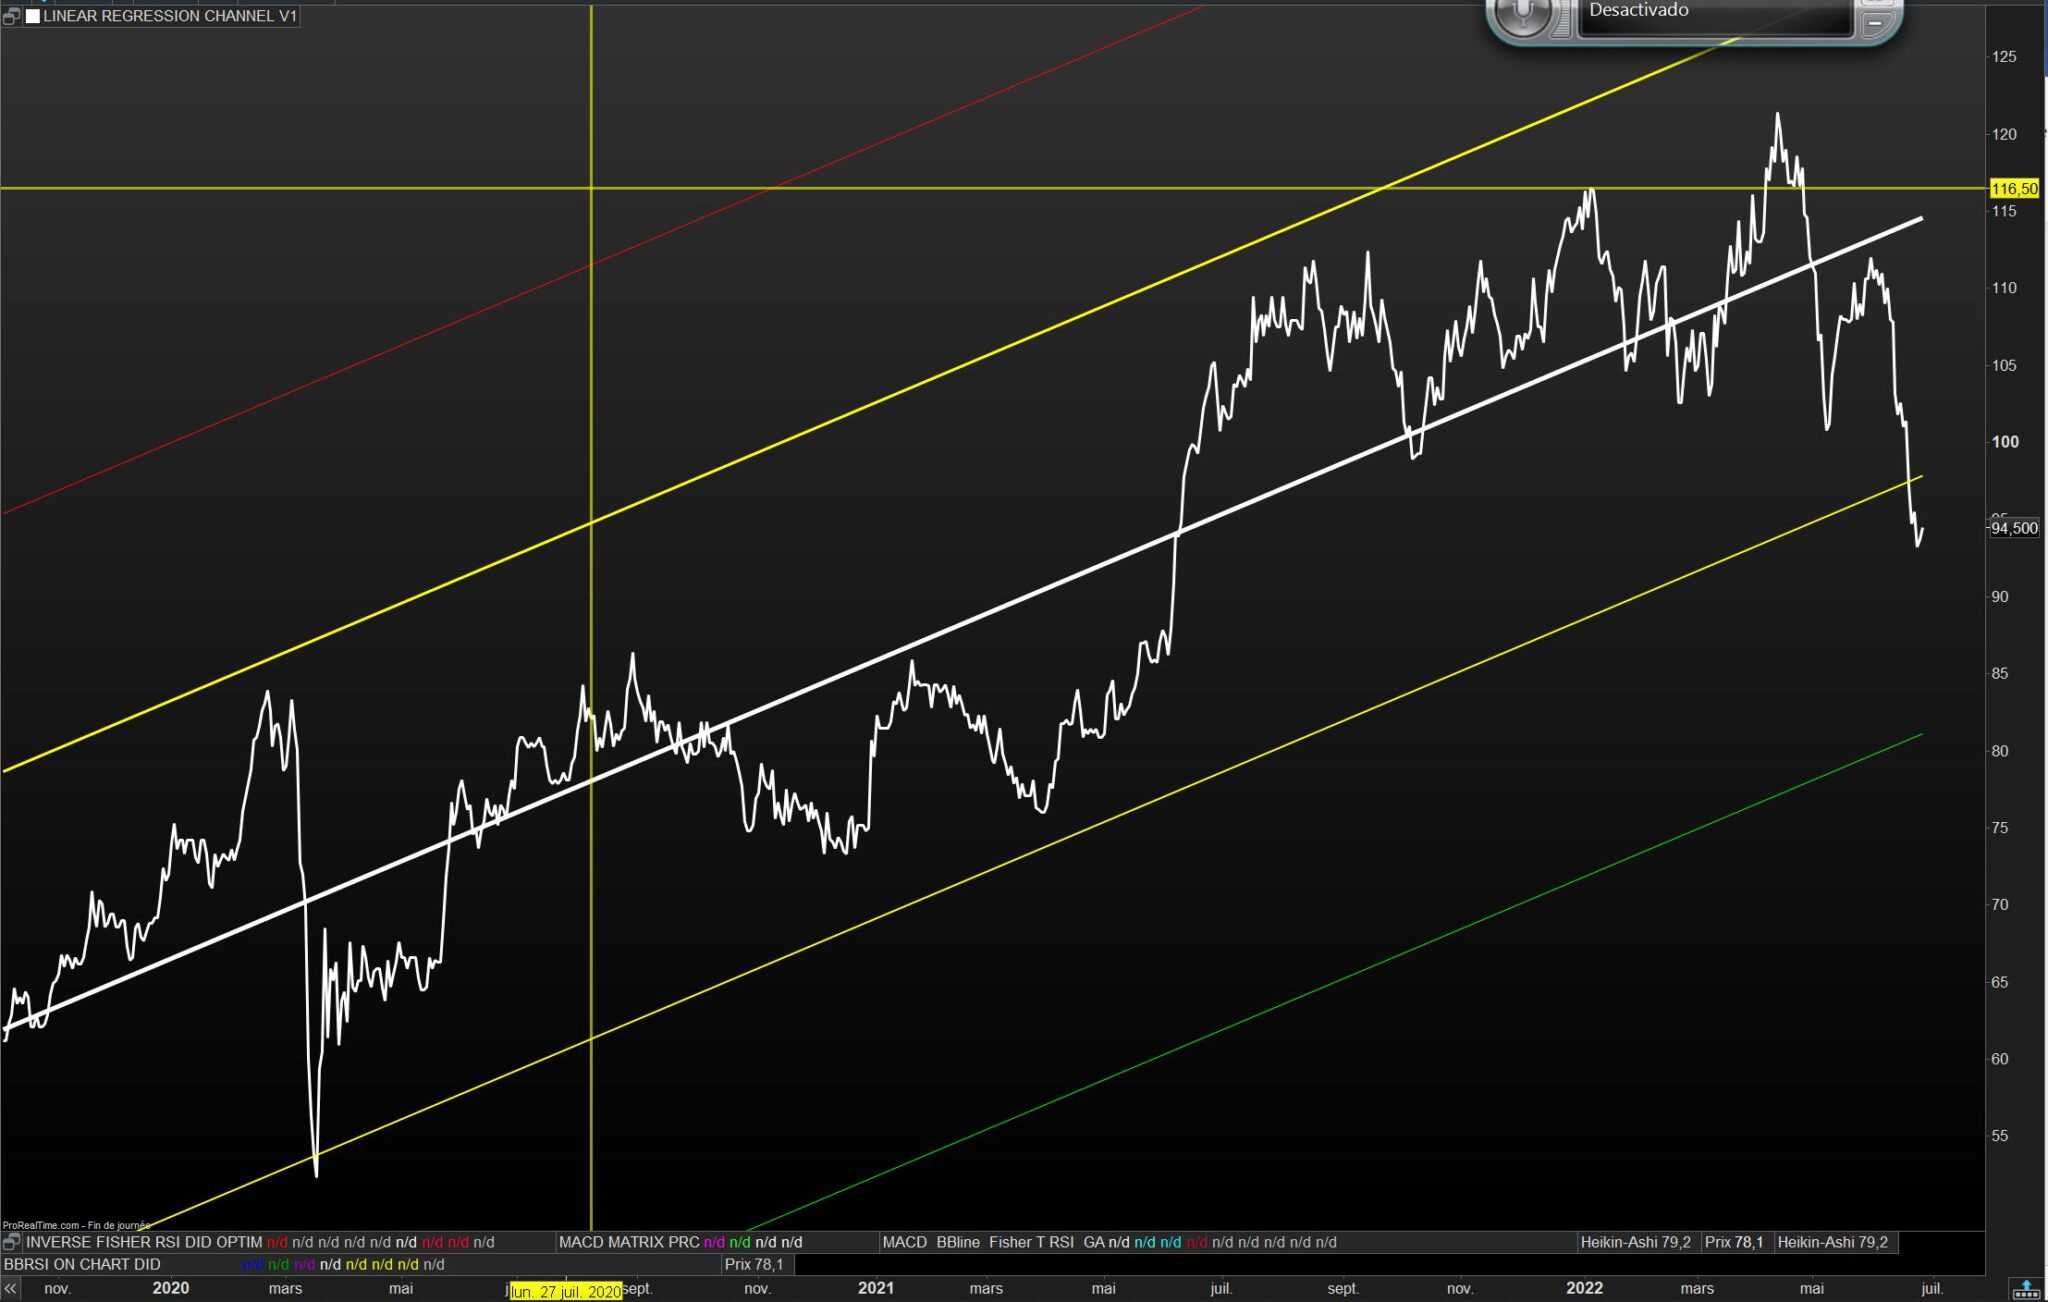
Et voilà :
// LINEAR REGRESSION CHANNEL V1 by Nicolas  28 juin 2022

// LINEAR REGRESSION CHANNEL V1 by Nicolas  28 juin 2022
// graphe style LINEAIRE

defparam drawonlastbaronly=true
if islastbarupdate then
// --- settings
lookback= max(1,barindex) //channel period
ChannelType = 1 //1= Standard Deviation ; 2= Standard Erro
NbDeviation = 1 //Deviation multiplier
colorRed = 255
colorGreen = 255
colorBlue = 0
// --- end of settings

sumx = 0
sumy = 0
sumxy = 0
sumx2 = 0

for cmpt = lookback downto 0 do
tmpx = cmpt
tmpy = close[cmpt]
sumy = sumy+tmpy
sumx = sumx+tmpx
sumx2 = sumx2 + (tmpx*tmpx)
sumxy = sumxy + (tmpy*tmpx)
next

n = lookback+1

if (sumx2 = sumx * sumx) then // protection to avoid infinite values
b = sumxy - sumx * sumy
else
b = (n * sumxy - sumx * sumy) / (n * sumx2 - sumx * sumx)
endif
a = (sumy - b * sumx) / n

drawsegment(barindex[lookback],a+b*lookback,barindex,a+b*0) coloured("white")style(line,5)

//channel
if ChannelType = 1 then //Standard Deviation
dat = std[lookback]*NbDeviation
else
dat = ste[lookback]*NbDeviation
endif
drawsegment(barindex[lookback],(a+b*lookback)+dat,barindex,a+b*0+dat) coloured("yellow") style(line,2)
drawsegment(barindex[lookback],(a+b*lookback)-dat,barindex,a+b*0-dat) coloured("yellow") style(line,2)
endif

///////////////////////////////////////////////////////////////////////////////////////////
//////////////////////////////////////////////////////////////////////////////////////////
drawsegment(barindex[lookback],(a+b*lookback)+dat,barindex,a+b*0+dat) coloured(colorRed,colorGreen,colorBlue)style(line,3)
lookback2= max(1,barindex) //channel period
ChannelType = 1 //1= Standard Deviation ; 2= Standard Erro
NbDeviation2 = 2  //Deviation multiplier
//channel 2
if ChannelType = 1 then //Standard Deviation
dat2 = std[lookback2]*NbDeviation2
else
dat2 = ste[lookback2]*NbDeviation2
endif
drawsegment(barindex[lookback2],(a+b*lookback2)-dat2,barindex,a+b*0-dat2) coloured (0,255,8)//(colorRed,colorGreen,colorBlue)
drawsegment(barindex[lookback2],(a+b*lookback2)+dat2,barindex,a+b*0+dat2) coloured (255,9,0)
/////////////////////////////////////////////////////
/////////////////////////////////////////////////////
return customclose as " Linear regression channel V1  "
smnParticipant
New
Merci Nicolas, mais du coup on ne peut pas avoir un code qui fonctionne sur l’échelle logarithmique ?
C’est en effet plus complexe, le code de la régression linéaire doit être réécrit. L’indicateur doit calculer lui même l’échelle, puisque la plateforme ne renvoi pas cette valeur.
Bonjour tout le monde,
@Ozons
Je suis tombé sur ce sujet par hasard, je n’ai pas eu le temps de tout lire mais j’ai cliqué sur le lien de la vidéo et regarder un petit peu en accéléré,
Je dirais encore un vendeur de formation, j’ai lu pas mal de bouquins de bourse et je continue toujours mon apprentissage et mon petit retour d’expérience c’est que les prix ne suivent pas une loi normale donc on ne peut pas utiliser une courbe gaussienne et donc tous les gens qui rabâche que le prix est à 95 % inclus dans deux écart-types et ben ils disent n’importe quoi c’est plutôt environ 86 % pour deux écarts (j’ai trouvé cette information dans le livre de Bollinger et de Philippe Cayenne)
Je respecte bien toute personne qui donne du savoir, dans certaines cultures on dit : un professeur a presque la même place qu’un prophète, et bien d’autres citations de personnes célèbres comme Einstein
Moi la dernière que j’ai apprise d’un très très bon ami très rigolo c’est : quand on sait pas faire et ben on l’enseigne 🤣
Attention je ne vise personne c’est juste pour rigoler un petit peu