Thank you Nicolas. Your assistance is much appreciated.
Code looks good thank you. Now the last challenge is how to get it to draw segment lines only on the most current HiPoint and HiPoint[1] and LoPoint and LoPoint[1] and ignore all the rest of the historical Hipoints and Lopoints.
I tried introducing at the begining of the code:
DEFPARAM DRAWONLASTBARONLY = true
DEFPARAM CALCULATEONLASTBARS = 200
But this seems to work on only one of the points either Lopoint or Hipoint pending which one happens to be the most current on chart but did not draw both.
Any ideas?
That’s normal because we can’t never know in advance how much bars is necessary to loop in the past to find the last 2 needed points to draw a new trend line ..
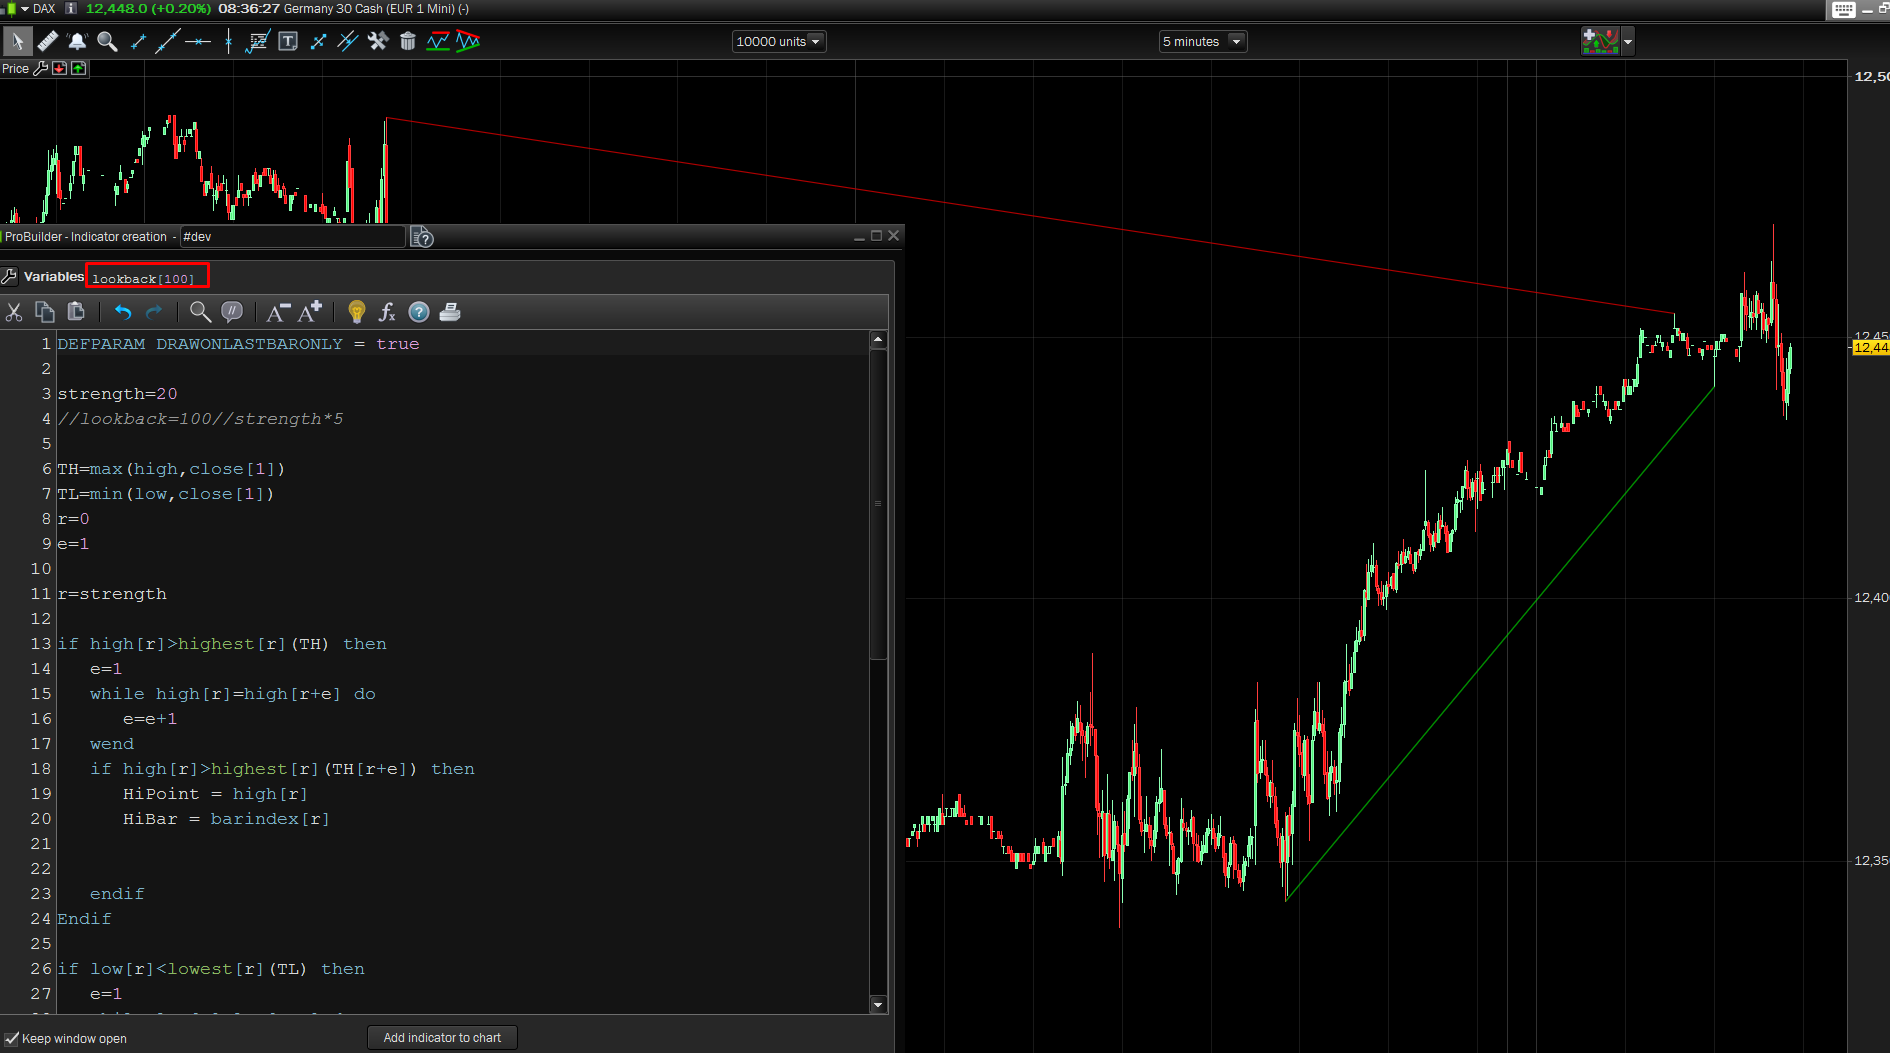
So I add the “lookback” variable as an external one that can change to find the suitable one for each instrument/timeframe. Example attached on DAX 5 minutes, a lookback of 500 bars was needed in order to find the first high point above the current one!
DEFPARAM DRAWONLASTBARONLY = true

strength=20
//lookback=100//strength*5

TH=max(high,close[1])
TL=min(low,close[1])
r=0
e=1

r=strength

if high[r]>highest[r](TH) then
e=1
while high[r]=high[r+e] do
e=e+1
wend
if high[r]>highest[r](TH[r+e]) then
HiPoint = high[r]
HiBar = barindex[r]


endif
Endif

if low[r]<lowest[r](TL) then
e=1
while low[r]=low[r+e] do
e=e+1
wend
if low[r]<lowest[r](TL[r+e]) then
LoPoint = low[r]
LoBar = barindex[r]


endif
endif

for i = 1 to lookback do
if hibar[i]<>hibar then
if hipoint[i]>hipoint then
drawsegment(HiBar[i],HiPoint[i],HiBar,HiPoint) coloured(200,0,0)
break
endif
endif
next

for i = 1 to lookback do
if lobar[i]<>lobar then
if lopoint[i]<lopoint then
drawsegment(loBar[i],loPoint[i],loBar,loPoint) coloured(0,200,0)
break
endif
endif
next

return
Hi Nicolas,
For example suppose I have an indicator that is returning a number on the current bar of the chart (let’s say that number for argument sake is +100 which is obviously >0).
The number +100 is continually changing increasing and decreasing depending on indicator calculation.
Now if the current number is +100 and the next (new) number is +99 then the number (although is still >0) has decreased by -1.
Is it possible to show +99 in red because it has decreased and as long as it is decreasing keep showing in red and when it increases again, show it in green.
I guess you need to be able to calculate difference between a number and itself in the same bar and show green if >0 and red if <0. Unless you have another trick to do it.
Regards,
Walid
I’m not sure your question is related to this topic, but anyway..
In order to compare a value between now and its previous state, during the same bar, you have to use a variable in array, which is not reset on each tick received in a bar:
defparam drawonlastbaronly=true
a = rsi[14]

if a > $var[barindex] then //value now is more than before
 $var[barindex]=a //save RSI value
 r=0 //no red
 g=255 //but green!
elsif a < $var[barindex] then //value now is less than before
 $var[barindex]=a //save RSI value
 r=255 //red
 g=0 //no green!
endif

drawtext("#a#",barindex,50,dialog,bold,20) coloured(r,g,0) //text value in desired color

return a
Thank you Nicolas. That’s great, it worked.
Now the challenge is how do I compute the change between a and $var[barindex] (i.e. the change between the stored “a” value and the new “a” value in the same bar.
For example to do it between the current bar and the previous bar, I would use change=(a-a[1])/a[1])*100 to get the %change.
How do I do same but in the current bar.
$var[barindex] is the last value you have stored, so basically your formula is:
((a-$var[barindex])/$var[barindex])*100
defparam drawonlastbaronly=true
a = rsi[14]

change = round(((a-$var[barindex])/$var[barindex])*100,2)

if a > $var[barindex] then //value now is more than before
$var[barindex]=a //save RSI value
r=0 //no red
g=255 //but green!
elsif a < $var[barindex] then //value now is less than before
$var[barindex]=a //save RSI value
r=255 //red
g=0 //no green!
endif

drawtext("#a# #change#%",barindex,50,dialog,bold,20) coloured(r,g,0) //text value in desired color

return a
Thank you Nicolas. Much appreciated mate.
1 – in your email reply (plz see snapshot atatched), the expression ((a-$var[barindex])/$var[barindex])*100 seems to be included in the code and appears ABOVE the expression defparam drawonlastbaronly=true. Is this correct? In the web portal reply section above, the expression ((a-$var[barindex])/$var[barindex])*100 seems to be not included in the code. Is the expression required? and if so, where? above defparam or below it or expression not required at all?
2 – In both your email code and code in this portal above, you have Return VWAP. Is this a typo or VWAP is required after Return?
The above code, contained in the code window is the one you need. There is no typo.
Thank you Nicolas.
By the way, how do I DRAWTEXT to the RIGHT of the current bar? Say I have 3 results which I want to drawtext the values to the right of the bar (1 result below the other) starting from (to the right of High) and listing them down in a row
You can adjust the X coordinates in the future with BARINDEX+3 for example (3 is the bars quantity in the future)
Same goes for Y axis in price, for example:
close + 10 * pointsize //10 points above current close
Tnx mate.
If my indicator as a result of division of 2 numbers return a decimal number say 9.123 (3 decimals), is there a way I can make it return 6 decimals?
Hi Nicolas,
The below code resets the VWAP at the start of every trading day (say at 00:00 midnight).
d = max(1, intradaybarindex)
VWAP = SUMMATION[d](volume*typicalprice)/SUMMATION[d](volume)
How do I make it reset every 2 trading days?