Hi Nicolas and other forum members,
The attached code draws high and low points on the chart.
How do I amend it using drawsegment command so that:
- it connects the last 2 high points and the last 2 low points on the chart ONLY.
- every time a new 2 high and low points are formed, these new points are connected and the 2 old segment lines are automatically removed (i.e. code basically draws the latest 2 high and 2 low points continually)
Any assistance is appreciated.
Walid
Would you mind add the code in readable format in your next post please? Should be easier to help.
If a graphical component has been plotted, it cannot be erased. But there are some tricks to do it, that’s why I need to explore your code, but preferably on the forum, thank you.
TH=max(high,close[1])

TL=min(low,close[1])

r=0

e=1

r=strength

if high[r]>highest[r](TH) then

e=1

while high[r]=high[r+e] do

e=e+1

wend

if high[r]>highest[r](TH[r+e]) then

HiPoint = high[r]

endif

Endif

if low[r]<lowest[r](TL) then

e=1

while low[r]=low[r+e] do

e=e+1

wend

if low[r]<lowest[r](TL[r+e]) then

LoPoint = low[r]

endif

endif


return HiPoint as "SupplyLine", LoPoint as "DemandLine"
Do you want the lines to be plotted also in the price history or only about the current supply and demand zones?
No only the current supply and demand zones (i.e. always lines connecting the highs and lows of latest 2 supply lines and 2 demand lines only.
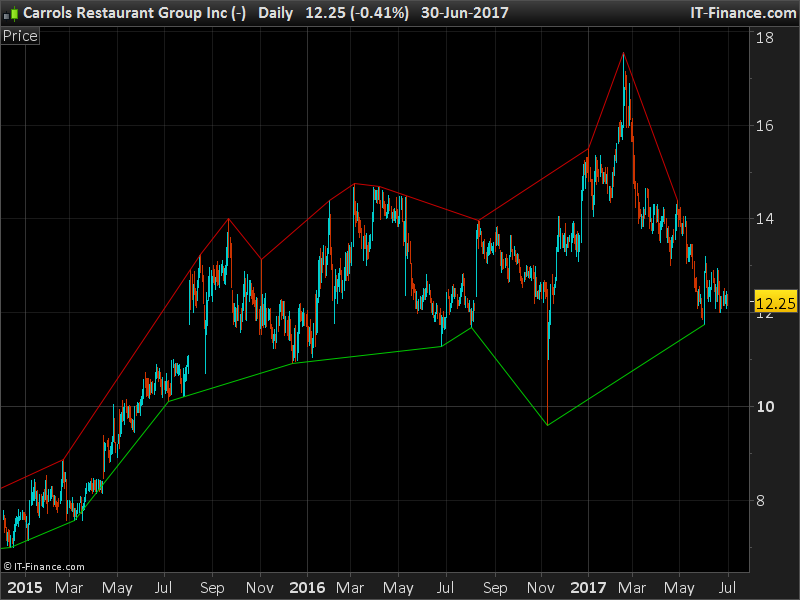
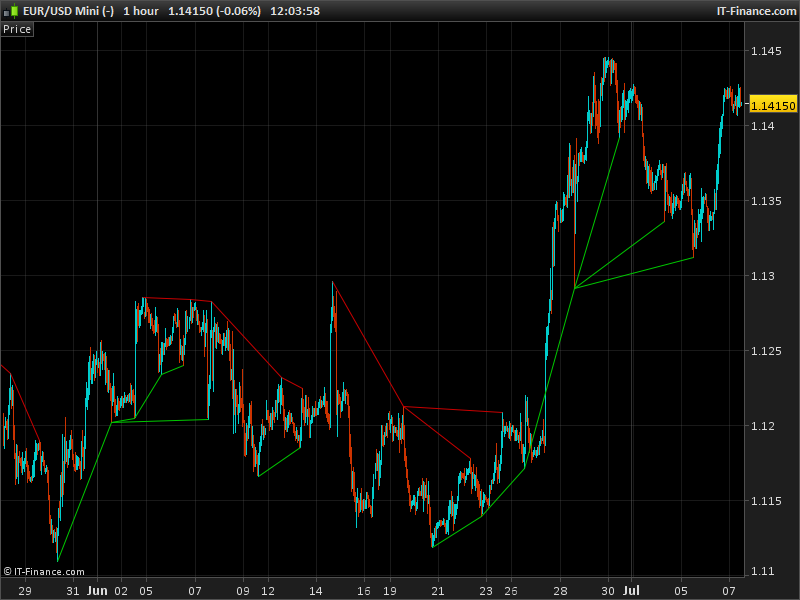
This is how it looks now. Segments are plotted between the 2 last tow detected Highs and Lows. As I said previously, the plotted lines can’t be erased.
//defparam drawonlastbaronly=true
//defparam calculateonlastbars=200

strength=20

TH=max(high,close[1])
TL=min(low,close[1])
r=0
e=1

r=strength

if high[r]>highest[r](TH) then
e=1

while high[r]=high[r+e] do
e=e+1
wend

if high[r]>highest[r](TH[r+e]) then

HiPoint = high[r]
HiBar = barindex[r]
drawsegment(HiBar[1],HiPoint[1],HiBar,HiPoint) coloured(200,0,0)
endif

Endif

if low[r]<lowest[r](TL) then

e=1
while low[r]=low[r+e] do
e=e+1
wend

if low[r]<lowest[r](TL[r+e]) then

LoPoint = low[r]
LoBar = barindex[r]
drawsegment(LoBar[1],LoPoint[1],LoBar,LoPoint) coloured(0,200,0)
endif

endif

return //HiPoint as "SupplyLine", LoPoint as "DemandLine"
Hi Nicolas,
Thank you for posting amended code.
You are almost there.
One final change that needs to be made: the segment lines need to connect the current HiPoint with the first preceding HiPoint before it that is HIGHER than the current HiPoint and same for LoPoint segment, the segment lines need to connect the current LoPoint with the first preceding LoPoint before it that is LOWER than the current LoPoint
So you want to draw triangle, right?
Yes you can call it a triangle if you like. Basically I want to connect the high of the most current HiPoint on the chart with the high of the first Hipoint before it that is higher than it. It must be higher than it. Same for lopoints
Ok but the “first preceding HiPoint” is not necessarily the previous one, it could be the 3rd ones from now, right?
ok that’s a bit tricky, we’ll have to make a loop through history. Let’s see what can I do!
This is what I made so far. It works, but as you can see, sometimes the last high or low points in the past are used several times. In this code we are not fetching through the whole history but only in the last “length * 5” bars, you can change this factor of course.
Looks good but you forgot to post the code 🙂 can you post the code please for the changes you made?
Before posting it I wanted to be sure this was in accordance with your query, here is the code:
strength=20
lookback=strength*5

TH=max(high,close[1])
TL=min(low,close[1])
r=0
e=1

r=strength

if high[r]>highest[r](TH) then
e=1
while high[r]=high[r+e] do
e=e+1
wend
if high[r]>highest[r](TH[r+e]) then
HiPoint = high[r]
HiBar = barindex[r]

for i = 1 to lookback do
if hibar[i]<>hibar then
if hipoint[i]>hipoint then
drawsegment(HiBar[i],HiPoint[i],HiBar,HiPoint) coloured(200,0,0)
break
endif
endif
next
endif
Endif

if low[r]<lowest[r](TL) then
e=1
while low[r]=low[r+e] do
e=e+1
wend
if low[r]<lowest[r](TL[r+e]) then
LoPoint = low[r]
LoBar = barindex[r]

for i = 1 to lookback do
if lobar[i]<>lobar then
if lopoint[i]<lopoint then
drawsegment(loBar[i],loPoint[i],loBar,loPoint) coloured(0,200,0)
break
endif
endif
next
endif
endif

return