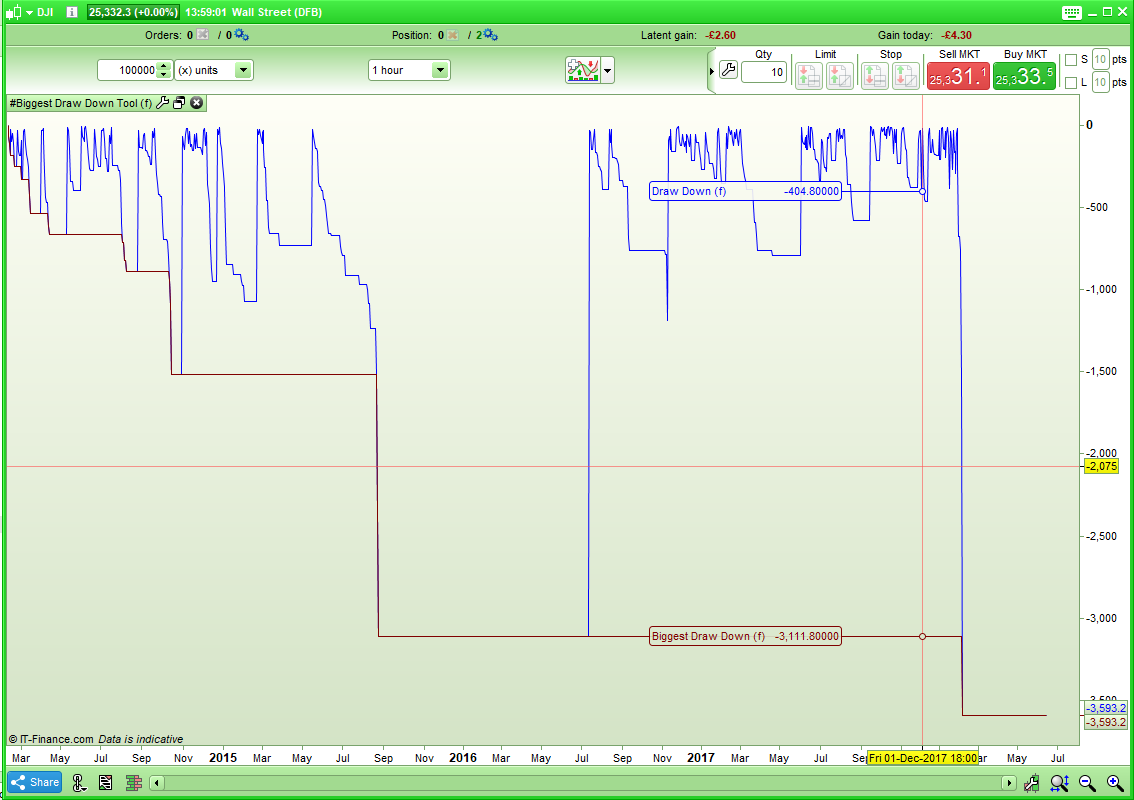
I think drawdowns and the ability to cope with it is something you learn from experience.
We are all humans and the psychology is a big factor here. Some are built for risk-taking, some get sick from taking risks. personally im a sensitive kinda guy with lots of feelings, my stomach has twisted and turned so much that i had to remove myself from the trading-equation! So i started with algos and that has helped me alot.
when you read books about trading (f example market wizards or “how i lost 1 million dollars” (RECOMMENDED!!) you get to hear about the same emotions and feelings that you go through, EVERYONE goes through them, even traders with 40+ years experience, feel the pain when trades are going against you.
And the ONLY way to survive in this trading-world is to have something that you can repeat and that continues to give profitable trades. If you have a strategy that does this for you, you need to backtest, check it, optimize it, keep shit tight and sturdy and when your 100% sure everything is as good as you can make them for now: you run it in demo 1-2 months. If everything feels right and the strategy (win or loose) does exactly what its suppose to do, you run it live! WITH CONFIDENCE!! 🙂
shugParticipant
Junior
Most of the ‘trading system sellers’ out there are ‘dealing’ with drawdowns in there accounts by selling bogus systems!, probably make more money selling those systems to poor souls like me LOL
If anyone out there with a high degree of success and consistency in the markets has a heart pleeeeeeeeeeeeeeeze share with me this scarce commodity.
I thought that I would bring this thread back to life!
I have been thinking about draw down and how to avoid it and then I got to thinking it would be quite useful to know what the maximum draw down for a market has historically been. At least that way we have something to gauge our own strategies draw down against. So I wrote this very simple strategy. Run it on any market on any time frame and the draw down in your results will be the maximum draw down for your available data. This can be displayed as a value or a percentage of the closing price.
There are two graph lines. One is the biggest all time draw down and the other is the current draw down which is valid until a new all time high is made.
ITF file also attached.
[attachment file=73099]
// Biggest Draw Down Analysis Tool
//By Vonasi
//13 June 2018
//Percentage = 0
IF High > lastHigh then
LowestLow = low
LastHigh = high
ENDIF
IF High < LastHigh then
LowestLow = Min(LowestLow,low)
DrawDown = LastHigh - LowestLow
BiggestDD = Max(BiggestDD, DrawDown)
endif
IF Percentage then
DrawDownRes = (DrawDown/close)*100
BiggestDDRes = (BiggestDD/close)*100
ELSE
DrawDownRes = DrawDown
BiggestDDRes = BiggestDD
ENDIF
return -DrawDownRes coloured(0,0,255) as "Draw Down", -BiggestDDRes coloured(128,0,0) as "Biggest Draw Down"
Added as row 38 to here Snippet Link Library
Now – if I only had a pound for every snippet in the library?