Expert Services

No recent search

Distribution Of Returns Indicator
- Forums
- ProRealTime English Forum
- ProBuilder: Indicators & Custom Tools
- Distribution Of Returns Indicator
-
AuthorPosts
-
After reading this:
https://www.managedfuturesinvesting.com/analyzing-a-ctas-daily-returns-part-1/
I decided to try to code a distribution of returns indicator. I post it here in case it of any use to anyone.
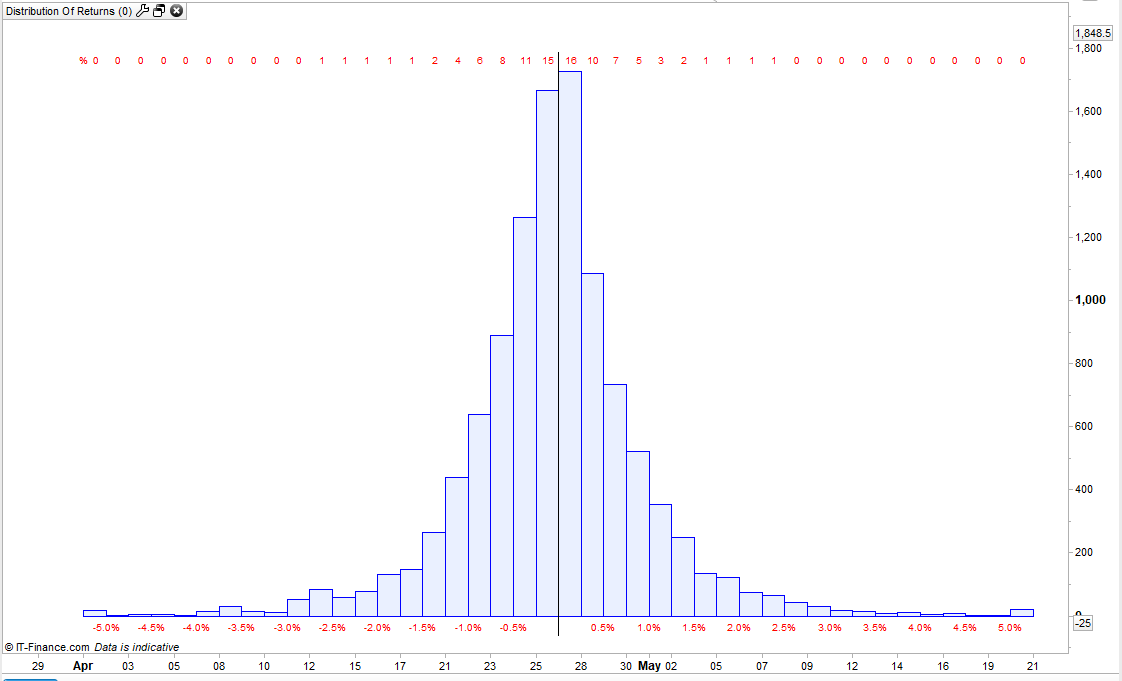
The indicator checks all the candles between the latest one and whatever start date you set (or all candles if you set StartDate to zero) and calculates the rate of return from close to close of each candle. It then counts how many candles fit into each specific range (in buckets of 0.25%) from -5% return to +5% return and displays it as a bar chart.
The values above the bars represent the (rounded) percentage of candles whose return fell into that specific range.
The values below the chart indicates rate of return. Each bar represents a 0.25% range of return (so 0.0% to 0.25% then 0.25% to 0.5% and so on). The bars at either end of the chart represent returns greater than 5% and returns lower than -5%.
//Distribution Of Returns Indicator //Coded by Vonasi //Date 20190221 defparam drawonlastbaronly = true //startdate = 20170101 //Set to zero to analyse all dates. if opendate >= startdate or startdate = 0 then dailyreturn = ((close[1] - close) / close[1]) * 100 if dailyreturn >= 0 and dailyreturn < 0.25 then dr025 = dr025 + 1 endif if dailyreturn >= 0.25 and dailyreturn < 0.50 then dr050 = dr050 + 1 endif if dailyreturn >= 0.50 and dailyreturn < 0.75 then dr075 = dr075 + 1 endif if dailyreturn >= 0.75 and dailyreturn < 1.00 then dr100 = dr100 + 1 endif if dailyreturn >= 1 and dailyreturn < 1.25 then dr125 = dr125 + 1 endif if dailyreturn >= 1.25 and dailyreturn < 1.50 then dr150 = dr150 + 1 endif if dailyreturn >= 1.55 and dailyreturn < 1.75 then dr175 = dr175 + 1 endif if dailyreturn >= 1.75 and dailyreturn < 2.00 then dr200 = dr200 + 1 endif if dailyreturn >= 2.00 and dailyreturn < 2.25 then dr225 = dr225 + 1 endif if dailyreturn >= 2.25 and dailyreturn < 2.50 then dr250 = dr250 + 1 endif if dailyreturn >= 2.50 and dailyreturn < 2.75 then dr275 = dr275 + 1 endif if dailyreturn >= 2.75 and dailyreturn < 3.00 then dr300 = dr300 + 1 endif if dailyreturn >= 3.00 and dailyreturn < 3.25 then dr325 = dr325 + 1 endif if dailyreturn >= 3.25 and dailyreturn < 3.50 then dr350 = dr350 + 1 endif if dailyreturn >= 3.50 and dailyreturn < 3.75 then dr375 = dr375 + 1 endif if dailyreturn >= 3.75 and dailyreturn < 4.00 then dr400 = dr400 + 1 endif if dailyreturn >= 4.00 and dailyreturn < 4.25 then dr425 = dr425 + 1 endif if dailyreturn >= 4.25 and dailyreturn < 4.50 then dr450 = dr450 + 1 endif if dailyreturn >= 4.50 and dailyreturn < 4.75 then dr475 = dr475 + 1 endif if dailyreturn >= 4.75 and dailyreturn < 5.00 then dr500 = dr500 + 1 endif if dailyreturn >= 5.00 then dr525 = dr525 + 1 endif if dailyreturn < 0 and dailyreturn > -0.25 then dr025n = dr025n + 1 endif if dailyreturn <= -0.25 and dailyreturn > -0.50 then dr050n = dr050n + 1 endif if dailyreturn <= -0.50 and dailyreturn > -0.75 then dr075n = dr075n + 1 endif if dailyreturn <= -0.75 and dailyreturn > -1.00 then dr100n = dr100n + 1 endif if dailyreturn <= -1 and dailyreturn > -1.25 then dr125n = dr125n + 1 endif if dailyreturn <= -1.25 and dailyreturn > -1.50 then dr150n = dr150n + 1 endif if dailyreturn <= -1.55 and dailyreturn > -1.75 then dr175n = dr175n + 1 endif if dailyreturn <= -1.75 and dailyreturn > -2.00 then dr200n = dr200n + 1 endif if dailyreturn <= -2.00 and dailyreturn > -2.25 then dr225n = dr225n + 1 endif if dailyreturn <= -2.25 and dailyreturn > -2.50 then dr250n = dr250n + 1 endif if dailyreturn <= -2.50 and dailyreturn > -2.75 then dr275n = dr275n + 1 endif if dailyreturn <= -2.75 and dailyreturn > -3.00 then dr300n = dr300n + 1 endif if dailyreturn <= -3.00 and dailyreturn > -3.25 then dr325n = dr325n + 1 endif if dailyreturn <= -3.25 and dailyreturn > -3.50 then dr350n = dr350n + 1 endif if dailyreturn <= -2.50 and dailyreturn > -2.75 then dr275n = dr275n + 1 endif if dailyreturn <= -2.75 and dailyreturn > -3.00 then dr300n = dr300n + 1 endif if dailyreturn <= -3.00 and dailyreturn > 3.25 then dr325n = dr325n + 1 endif if dailyreturn <= -3.25 and dailyreturn > -3.75 then dr375n = dr375n + 1 endif if dailyreturn <= -3.75 and dailyreturn > -4.00 then dr400n = dr400n + 1 endif if dailyreturn <= -4.00 and dailyreturn > -4.25 then dr425n = dr425n + 1 endif if dailyreturn <= -4.25 and dailyreturn > -4.50 then dr450n = dr450n + 1 endif if dailyreturn <= -4.50 and dailyreturn > -4.75 then dr475n = dr475n + 1 endif if dailyreturn <= -4.75 and dailyreturn > -5.00 then dr500n = dr500n + 1 endif if dailyreturn <= -5.00 then dr525n = dr525n + 1 endif total = total + 1 upperline = max(dr025,dr025n) * 1.02 lowerline = 0 - (upperline * 0.02) endif dr525perc = round((dr525 / total) * 100) dr500perc = round((dr500 / total) * 100) dr475perc = round((dr475 / total) * 100) dr450perc = round((dr450 / total) * 100) dr425perc = round((dr425 / total) * 100) dr400perc = round((dr400 / total) * 100) dr375perc = round((dr375 / total) * 100) dr350perc = round((dr350 / total) * 100) dr325perc = round((dr325 / total) * 100) dr300perc = round((dr300 / total) * 100) dr275perc = round((dr275 / total) * 100) dr250perc = round((dr250 / total) * 100) dr225perc = round((dr225 / total) * 100) dr200perc = round((dr200 / total) * 100) dr175perc = round((dr175 / total) * 100) dr150perc = round((dr150 / total) * 100) dr125perc = round((dr125 / total) * 100) dr100perc = round((dr100 / total) * 100) dr075perc = round((dr075 / total) * 100) dr050perc = round((dr050 / total) * 100) dr025perc = round((dr025 / total) * 100) dr525nperc = round((dr525n / total) * 100) dr500nperc = round((dr500n / total) * 100) dr475nperc = round((dr475n / total) * 100) dr450nperc = round((dr450n / total) * 100) dr425nperc = round((dr425n / total) * 100) dr400nperc = round((dr400n / total) * 100) dr375nperc = round((dr375n / total) * 100) dr350nperc = round((dr350n / total) * 100) dr325nperc = round((dr325n / total) * 100) dr300nperc = round((dr300n / total) * 100) dr275nperc = round((dr275n / total) * 100) dr250nperc = round((dr250n / total) * 100) dr225nperc = round((dr225n / total) * 100) dr200nperc = round((dr200n / total) * 100) dr175nperc = round((dr175n / total) * 100) dr150nperc = round((dr150n / total) * 100) dr125nperc = round((dr125n / total) * 100) dr100nperc = round((dr100n / total) * 100) dr075nperc = round((dr075n / total) * 100) dr050nperc = round((dr050n / total) * 100) dr025nperc = round((dr025n / total) * 100) dr025nperc = round((dr025n / total) * 100) drawrectangle(barindex-1,0,barindex,dr525) coloured(0,0,255) drawrectangle(barindex-2,0,barindex-1,dr500) coloured(0,0,255) drawrectangle(barindex-3,0,barindex-2,dr475) coloured(0,0,255) drawrectangle(barindex-4,0,barindex-3,dr450) coloured(0,0,255) drawrectangle(barindex-5,0,barindex-4,dr425) coloured(0,0,255) drawrectangle(barindex-6,0,barindex-5,dr400) coloured(0,0,255) drawrectangle(barindex-7,0,barindex-6,dr375) coloured(0,0,255) drawrectangle(barindex-8,0,barindex-7,dr350) coloured(0,0,255) drawrectangle(barindex-9,0,barindex-8,dr325) coloured(0,0,255) drawrectangle(barindex-10,0,barindex-9,dr300) coloured(0,0,255) drawrectangle(barindex-11,0,barindex-10,dr275) coloured(0,0,255) drawrectangle(barindex-12,0,barindex-11,dr250) coloured(0,0,255) drawrectangle(barindex-13,0,barindex-12,dr225) coloured(0,0,255) drawrectangle(barindex-14,0,barindex-13,dr200) coloured(0,0,255) drawrectangle(barindex-15,0,barindex-14,dr175) coloured(0,0,255) drawrectangle(barindex-16,0,barindex-15,dr150) coloured(0,0,255) drawrectangle(barindex-17,0,barindex-16,dr125) coloured(0,0,255) drawrectangle(barindex-18,0,barindex-17,dr100) coloured(0,0,255) drawrectangle(barindex-19,0,barindex-18,dr075) coloured(0,0,255) drawrectangle(barindex-20,0,barindex-19,dr050) coloured(0,0,255) drawrectangle(barindex-21,0,barindex-20,dr025) coloured(0,0,255) drawrectangle(barindex-22,0,barindex-21,dr025n) coloured(0,0,255) drawrectangle(barindex-23,0,barindex-22,dr050n) coloured(0,0,255) drawrectangle(barindex-24,0,barindex-23,dr075n) coloured(0,0,255) drawrectangle(barindex-25,0,barindex-24,dr100n) coloured(0,0,255) drawrectangle(barindex-26,0,barindex-25,dr125n) coloured(0,0,255) drawrectangle(barindex-27,0,barindex-26,dr150n) coloured(0,0,255) drawrectangle(barindex-28,0,barindex-27,dr175n) coloured(0,0,255) drawrectangle(barindex-29,0,barindex-28,dr200n) coloured(0,0,255) drawrectangle(barindex-30,0,barindex-29,dr225n) coloured(0,0,255) drawrectangle(barindex-31,0,barindex-30,dr250n) coloured(0,0,255) drawrectangle(barindex-32,0,barindex-31,dr275n) coloured(0,0,255) drawrectangle(barindex-33,0,barindex-32,dr300n) coloured(0,0,255) drawrectangle(barindex-34,0,barindex-33,dr325n) coloured(0,0,255) drawrectangle(barindex-35,0,barindex-34,dr350n) coloured(0,0,255) drawrectangle(barindex-36,0,barindex-35,dr375n) coloured(0,0,255) drawrectangle(barindex-37,0,barindex-36,dr400n) coloured(0,0,255) drawrectangle(barindex-38,0,barindex-37,dr425n) coloured(0,0,255) drawrectangle(barindex-39,0,barindex-38,dr450n) coloured(0,0,255) drawrectangle(barindex-40,0,barindex-39,dr475n) coloured(0,0,255) drawrectangle(barindex-41,0,barindex-40,dr500n) coloured(0,0,255) drawrectangle(barindex-42,0,barindex-41,dr525n) coloured(0,0,255) drawtext("#dr525perc# ",barindex,upperline) coloured(255,0,0) drawtext("#dr500perc# ",barindex-1,upperline) coloured(255,0,0) drawtext("#dr475perc# ",barindex-2,upperline) coloured(255,0,0) drawtext("#dr450perc# ",barindex-3,upperline) coloured(255,0,0) drawtext("#dr425perc# ",barindex-4,upperline) coloured(255,0,0) drawtext("#dr400perc# ",barindex-5,upperline) coloured(255,0,0) drawtext("#dr375perc# ",barindex-6,upperline) coloured(255,0,0) drawtext("#dr350perc# ",barindex-7,upperline) coloured(255,0,0) drawtext("#dr325perc# ",barindex-8,upperline) coloured(255,0,0) drawtext("#dr300perc# ",barindex-9,upperline) coloured(255,0,0) drawtext("#dr275perc# ",barindex-10,upperline) coloured(255,0,0) drawtext("#dr250perc# ",barindex-11,upperline) coloured(255,0,0) drawtext("#dr225perc# ",barindex-12,upperline) coloured(255,0,0) drawtext("#dr200perc# ",barindex-13,upperline) coloured(255,0,0) drawtext("#dr175perc# ",barindex-14,upperline) coloured(255,0,0) drawtext("#dr150perc# ",barindex-15,upperline) coloured(255,0,0) drawtext("#dr125perc# ",barindex-16,upperline) coloured(255,0,0) drawtext("#dr100perc# ",barindex-17,upperline) coloured(255,0,0) drawtext("#dr075perc# ",barindex-18,upperline) coloured(255,0,0) drawtext("#dr050perc# ",barindex-19,upperline) coloured(255,0,0) drawtext("#dr025perc# ",barindex-20,upperline) coloured(255,0,0) drawtext("#dr525nperc# ",barindex-41,upperline) coloured(255,0,0) drawtext("#dr500nperc# ",barindex-40,upperline) coloured(255,0,0) drawtext("#dr475nperc# ",barindex-39,upperline) coloured(255,0,0) drawtext("#dr450nperc# ",barindex-38,upperline) coloured(255,0,0) drawtext("#dr425nperc# ",barindex-37,upperline) coloured(255,0,0) drawtext("#dr400nperc# ",barindex-36,upperline) coloured(255,0,0) drawtext("#dr375nperc# ",barindex-35,upperline) coloured(255,0,0) drawtext("#dr350nperc# ",barindex-34,upperline) coloured(255,0,0) drawtext("#dr325nperc# ",barindex-33,upperline) coloured(255,0,0) drawtext("#dr300nperc# ",barindex-32,upperline) coloured(255,0,0) drawtext("#dr275nperc# ",barindex-31,upperline) coloured(255,0,0) drawtext("#dr250nperc# ",barindex-30,upperline) coloured(255,0,0) drawtext("#dr225nperc# ",barindex-29,upperline) coloured(255,0,0) drawtext("#dr200nperc# ",barindex-28,upperline) coloured(255,0,0) drawtext("#dr175nperc# ",barindex-27,upperline) coloured(255,0,0) drawtext("#dr150nperc# ",barindex-26,upperline) coloured(255,0,0) drawtext("#dr125nperc# ",barindex-25,upperline) coloured(255,0,0) drawtext("#dr100nperc# ",barindex-24,upperline) coloured(255,0,0) drawtext("#dr075nperc# ",barindex-23,upperline) coloured(255,0,0) drawtext("#dr050nperc# ",barindex-22,upperline) coloured(255,0,0) drawtext("#dr025nperc# ",barindex-21,upperline) coloured(255,0,0) drawtext("5.0%",barindex-1,lowerline) coloured(255,0,0) drawtext("4.5%",barindex-3,lowerline) coloured(255,0,0) drawtext("4.0%",barindex-5,lowerline) coloured(255,0,0) drawtext("3.5%",barindex-7,lowerline) coloured(255,0,0) drawtext("3.0%",barindex-9,lowerline) coloured(255,0,0) drawtext("2.5%",barindex-11,lowerline) coloured(255,0,0) drawtext("2.0%",barindex-13,lowerline) coloured(255,0,0) drawtext("1.5%",barindex-15,lowerline) coloured(255,0,0) drawtext("1.0%",barindex-17,lowerline) coloured(255,0,0) drawtext("0.5%",barindex-19,lowerline) coloured(255,0,0) drawtext("-5.0%",barindex-41,lowerline) coloured(255,0,0) drawtext("-4.5%",barindex-39,lowerline) coloured(255,0,0) drawtext("-4.0%",barindex-37,lowerline) coloured(255,0,0) drawtext("-3.5%",barindex-35,lowerline) coloured(255,0,0) drawtext("-3.0%",barindex-33,lowerline) coloured(255,0,0) drawtext("-2.5%",barindex-31,lowerline) coloured(255,0,0) drawtext("-2.0%",barindex-29,lowerline) coloured(255,0,0) drawtext("-1.5%",barindex-27,lowerline) coloured(255,0,0) drawtext("-1.0%",barindex-25,lowerline) coloured(255,0,0) drawtext("-0.5%",barindex-23,lowerline) coloured(255,0,0) drawtext("%",barindex-42,upperline) coloured(255,0,0) drawsegment(barindex-21,lowerline-25,barindex-21,upperline+25)COLOURED(0,0,0) return upperline*1.05 coloured(0,0,0,0) as "-", -25 coloured(0,0,0,0) as "-"Nice bell curve! well done 🙂
I have a few ideas to add to it like maybe an indication of where current price is on the bell curve. If I manage to find time to develop it a bit further and it looks useful then I will post it to the library.
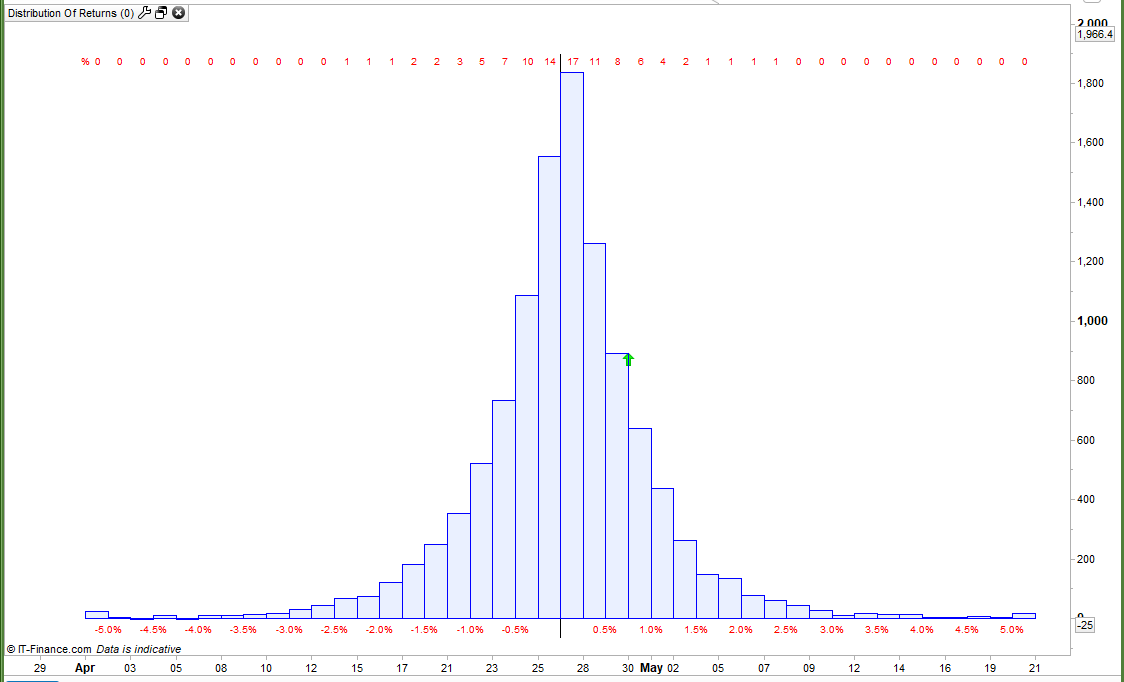
Wilko thanked this postI really shouldn’t rush to post stuff! In the process of trying to improve this indicator I spotted a major flaw in the calculation of returns and a mass of typos due to cut and paste. Please ignore the previously posted code and ITF file as it is pants!
Here is a new and improved (correct I hope) version with not only the corrections but it also draws an arrow to show in which bucket the latest bar on the charts return is on the chart.
//Distribution Of Returns Indicator v1.1 //Coded by Vonasi //Date 20190221 defparam drawonlastbaronly = true //startdate = 20170101 //Set to zero to analyse all dates. if opendate >= startdate or startdate = 0 then dailyreturn = ((close - close[1]) / close[1]) * 100 t = 0 if dailyreturn >= 0 and dailyreturn < 0.25 then dr025 = dr025 + 1 x = barindex - 20 y = dr025 t = 1 endif if dailyreturn >= 0.25 and dailyreturn < 0.50 then dr050 = dr050 + 1 x = barindex - 19 y = dr050 t = 1 endif if dailyreturn >= 0.50 and dailyreturn < 0.75 then dr075 = dr075 + 1 x = barindex - 18 y = dr075 t = 1 endif if dailyreturn >= 0.75 and dailyreturn < 1.00 then dr100 = dr100 + 1 x = barindex - 17 y = dr100 t = 1 endif if dailyreturn >= 1 and dailyreturn < 1.25 then dr125 = dr125 + 1 x = barindex - 16 y = dr125 t = 1 endif if dailyreturn >= 1.25 and dailyreturn < 1.50 then dr150 = dr150 + 1 x = barindex - 15 y = dr150 t = 1 endif if dailyreturn >= 1.50 and dailyreturn < 1.75 then dr175 = dr175 + 1 x = barindex - 14 y = dr175 t = 1 endif if dailyreturn >= 1.75 and dailyreturn < 2.00 then dr200 = dr200 + 1 x = barindex - 13 y = dr200 t = 1 endif if dailyreturn >= 2.00 and dailyreturn < 2.25 then dr225 = dr225 + 1 x = barindex - 12 y = dr225 t = 1 endif if dailyreturn >= 2.25 and dailyreturn < 2.50 then dr250 = dr250 + 1 x = barindex - 11 y = dr250 t = 1 endif if dailyreturn >= 2.50 and dailyreturn < 2.75 then dr275 = dr275 + 1 x = barindex - 10 y = dr275 t = 1 endif if dailyreturn >= 2.75 and dailyreturn < 3.00 then dr300 = dr300 + 1 x = barindex - 9 y = dr300 t = 1 endif if dailyreturn >= 3.00 and dailyreturn < 3.25 then dr325 = dr325 + 1 x = barindex - 8 y = dr325 t = 1 endif if dailyreturn >= 3.25 and dailyreturn < 3.50 then dr350 = dr350 + 1 x = barindex - 7 y = dr350 t = 1 endif if dailyreturn >= 3.50 and dailyreturn < 3.75 then dr375 = dr375 + 1 x = barindex - 6 y = dr375 t = 1 endif if dailyreturn >= 3.75 and dailyreturn < 4.00 then dr400 = dr400 + 1 x = barindex - 5 y = dr400 t = 1 endif if dailyreturn >= 4.00 and dailyreturn < 4.25 then dr425 = dr425 + 1 x = barindex - 4 y = dr425 t = 1 endif if dailyreturn >= 4.25 and dailyreturn < 4.50 then dr450 = dr450 + 1 x = barindex - 3 y = dr450 t = 1 endif if dailyreturn >= 4.50 and dailyreturn < 4.75 then dr475 = dr475 + 1 x = barindex - 2 y = dr475 t = 1 endif if dailyreturn >= 4.75 and dailyreturn < 5.00 then dr500 = dr500 + 1 x = barindex - 1 y = dr500 t = 1 endif if dailyreturn >= 5.00 then dr525 = dr525 + 1 x = barindex y = dr525 t = 1 endif if dailyreturn < 0 and dailyreturn > -0.25 then dr025n = dr025n + 1 x = barindex - 22 y = dr025n t = -1 endif if dailyreturn <= -0.25 and dailyreturn > -0.50 then dr050n = dr050n + 1 x = barindex - 23 y = dr050n t = -1 endif if dailyreturn <= -0.50 and dailyreturn > -0.75 then dr075n = dr075n + 1 x = barindex - 24 y = dr075n t = -1 endif if dailyreturn <= -0.75 and dailyreturn > -1.00 then dr100n = dr100n + 1 x = barindex - 25 y = dr100n t = -1 endif if dailyreturn <= -1.00 and dailyreturn > -1.25 then dr125n = dr125n + 1 x = barindex - 26 y = dr125 t = -1 endif if dailyreturn <= -1.25 and dailyreturn > -1.50 then dr150n = dr150n + 1 x = barindex - 27 y = dr150n t = -1 endif if dailyreturn <= -1.50 and dailyreturn > -1.75 then dr175n = dr175n + 1 x = barindex - 28 y = dr175n t = -1 endif if dailyreturn <= -1.75 and dailyreturn > -2.00 then dr200n = dr200n + 1 x = barindex - 29 y = dr200n t = -1 endif if dailyreturn <= -2.00 and dailyreturn > -2.25 then dr225n = dr225n + 1 x = barindex - 30 y = dr225n t = -1 endif if dailyreturn <= -2.25 and dailyreturn > -2.50 then dr250n = dr250n + 1 x = barindex - 31 y = dr250n t = -1 endif if dailyreturn <= -2.50 and dailyreturn > -2.75 then dr275n = dr275n + 1 x = barindex - 32 y = dr275n t = -1 endif if dailyreturn <= -2.75 and dailyreturn > -3.00 then dr300n = dr300n + 1 x = barindex - 33 y = dr300n t = -1 endif if dailyreturn <= -3.00 and dailyreturn > -3.25 then dr325n = dr325n + 1 x = barindex - 34 y = dr325n t = -1 endif if dailyreturn <= -3.25 and dailyreturn > -3.50 then dr350n = dr350n + 1 x = barindex - 35 y = dr350n t = -1 endif if dailyreturn <= -3.50 and dailyreturn > -3.75 then dr375n = dr375n + 1 x = barindex - 36 y = dr375n t = -1 endif if dailyreturn <= -3.75 and dailyreturn > -4.00 then dr400n = dr400n + 1 x = barindex - 37 y = dr400n t = -1 endif if dailyreturn <= -4.00 and dailyreturn > -4.25 then dr425n = dr425n + 1 x = barindex - 38 y = dr425n t = -1 endif if dailyreturn <= -4.25 and dailyreturn > -4.50 then dr450n = dr450n + 1 x = barindex - 39 y = dr450n t = -1 endif if dailyreturn <= -4.50 and dailyreturn > -4.75 then dr475n = dr475n + 1 x = barindex - 40 y = dr475n t = -1 endif if dailyreturn <= -4.75 and dailyreturn > -5.00 then dr500n = dr500n + 1 x = barindex - 41 y = dr500n t = -1 endif if dailyreturn <= -5.00 then dr525n = dr525n + 1 x = barindex - 42 y = dr525n t = -1 endif total = total + 1 upperline = max(dr025,dr025n) * 1.02 lowerline = 0 - (upperline * 0.02) endif dr525perc = round((dr525 / total) * 100) dr500perc = round((dr500 / total) * 100) dr475perc = round((dr475 / total) * 100) dr450perc = round((dr450 / total) * 100) dr425perc = round((dr425 / total) * 100) dr400perc = round((dr400 / total) * 100) dr375perc = round((dr375 / total) * 100) dr350perc = round((dr350 / total) * 100) dr325perc = round((dr325 / total) * 100) dr300perc = round((dr300 / total) * 100) dr275perc = round((dr275 / total) * 100) dr250perc = round((dr250 / total) * 100) dr225perc = round((dr225 / total) * 100) dr200perc = round((dr200 / total) * 100) dr175perc = round((dr175 / total) * 100) dr150perc = round((dr150 / total) * 100) dr125perc = round((dr125 / total) * 100) dr100perc = round((dr100 / total) * 100) dr075perc = round((dr075 / total) * 100) dr050perc = round((dr050 / total) * 100) dr025perc = round((dr025 / total) * 100) dr525nperc = round((dr525n / total) * 100) dr500nperc = round((dr500n / total) * 100) dr475nperc = round((dr475n / total) * 100) dr450nperc = round((dr450n / total) * 100) dr425nperc = round((dr425n / total) * 100) dr400nperc = round((dr400n / total) * 100) dr375nperc = round((dr375n / total) * 100) dr350nperc = round((dr350n / total) * 100) dr325nperc = round((dr325n / total) * 100) dr300nperc = round((dr300n / total) * 100) dr275nperc = round((dr275n / total) * 100) dr250nperc = round((dr250n / total) * 100) dr225nperc = round((dr225n / total) * 100) dr200nperc = round((dr200n / total) * 100) dr175nperc = round((dr175n / total) * 100) dr150nperc = round((dr150n / total) * 100) dr125nperc = round((dr125n / total) * 100) dr100nperc = round((dr100n / total) * 100) dr075nperc = round((dr075n / total) * 100) dr050nperc = round((dr050n / total) * 100) dr025nperc = round((dr025n / total) * 100) dr025nperc = round((dr025n / total) * 100) drawrectangle(barindex-1,0,barindex,dr525) coloured(0,0,255) drawrectangle(barindex-2,0,barindex-1,dr500) coloured(0,0,255) drawrectangle(barindex-3,0,barindex-2,dr475) coloured(0,0,255) drawrectangle(barindex-4,0,barindex-3,dr450) coloured(0,0,255) drawrectangle(barindex-5,0,barindex-4,dr425) coloured(0,0,255) drawrectangle(barindex-6,0,barindex-5,dr400) coloured(0,0,255) drawrectangle(barindex-7,0,barindex-6,dr375) coloured(0,0,255) drawrectangle(barindex-8,0,barindex-7,dr350) coloured(0,0,255) drawrectangle(barindex-9,0,barindex-8,dr325) coloured(0,0,255) drawrectangle(barindex-10,0,barindex-9,dr300) coloured(0,0,255) drawrectangle(barindex-11,0,barindex-10,dr275) coloured(0,0,255) drawrectangle(barindex-12,0,barindex-11,dr250) coloured(0,0,255) drawrectangle(barindex-13,0,barindex-12,dr225) coloured(0,0,255) drawrectangle(barindex-14,0,barindex-13,dr200) coloured(0,0,255) drawrectangle(barindex-15,0,barindex-14,dr175) coloured(0,0,255) drawrectangle(barindex-16,0,barindex-15,dr150) coloured(0,0,255) drawrectangle(barindex-17,0,barindex-16,dr125) coloured(0,0,255) drawrectangle(barindex-18,0,barindex-17,dr100) coloured(0,0,255) drawrectangle(barindex-19,0,barindex-18,dr075) coloured(0,0,255) drawrectangle(barindex-20,0,barindex-19,dr050) coloured(0,0,255) drawrectangle(barindex-21,0,barindex-20,dr025) coloured(0,0,255) drawrectangle(barindex-22,0,barindex-21,dr025n) coloured(0,0,255) drawrectangle(barindex-23,0,barindex-22,dr050n) coloured(0,0,255) drawrectangle(barindex-24,0,barindex-23,dr075n) coloured(0,0,255) drawrectangle(barindex-25,0,barindex-24,dr100n) coloured(0,0,255) drawrectangle(barindex-26,0,barindex-25,dr125n) coloured(0,0,255) drawrectangle(barindex-27,0,barindex-26,dr150n) coloured(0,0,255) drawrectangle(barindex-28,0,barindex-27,dr175n) coloured(0,0,255) drawrectangle(barindex-29,0,barindex-28,dr200n) coloured(0,0,255) drawrectangle(barindex-30,0,barindex-29,dr225n) coloured(0,0,255) drawrectangle(barindex-31,0,barindex-30,dr250n) coloured(0,0,255) drawrectangle(barindex-32,0,barindex-31,dr275n) coloured(0,0,255) drawrectangle(barindex-33,0,barindex-32,dr300n) coloured(0,0,255) drawrectangle(barindex-34,0,barindex-33,dr325n) coloured(0,0,255) drawrectangle(barindex-35,0,barindex-34,dr350n) coloured(0,0,255) drawrectangle(barindex-36,0,barindex-35,dr375n) coloured(0,0,255) drawrectangle(barindex-37,0,barindex-36,dr400n) coloured(0,0,255) drawrectangle(barindex-38,0,barindex-37,dr425n) coloured(0,0,255) drawrectangle(barindex-39,0,barindex-38,dr450n) coloured(0,0,255) drawrectangle(barindex-40,0,barindex-39,dr475n) coloured(0,0,255) drawrectangle(barindex-41,0,barindex-40,dr500n) coloured(0,0,255) drawrectangle(barindex-42,0,barindex-41,dr525n) coloured(0,0,255) drawtext("#dr525perc# ",barindex,upperline) coloured(255,0,0) drawtext("#dr500perc# ",barindex-1,upperline) coloured(255,0,0) drawtext("#dr475perc# ",barindex-2,upperline) coloured(255,0,0) drawtext("#dr450perc# ",barindex-3,upperline) coloured(255,0,0) drawtext("#dr425perc# ",barindex-4,upperline) coloured(255,0,0) drawtext("#dr400perc# ",barindex-5,upperline) coloured(255,0,0) drawtext("#dr375perc# ",barindex-6,upperline) coloured(255,0,0) drawtext("#dr350perc# ",barindex-7,upperline) coloured(255,0,0) drawtext("#dr325perc# ",barindex-8,upperline) coloured(255,0,0) drawtext("#dr300perc# ",barindex-9,upperline) coloured(255,0,0) drawtext("#dr275perc# ",barindex-10,upperline) coloured(255,0,0) drawtext("#dr250perc# ",barindex-11,upperline) coloured(255,0,0) drawtext("#dr225perc# ",barindex-12,upperline) coloured(255,0,0) drawtext("#dr200perc# ",barindex-13,upperline) coloured(255,0,0) drawtext("#dr175perc# ",barindex-14,upperline) coloured(255,0,0) drawtext("#dr150perc# ",barindex-15,upperline) coloured(255,0,0) drawtext("#dr125perc# ",barindex-16,upperline) coloured(255,0,0) drawtext("#dr100perc# ",barindex-17,upperline) coloured(255,0,0) drawtext("#dr075perc# ",barindex-18,upperline) coloured(255,0,0) drawtext("#dr050perc# ",barindex-19,upperline) coloured(255,0,0) drawtext("#dr025perc# ",barindex-20,upperline) coloured(255,0,0) drawtext("#dr525nperc# ",barindex-41,upperline) coloured(255,0,0) drawtext("#dr500nperc# ",barindex-40,upperline) coloured(255,0,0) drawtext("#dr475nperc# ",barindex-39,upperline) coloured(255,0,0) drawtext("#dr450nperc# ",barindex-38,upperline) coloured(255,0,0) drawtext("#dr425nperc# ",barindex-37,upperline) coloured(255,0,0) drawtext("#dr400nperc# ",barindex-36,upperline) coloured(255,0,0) drawtext("#dr375nperc# ",barindex-35,upperline) coloured(255,0,0) drawtext("#dr350nperc# ",barindex-34,upperline) coloured(255,0,0) drawtext("#dr325nperc# ",barindex-33,upperline) coloured(255,0,0) drawtext("#dr300nperc# ",barindex-32,upperline) coloured(255,0,0) drawtext("#dr275nperc# ",barindex-31,upperline) coloured(255,0,0) drawtext("#dr250nperc# ",barindex-30,upperline) coloured(255,0,0) drawtext("#dr225nperc# ",barindex-29,upperline) coloured(255,0,0) drawtext("#dr200nperc# ",barindex-28,upperline) coloured(255,0,0) drawtext("#dr175nperc# ",barindex-27,upperline) coloured(255,0,0) drawtext("#dr150nperc# ",barindex-26,upperline) coloured(255,0,0) drawtext("#dr125nperc# ",barindex-25,upperline) coloured(255,0,0) drawtext("#dr100nperc# ",barindex-24,upperline) coloured(255,0,0) drawtext("#dr075nperc# ",barindex-23,upperline) coloured(255,0,0) drawtext("#dr050nperc# ",barindex-22,upperline) coloured(255,0,0) drawtext("#dr025nperc# ",barindex-21,upperline) coloured(255,0,0) drawtext("5.0%",barindex-1,lowerline) coloured(255,0,0) drawtext("4.5%",barindex-3,lowerline) coloured(255,0,0) drawtext("4.0%",barindex-5,lowerline) coloured(255,0,0) drawtext("3.5%",barindex-7,lowerline) coloured(255,0,0) drawtext("3.0%",barindex-9,lowerline) coloured(255,0,0) drawtext("2.5%",barindex-11,lowerline) coloured(255,0,0) drawtext("2.0%",barindex-13,lowerline) coloured(255,0,0) drawtext("1.5%",barindex-15,lowerline) coloured(255,0,0) drawtext("1.0%",barindex-17,lowerline) coloured(255,0,0) drawtext("0.5%",barindex-19,lowerline) coloured(255,0,0) drawtext("-5.0%",barindex-41,lowerline) coloured(255,0,0) drawtext("-4.5%",barindex-39,lowerline) coloured(255,0,0) drawtext("-4.0%",barindex-37,lowerline) coloured(255,0,0) drawtext("-3.5%",barindex-35,lowerline) coloured(255,0,0) drawtext("-3.0%",barindex-33,lowerline) coloured(255,0,0) drawtext("-2.5%",barindex-31,lowerline) coloured(255,0,0) drawtext("-2.0%",barindex-29,lowerline) coloured(255,0,0) drawtext("-1.5%",barindex-27,lowerline) coloured(255,0,0) drawtext("-1.0%",barindex-25,lowerline) coloured(255,0,0) drawtext("-0.5%",barindex-23,lowerline) coloured(255,0,0) drawtext("%",barindex-42,upperline) coloured(255,0,0) drawsegment(barindex-21,lowerline-25,barindex-21,upperline+25)COLOURED(0,0,0) if t = 1 then drawarrowup(x,y) coloured(0,255,0) endif if t = -1 then drawarrowdown(x,y) coloured(255,0,0) endif return upperline*1.05 coloured(0,0,0,0) as "-", -25 coloured(0,0,0,0) as "-"wonderful vonasi 😉
The indicator is now in the library and can be found here:
I spotted a typo in the code. There is a minus sign missing on line 274. I have edited the code in my previous post and Nicolas will amend the code and the ITF file in the library but anyone who has already downloaded the ITF file or cut and pasted the code should change line 274 to the following for the indicator to work correctly:
if dailyreturn <= -4.00 and dailyreturn > -4.25 thenWilko thanked this postVonassi,
I can see what you/ the code is doing. Seems like a Bell curve to me.
In all your comments I am missing WHY you developed it, and what it is meant to tell us as users.
Presumably if the curve is very steep and small, the underlying stock/indices/commodity are very stable with their price movements, which you also would expect with obligations.
When most of its area is on the right side (not sure if this can happen using your code), the stock is in an uptrend. And vice versa, when most of the area is on the left side, the stock is in a downtrend.
Looking forward for your comments what you can do with it and what the predictive value could be.
KR Jan
swapping thanked this postThe indicator simply shows how balanced a market is. The shape of the curve tells us this and more. Remember that the curve is created by checking close to close price movements. If the bars near the centre are all tall and the rest of the curve is flat then we can see that prices (close to close) don’t move very far from where they started. If however the curve is more triangular shaped then we can see that the market has a different characteristic and price closes over a larger range. Each bar tells us the probability of price closing so far from where it started.
The indicator is not really about trend as it needs a lot of candles to be analysed to get a curve so it is seriously lagging. If a curve is lop sided in shape then the we can see that maybe our downside risk is very different to our upside risk. If there are only one or two tall bars on the right of centre then we know that the probability of price closing at a distance of three or four bars away is seriously reduced and if there are lots of tall bars on the left of the centre line then we know that our downside risk is greater and deeper.
I have now created a version where you can vary the bar size. Having bucket sizes fixed at 0 to 0.25% then 0.25% to 0.50% is not ideal for all instruments. I have also created an automatic bar size calculator that the indicator can call so that it works out the best bucket size for any instrument that you use it on.
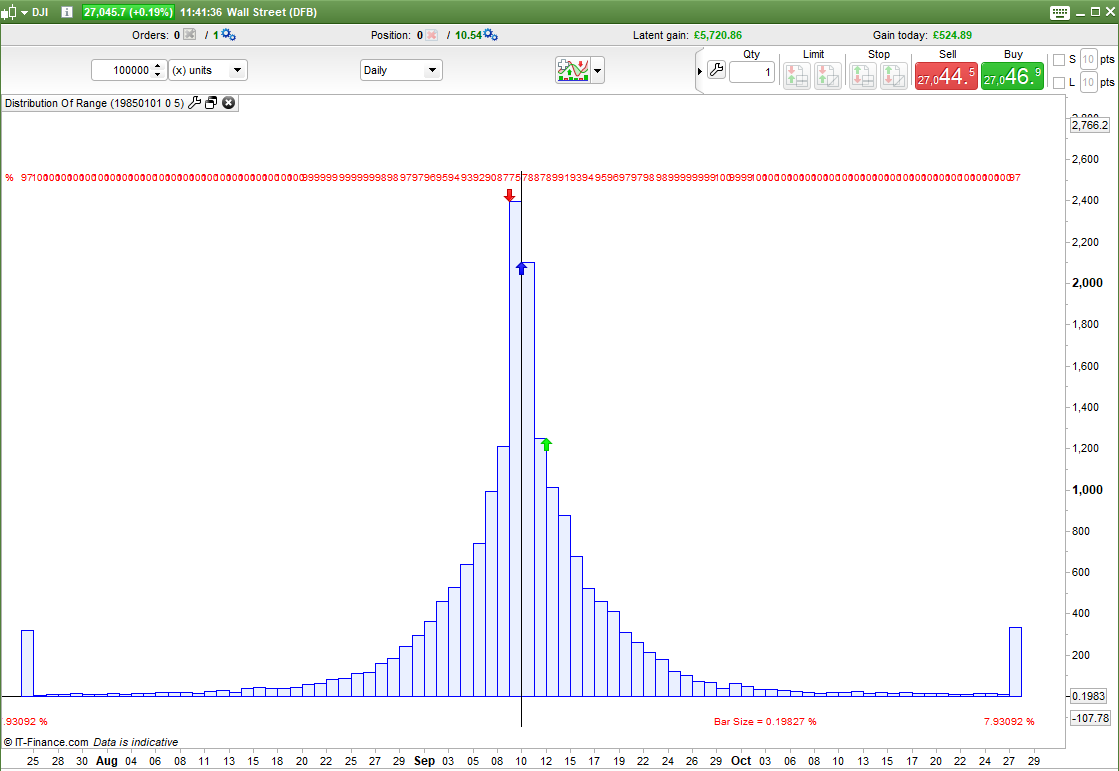
I have also been working on a similar indicator which I call ‘Distribution of Range’. On this indicator the right side of the curve shows distribution of high minus open and the left side open minus close. The number of bars has been increased to 82 and it also works with the automatic bar size indicator as well as manually sized bars.
Hopefully I will finish these indicators and post them to the library later this week.
GraHal thanked this postGreat coding!
Did you find time and energy to finalise the adaptable indicator? One of my first thoughts would be to make bucket distribution automatic based on highest and lowest return values and a given number of buckets (which could be set in a variable).
/F
I spent a lot of time on it and I did create something that was automatic but unfortunately any out of the ordinary candles created massive distortions in the bucket sizes calculated meaning that the output was not really of much use as the majority of results ended up being in just two bars – so I kind of gave up on the concept.
I’ve attached the ITF file for as far as I got.
If you set BarSize to zero then it automatically calculates the bar size (bucket size). I have added a variable called ‘factor’ which helps spread the bell curve out by dividing the automatically calculated bar size by its value. This helps to improve the curve and stops all the results being just in the middle two bars! It is a bit of a fudged work around which is the main reason why I did not post the indicator in the library.
There is also the issue that the bar size calculation is always changing as time goes on and it is difficult to know exactly how much this effects the final results.
There are three arrows – the blue one is where price is right now on the bell curve and the red and green are the extremes of where it has been for the current candle.
At the bottom of the chart it shows the size in % of each bar and also what the extreme bars represent.
Sorry if the code is a bit of a mess but it is an abandoned project for all the many reasons mentioned!
Thanks! Very interesting. I don’t feel I have time to dig deeper at the moment. If I had, I would of course have shared my findings. But thanks again for contributing creatively to spur my own creativity!
/F
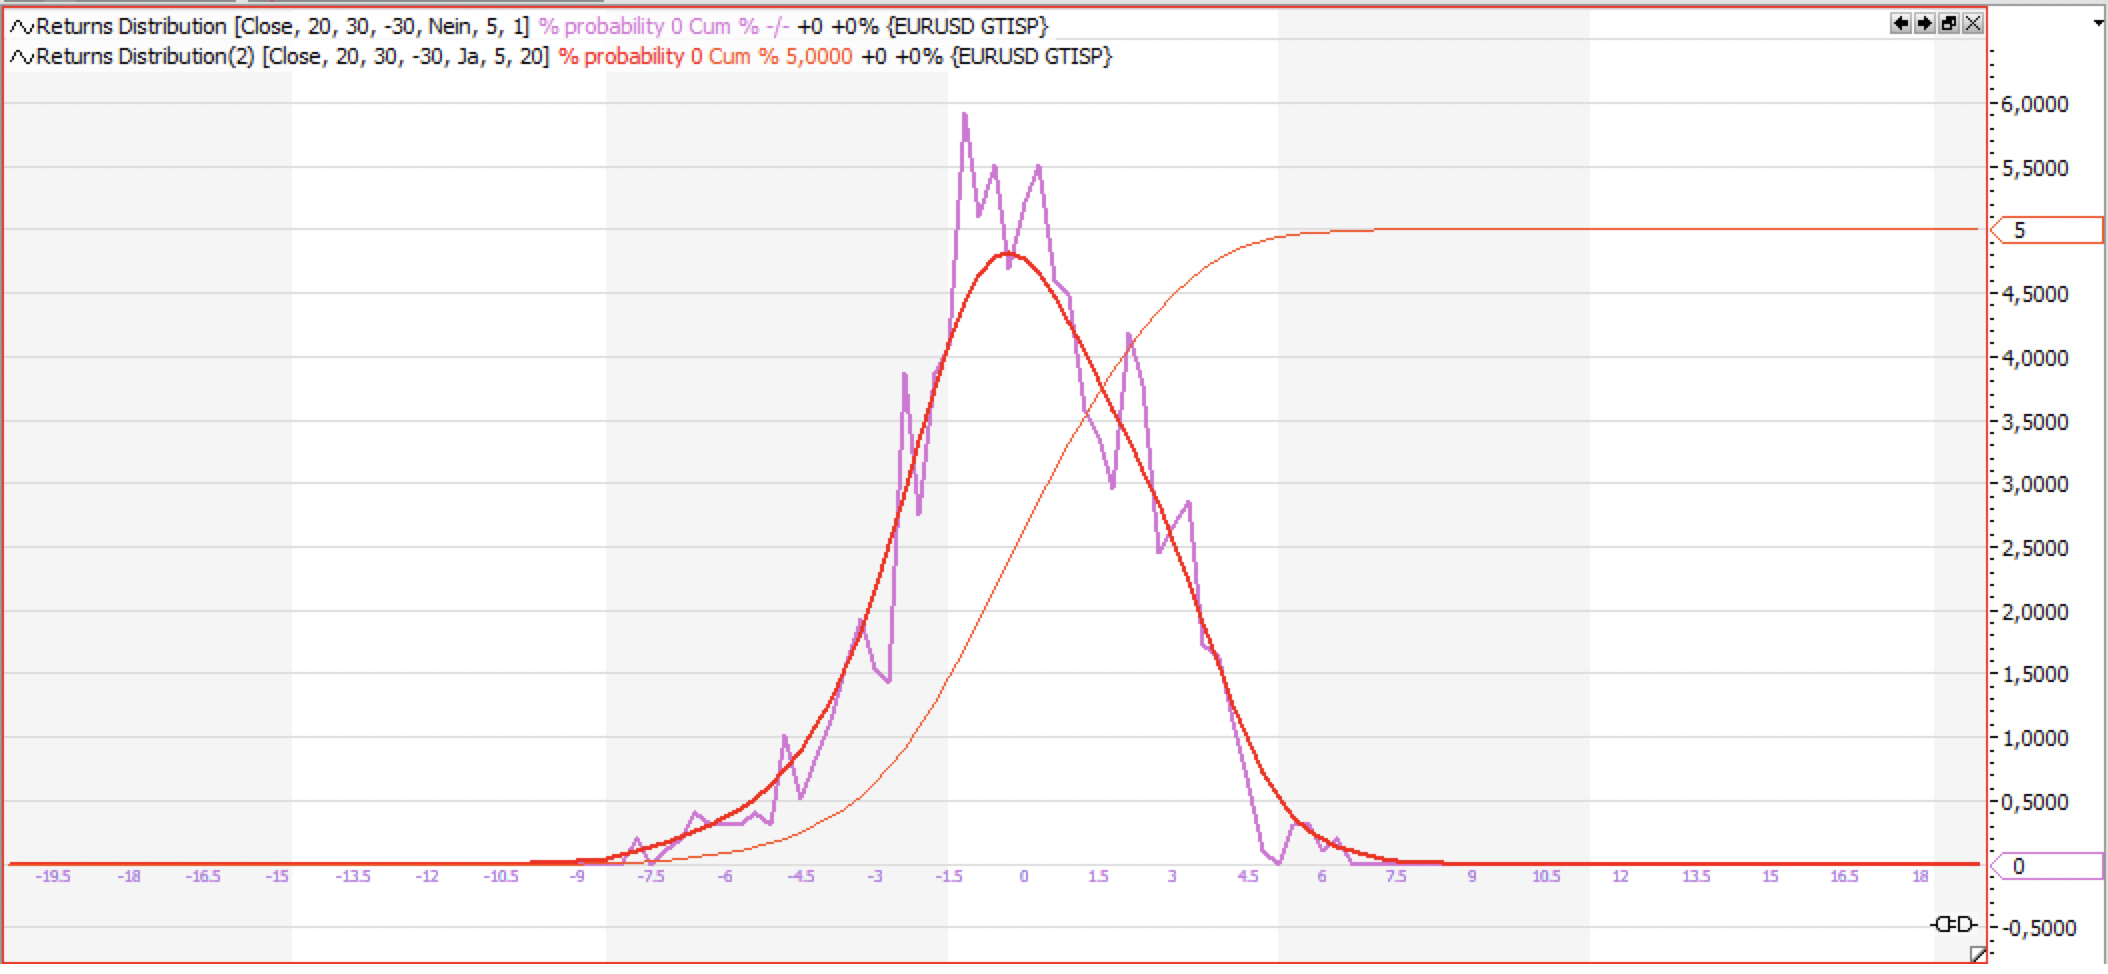
A great idea for an indicator Vonasi, as the distribution of returns shows the inherent bias/skew and volatility for any market. I was reading this very interesting quant traders ideas about Returns Distribution and Cumulative Probability here:
https://www.quanttrader.com/index.php/money-for-nothing/KahlerPhilipp2018
https://www.quanttrader.com/index.php/tradesignal-returns-distribution-indikator
How hard would it be to convert Kahler’s code from the second link supplied above? I think it would be a great addition to the library and maybe it could solve some of the issues you’ve encountered?
To save having translate his post from German:
The Returns Distribution indicator makes it possible to show the distribution of the returns of a time series. The presentation and calculation of the returns is done in percent.
If the input “returnperiod” is set to 0, the absolute price distribution is displayed.
The smoothing of the curve can be determined via the Input Smooth.
In addition to the distribution of the returns, the sum of the probabilities can also be displayed. This can be used to determine what percentage of events are above or below a certain value.
Hi @Vonasi, I’m unsure of the rules about double posting. Should I add my entire last post above to: https://www.prorealcode.com/free-code-conversion/
or https://www.prorealcode.com/forum/prorealtime-english-forum/probuilder-support/
and what is the real difference between these two links and how do you know when to post to one or the other? Thanks.
Everything is possible – but sometimes an awful lot of hard work. I have seen those posts that you provided links to before and have actually already started coding something similar. Unfortunately that original indicator code uses arrays and PRT does not have arrays so to create a DOR line requires a separate piece of code just to allocate each result to the correct variable (or bucket) rather than just a couple of loops. Then we have to do this again to get the other two DOR lines. I have also found deciding on the size of each bucket is impossible at the start of an indicator run unless a loop is used to check all of history in reverse first then you have to do the whole lot of distributions counting in reverse with a massive loop which either fails or is painfully slow. Starting at the beginning of history is easier and faster but then you have no idea what bucket size to use. I did overcome this with a separate indicator that calculates bucket size but then you have to manually enter it for the three DOR lines which is not ideal. Calculating a smoothed average of all the individual variable results is also not a lot of fun unless one likes repetitive typing! After all that I then need to workout all the correct locations in an indicator window to draw all the segments from one variable result to the next. The biggest DOR chart I have created so far is just 80 bars and that was a mammoth task.
I have shelved the project at the moment but might resurrect it if I thought that I could sell it! 🙂
-
AuthorPosts
- You must be logged in to reply to this topic.
Distribution Of Returns Indicator
ProBuilder: Indicators & Custom Tools
Summary
This topic contains 19 replies,
has 6 voices, and was last updated by ![]() Vonasi
Vonasi
6 years, 8 months ago.
Topic Details
| Forum: | ProBuilder: Indicators & Custom Tools |
| Language: | English |
| Started: | 05/21/2019 |
| Status: | Active |
| Attachments: | 8 files |
About personal data collected
The information collected on this form is stored in a computer file by ProRealCode to create and access your ProRealCode profile. This data is kept in a secure database for the duration of the member's membership. They will be kept as long as you use our services and will be automatically deleted after 3 years of inactivity. Your personal data is used to create your private profile on ProRealCode. This data is maintained by SAS ProRealCode, 407 rue Freycinet, 59151 Arleux, France. If you subscribe to our newsletters, your email address is provided to our service provider "MailChimp" located in the United States, with whom we have signed a confidentiality agreement. This company is also compliant with the EU/Swiss Privacy Shield, and the GDPR. For any request for correction or deletion concerning your data, you can directly contact the ProRealCode team by email at privacy@prorealcode.com If you would like to lodge a complaint regarding the use of your personal data, you can contact your data protection supervisory authority.