Hi there
I was after the code that allows you to add a line name option to various lines that are produced by an indicator, very similar to the “Pivot Points” indicator, which allows you to toggle on/off the line name of the various pivots i.e. R1, R2,R3 etc etc. Unfortunately I haven’t been able to access the code for that particular indicator.
Thanks a lot in advance.
Add text on chart is only possible with the new instructions of the PRT 10.3 version. What version are you using?
I remember have made something similar, as an example in the documentation, you can find the code right here (first example): draw text on chart
Please tell us if you have any other trouble or questions. Thank you.
Thanks a lot Nicolas, example one looks spot on. I am using V10.2, I will give it a go and see how I get on. I appreciate the help!!
Hi Nicolas,
I think it may be a bit tricky for me to try and work out, I am not much of a coder I am afraid and it could be, as you say, that the labelling isn’t an option on v10.2 (although I was using one of PRT’s standard indicators and they had labels attached so there must be a way to do it). Not sure if you are able to assist nay further but I have added below the indicator code as it may assist:
MP = UNDEFINED
CBOL = UNDEFINED
CBOS = UNDEFINED
CSHT = UNDEFINED
CLNG = UNDEFINED
MR3 = UNDEFINED
MR2 = UNDEFINED
MR1 = UNDEFINED
MS1 = UNDEFINED
MS2 = UNDEFINED
MS3 = UNDEFINED
MMLO = UNDEFINED
MMHI = UNDEFINED
MGAP = UNDEFINED
MPDH = UNDEFINED
MPDL = UNDEFINED
SHOW = (TodayOnly and DATE[0] > Yesterday)
IF SHOW or NOT TodayOnly THEN
MP = ( (MClose + MHi + MLo ) / 3)
CBOL = MClose + ( ( (MHi – MLo) * 1.1) / 2)
CSHT = MClose + ( ( (MHi – MLo ) * 1.1) / 4)
CBOS = MClose – ( ( (MHi – MLo ) * 1.1) / 2)
CLNG = MClose – ( ( (MHi – MLo ) * 1.1) / 4)
MR3 = MHi + ( 2 * (MP – MLo) )
MR2 = MP + (MHi – MLo)
MR1 = (2 * MP) – MLo
MS1 = (2 * MP) – MHi
MS2 = MP – (MHi – MLo)
MS3 = MLo – ( 2 * (MHi – MP) )
MMLO = MLO
MMHI = MHI
MPDH = PDH
MPDL = PDL
MGAP = MCLOSE
ENDIF
RETURN MP COLOURED(95,95,100) as “Pivot”, CBOL COLOURED(30,235,5) as “CBOL”, CLNG COLOURED(30,235,5) as “CLNG”, CSHT COLOURED(30,235,5) as “CSHT”, CBOS COLOURED(30,235,5) as “CBOS”, MR3 COLOURED(45,75,240) as “R3”, MR2 COLOURED(45,75,240) as “R2”, MR1 COLOURED(45,75,240) as “R1”, MS1 COLOURED(45,75,240) as “S1”, MS2 COLOURED(45,75,240) as “S2”, MS3 COLOURED(45,75,240) as “S3”, MGAP COLOURED(235,5,30) as “Close”, MMHi COLOURED (235,5,30) as “Hi”, MMLo COLOURED (235,5,30) as “Lo”, MPDH COLOURED (230,90,10) as “PDH”, MPDL COLOURED (230,90,10) as “PDL”
Thanks a lot
Andrew
> For clarity of messages on ProRealCode’s forums, please use the “insert code PRT” button to separate the text of the code part! Thank you! <<
Well, as I told you, labeling is not possible with the code in PRT version before 10.3 I’m sorry. The best you could do is to add a different color for each of the returned lines of your indicator.
Thanks Nicolas, will stick with the coloured lines for the time being. Only reason I think it is possible is that on v10.2, there are pro real time indicators that have line labels on them by default so you would think that there is a way of doing it. I have emailed them directly so will see how I get on. Noted re attaching code, makes sense. Cheers
Hi Nicolas,
I have now managed to upgrade to V10.3 – I have attached the PRT code. Any chance you could help me by just including the formula (and any other initial code that is required) for one of the pivots into the existing code and I can then go ahead and replicate for the remaining ones. Basically just looking to have the labels on the righthand side above the lines
Thanks a lot
Andrew
MP = UNDEFINED
CBOL = UNDEFINED
CBOS = UNDEFINED
MR3 = UNDEFINED
MR2 = UNDEFINED
MR1 = UNDEFINED
MS1 = UNDEFINED
MS2 = UNDEFINED
MS3 = UNDEFINED
MPOM = UNDEFINED
MMLO = UNDEFINED
MMHI = UNDEFINED
MGAP = UNDEFINED
MPDH = UNDEFINED
MPDL = UNDEFINED
M50PDR = UNDEFINED

SHOW = (TodayOnly and DATE[0]>Yesterday)

IF SHOW or NOT TodayOnly THEN
MP = ( (MClose + MHi + MLo )  / 3)
CBOL = MClose +  ( ( (MHi  - MLo) * 1.1) / 2)
CBOS = MClose - ( ( (MHi  - MLo ) * 1.1) / 2)
MR3 = MHi + ( 2 * (MP - MLo) )
MR2 = MP + (MHi - MLo)
MR1 = (2 * MP) - MLo
MS1 = (2 * MP) - MHi
MS2 = MP - (MHi - MLo)
MS3 = MLo - ( 2 * (MHi - MP) )
MPOM = POM
MMLO = MLO
MMHI = MHI
MPDH = PDH
MPDL = PDL
MGAP = MCLOSE
M50PDR = (((MHI - MLO)) * (0.5)) + MLO
ENDIF
RETURN MP COLOURED (153,153,153,255) as "Pivot", CBOL COLOURED (8,178,45,255) as "CBOL", CBOS as "CBOS", MR3 COLOURED (255,153,0,255) as "R3", MR2 COLOURED (255,153,0,255) as "R2", MR1 COLOURED (255,153,0,255) as "R1", MS1 COLOURED (0,153,153,255) as "S1", MS2 COLOURED (0,153,153,255) as "S2", MS3 COLOURED (0,153,153,255) as "S3", MGAP as "Gap", MMHi COLOURED (102,204,0,255) as "Previous Days High", MMLo COLOURED (255,51,0,255) as "Previous Days Low", MPOM as "Pom", MPDH COLOURED (5,255,25,255) as "2 Day High", MPDL COLOURED (255,0,204,255) as "2 Day Low", M50PDR COLOURED (204,204,0,255) as "50% of Previous Days Range"

REM RETURN MP as "Pivot", CBOL as "CBOL", CBOS as "CBOS", MR3 as "R3", MR2 as "R2", MR1 as "R1", MS1 "S1", MS2 as "S2", MS3 as "S3", MGAP as "Gap", MMHi as "Previous Days High", MMLo as "Previous Days Low", MPOM as "Pom", MPDH as "2 Day High", MPDL as "2 Day Low", M50PDR as "50% Previous Days Range"
There is a complete example on how to display pivot labels in the online documentation of the website :
DRAWTEXT
(example 1). This example suits perfectly your query!
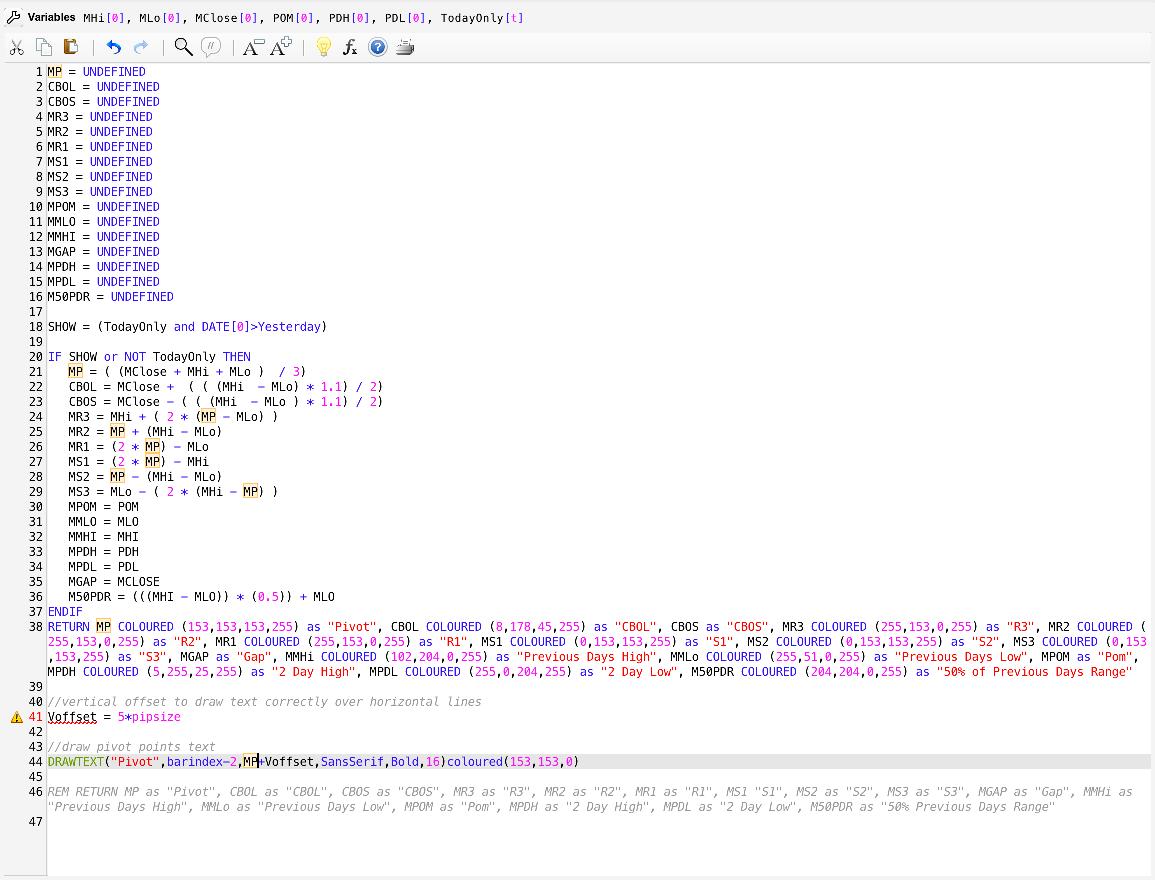
Thanks Nicolas, appreciate it, I tried putting just part of the formula in for the pivot to see if could get it working just for one line before adding the rest and it came up with an error with the voffset element – I am sure there is an easy fix but have zero programming skills so doesn’t stand out for me. Any help would be great. I have attached a link for a screen shot of the formula
Thanks
The error come from the fact that RETURN line must be the last line of your code, no other codes can be written below it!
All sorted now!! Thanks again for all your help