Graphical instruction to draw text on chart.
Syntax:
|
1 |
DRAWTEXT("text", x1, y1, <font> , <style>, <size>) COLOURED(R,V,B,a) |
“text” as a string value, which must be in quotation marks, just like the example below.
x1 as a barindex, y1 as the price or the vertical axis value.
Variables values can also be drawn on chart, they must be surrounded by pound symbols : “#myvariable#”. See example 3 below.
optional arguments :
<font> to apply a different font than the default one, allowed font are : Dialog (default), Monospaced, Serif, SansSerif.
<style> Standard (default), Bold, Italic, BoldItalic.
<size> 10 (default) to 30.
Style and Size arguments can only be defined if the <font> argument is set.
Example 1:
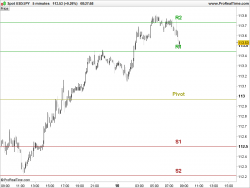
Display pivot points names above their lines on an intraday chart :
|
1 2 3 4 5 6 7 8 9 10 11 12 13 14 15 16 17 18 19 20 21 22 23 24 25 26 27 28 29 30 31 32 33 34 35 36 37 |
defparam drawonlastbaronly = true //yesterday's value dh = DHigh(1) dl = DLow(1) //fibonacci pivot points P = (dh + dl + DClose(1))/3 S1 = P - .382 * (dh-dl) S2 = P - .618 * (dh-dl) S3 = P - 1 * (dh-dl) R1 = P + .382 * (dh-dl) RR2 = P + .618 * (dh-dl) R3 = P + 1 * (dh-dl) //vertical offset to draw text correctly over horizontal lines Voffset = 5*pipsize //draw pivot points text DRAWTEXT("Pivot",barindex-2,p+Voffset,SansSerif,Bold,16)coloured(153,153,0) DRAWTEXT("R1",barindex-2,R1+Voffset,SansSerif,Bold,16)coloured(0,153,0) DRAWTEXT("R2",barindex-2,RR2+Voffset,SansSerif,Bold,16)coloured(0,153,0) DRAWTEXT("R3",barindex-2,R3+Voffset,SansSerif,Bold,16)coloured(0,153,0) DRAWTEXT("S1",barindex-2,S1+Voffset,SansSerif,Bold,16)coloured(153,0,0) DRAWTEXT("S2",barindex-2,S2+Voffset,SansSerif,Bold,16)coloured(153,0,0) DRAWTEXT("S3",barindex-2,S3+Voffset,SansSerif,Bold,16)coloured(153,0,0) //draw pivot points lines with extension DRAWLINE(barindex-1,p,barindex,p) coloured(153,153,0) DRAWLINE(barindex-1,R1,barindex,R1) coloured(0,153,0) DRAWLINE(barindex-1,RR2,barindex,RR2) coloured(0,153,0) DRAWLINE(barindex-1,R3,barindex,R3) coloured(0,153,0) DRAWLINE(barindex-1,S1,barindex,S1) coloured(153,0,0) DRAWLINE(barindex-1,S2,barindex,S2) coloured(153,0,0) DRAWLINE(barindex-1,S3,barindex,S3) coloured(153,0,0) RETURN |
Example 2:
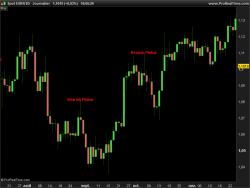
Find and display “Bearish Pinbar” on chart with the DRAWTEXT instruction.
|
1 2 3 4 5 6 7 8 9 10 11 |
bearishbody = ABS(open-close) bearishwick = ABS(high-close) bearishnose = ABS(close-low) //bearish pinbar if (bearishbody/bearishwick)<20/100 AND (bearishbody/bearishnose)>100/100 then DRAWTEXT("Bearish Pinbar", barindex, high, Dialog, Bold, 12) COLOURED(255,10,10,255) endif return |
Example 3:
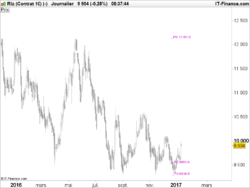
Retrieved and display last year highest, lowest and close prices and display their values on chart (use of variables values in the drawtext instruction).
|
1 2 3 4 5 6 7 8 9 10 11 12 13 |
defparam drawonlastbaronly=true If Year<>Year[1] then yearlyClose = close[1] yearlyHigh = Highest[BarIndex - lastYearBarIndex](High)[1] yearlyLow = Lowest[BarIndex - lastYearBarIndex](Low)[1] lastYearBarIndex = BarIndex endif drawtext("_PH #yearlyHigh#",barindex,yearlyhigh) coloured(204,0,204) drawtext("_PC #yearlyClose#",barindex,yearlyclose) coloured(204,0,204) drawtext("_PH #yearlyLow#",barindex,yearlylow) coloured(204,0,204) return |
Other examples can be found in the simple dashboard tutorial blog post : http://www.prorealcode.com/blog/learning/simple-indicators-dashboard/
 DRAWTEXT


Il semble qu’il ne soit pas possible de donner une variable en paramètre du DrawText.Le code suivant génère une erreur.
DEFPARAM DRAWONLASTBARONLY = true
DEFPARAM CALCULATEONLASTBARS = 1
result = CALL MyIndicator
DRAWTEXT(result, barindex, 0, SansSerif, Bold, 16) //COLOURED(R,V,B,a)
return 0
En effet, cela n’est pas possible, à regret. J’espère que cette instruction évoluera prochainement! Car il y a une myriade de choses que j’aimerai faire avec également 🙂
Il est maintenant possible de tracer du texte avec la valeur d’une variable (voir documentation à jour dans l’exemple 3).
On peut contourner la chose d’une manière “bourrin” mais c’est déjà un début.
Exemple : j’utilise les bandes de Mogaleff / Eric Lefort et en intraday / scalping il est très utile pour moi de visualiser rapidement l’écart entre la band haute et la bande basse ce qui me donne une idée de la volatilité du trade possible.
Pour cela, j’ai ajouté ces tris dans le code initial :
Spread=bandeHaute-BandeBasseVoffset=5*pipsize
If Spread>20 and Spread<30 thendrawtext(“Ecart > 20”,barindex,BandeHaute+Voffset,SansSerif,Bold,12)coloured(173, 79, 9)Endif
If Spread>30 and Spread<40 thendrawtext(“Ecart > 30”,barindex,BandeHaute+Voffset,SansSerif,Bold,12)coloured(0,0 , 255)Endif
If Spread>40 and Spread<50 thendrawtext(“Ecart > 40”,barindex,BandeHaute+Voffset,SansSerif,Bold,12)coloured(27,79,8)Endif
If Spread>50 and Spread< 60 thendrawtext(“Ecart > 50”,barindex,BandeHaute+Voffset,SansSerif,Bold,12)coloured(255, 0, 0)Endif
If Spread>60 and Spread<70 thendrawtext(“Ecart > 60”,barindex,BandeHaute+Voffset,SansSerif,Bold,12)coloured(0,0 , 255)Endif
If Spread>70 and Spread<80 thendrawtext(“Ecart > 70”,barindex,BandeHaute+Voffset,SansSerif,Bold,12)coloured(27,79,8)Endif
etc… C’est pratique même si pas élégant…
Il est maintenant possible de tracer du texte avec la valeur d’une variable (voir documentation à jour dans l’exemple 3).
How can i write a text at a fixed position in the chart? Say i want yesterdays close displayed in the upper right corner of the chart and it shall stay there if i change the timeframe for exapmple. What do i enter for X and Y?
It’s not possible because X,Y coordinates use barindex and price, they are not in pixels format.
You should have a look on my dashboard creation tutorial, you may find suitable help for your needs: https://www.prorealcode.com/blog/learning/simple-indicators-dashboard/
I am trying to put those colours which are often used into a variable and use those in the DRAWTEXT section, but this does not work. Example: myred=”255,128,0″ called in coloured(myred). I want to achieve a quick change of colours wherever myred appears by simply changing the variables definition.
Whatever way I try to set the variable, I get a message saying something like “please complete the syntax in that line”. Am I right assuming that variable substitution of such kind are not supported and I have to use search&replace for changes all over the document?
Thanks.
Variable can’t hold string value, only numbers. So you must define your RGB values in 3 separated variables, like this:
r = 255
g = 128
b = 0
drawtext(“hello world!”, barindex,close) coloured(r,g,b)
Thank you. It get’s me an idea how I can possibly code it.
Hello,
I am trying to put the text size as variable but seems not to work:
drawtext(“–“,barindex, low, dialog, standard, textSize) // with textSize defined as variable
any solution or a workaround for that? it would be very useful / brings better code flexibility
thx
Not possible, would be very useful you are right.
all the examples have no return value … can you return a value and draw at the same time?
I also put example 2 into a new empty indicator and no text appears. Simplified it to the following and still no text
Yes you can of course return values too with RETURN while using any graphical keywords in your code. The second example should be adapted to your instrument by multiplying any compared value with pointsize keyword.
here’s the code
if close<open then
DRAWTEXT("Down", barindex, high, Dialog, Bold, 12) COLOURED(255,10,10,255)
endif
return
And again – hopefully it will come through OK now….
if close<open then
DRAWTEXT("Down", barindex, high, Dialog, Bold, 12) COLOURED(255,10,10,255)
endif
return
Hello.
I want to add the text “DAX-Open” when drawing a vertical line at 07:00.
To draw the line at 07:00 on DAX open I use code below but I cant get it to add only the text with a Font size/type/colour.
I will appreciate some assistance or point me in the direction where I can find the solution.
Thank you.
#######################
if time=070000 then //DAX Open UTC+1
drawvline(barindex)
endif
return
#######################
Salve, usando il comando DRAWTEXT è possibile dividere il testo su più linee? Praticamente vorrei poter andare a capo sulla riga successiva.
It is not possible to make multiple lines of text with DRAWTEXT. But that would be a great improvement for sure!
i would highly recommend to add “windings..” to the allowed fonts that one can print useful symbols in the chart
You can already use Ascii characters with DRAWTEXT, a lot of symbols can be used, look at this website for instance: https://fr.piliapp.com/symbol/
Bonjour. Serait-il possible d’écrire un drawtext à droite de la dernière bougie ? (sur l’axe x donc)
up
Ajouter des espaces en v10.3 ou une coordonnée X plus importante que celle actuelle en v11, voir exemple: https://www.prorealcode.com/topic/indication-du-texte-dans-le-prolongement-de-la-resistance/
Bonjour, merci pour votre retour. J’ai essayé mais cela ne marche pas. je suis en 10.3 . Lorsque je met les espaces (ou pas d’ailleurs), la valeur disparait…
defparam drawonlastbaronly = true
varlowhigh = ((high[0]-low[0])/low)*100
DRAWTEXT(“#varlowhigh#”, barindex, high)
return
Avec mon code de base, ma valeur s’inscrit pour le moment sur le haut de ma dernière bougie. Hors je voudrais écrire à droite de celle-ci.
Il suffit de mettre des espaces devant #varlowhigh#, il y a un tas d’exemple dans les forums.
J’avais mal compris, désolé. Merci beaucoup pour les précisions, cela fonctionne !
New to Pro Real Time programming and cut and pasted the Find and display “Bearish Pinbar” on chart with the DRAWTEXT instruction code and when I try to load the indicator I get an error message “Positive integer field expected with Highest.” Any reason why this message should occur? I have version V 11.1 Pro Real Time.