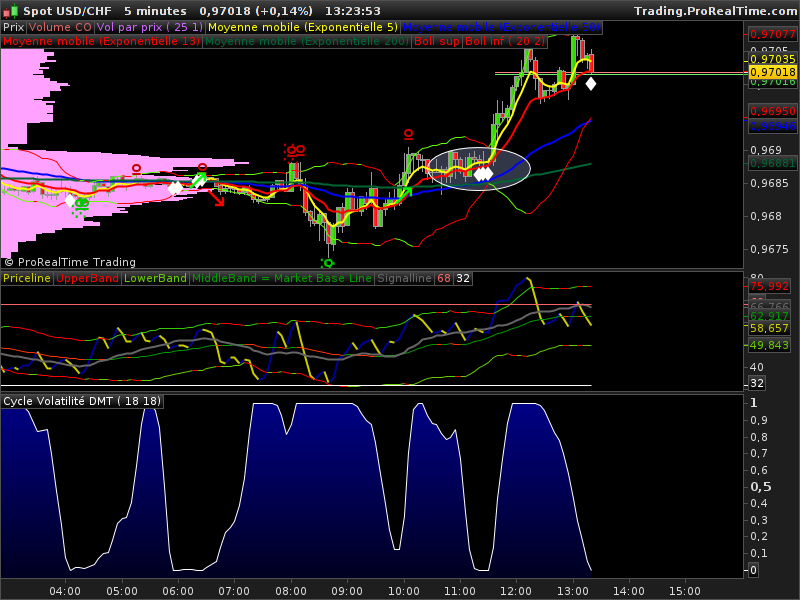
Bonjour, Voici un indicateur permettant de determiner les moments où les bandes de Bollinger sont parallèles via un symbole sur le graphique.
Cet indicateur utilise un sous indicateur ” Cycle de volatilité DMT”, Dmt car cet indicateur en libre accès provient de cette école. Cet indicateur indique les phases de volatilité Zero correspond à des Bande de Bollinger parallèle, on retrouve le calcul d’un stochastique:
a=BollingerBandWidth[m](close)
b=highest[n](a)
c=lowest[n](a)
d=(a-b)/(b-c)

Return average[2](d) +1
Nous utilisons cet indicateur pour détecter les phases de basse volatilité précurseur d’une cassure à la hausse ou à la baisse
//---external parameters
// Regnault Vincent Detection Phase 1 Dmtrading
myCycleVolatilitDMT = CALL "Cycle Volatilité DMT"[18, 18]
atr = averagetruerange[10](close)*0.5
if  myCycleVolatilitDMT= 0 then
DRAWTEXT("♦", barindex, low-atr, Dialog, Standard, 20 )coloured(00,0,00,255)
endif
Toutes les améliorations sont évidement les bienvenues !
Bonjour Vincent, j’ai déplacé ton post de la bibliothèque jusqu’ici pour en discuter. C’est très intéressant, d’ailleurs cet indicateur est déjà présent dans la bibliothèque ici : https://www.prorealcode.com/prorealtime-indicators/volatility-cycle/
Avec des discussions sur le sujet dans le forum:
https://www.prorealcode.com/topic/volatility-cycle-index/
https://www.prorealcode.com/topic/creation-dun-screener-a-partir-de-volatily-breakout/
et un autre indicateur dérivé du principe: https://www.prorealcode.com/prorealtime-indicators/volatility-breakout-indicator/
Ton indicateur pour identifier les zones de faible volatilité est sympa, mais il lui manque une instruction RETURN et pourquoi ne pas colorier les chandeliers à la place de la petite étoile ? J’ai compilé l’ensemble en 1 seul indicateur, j’espère que tu ne m’en voudras pas 🙂
a=BollingerBandWidth[18](close)
b=highest[18](a)
c=lowest[18](a)
d=(a-b)/(b-c)

//---external parameters
// Regnault Vincent Detection Phase 1 Dmtrading
myCycleVolatilitDMT = average[2](d) +1//CALL "Cycle Volatilité DMT"[18, 18]
//atr = averagetruerange[10](close)*0.5
if  myCycleVolatilitDMT= 0 then
//DRAWTEXT("♦", barindex, low-atr, Dialog, Standard, 20 )coloured(00,0,00,255)
drawcandle(open,high,low,close) coloured(100,100,100)
endif

return
Bonjour Nicolas,
Est il possible de transformer l’indicateur : https://www.prorealcode.com/prorealtime-indicators/volatility-cycle/
en Screener ? J’ai vu une demande similaire dans un des sujets dont tu a mis le lien au dessus mais par sur cet indicateur précis.
J’ai essayer de remplacer la derniere ligne par : “Return as sreener” mais ça ne fonctionne pas. J’aimerai l’utiliser sur du M15 ou M30.
Merci d’avance !
J’ai egalement tenté comme ça :
//PRC_Volatility Cycle | indicator
//02.12.2016
//Nicolas @ www.prorealcode.com
//Sharing ProRealTime knowledge
//converted and adapted from Metatrader4 version

InpBandsPeriod=18      // Period
Smooth=2               // Smoothness

StdDev = std[InpBandsPeriod](close)
highindex = highest[InpBandsPeriod](StdDev)[1]
lowindex = lowest[InpBandsPeriod](StdDev)[1]

if barindex>InpBandsPeriod then
VolDer = (StdDev-highindex)/(highindex-lowindex)
VolSmooth = average[Smooth](VolDer)

if VolSmooth>0 then
VolSmooth = 0
elsif VolSmooth<-1.0 then
VolSmooth = -1.0
endif

endif

screener[VolSmooth]
Mais ça ne fonctionne pas… 🙁
Bonjour à tous,
Je viens de voir les modifications Nicolas, je ne t’en veux pas et te remercie pour les améliorations apportées. Puis en effet c’est mieux de l’avoir ici pour apporter d’éventuelles améliorations.
@TheAccountant
Oui bien sûr, mais tu voudrais screener quoi en particulier dans cet oscillateur ?
Bonjour Nicolas !
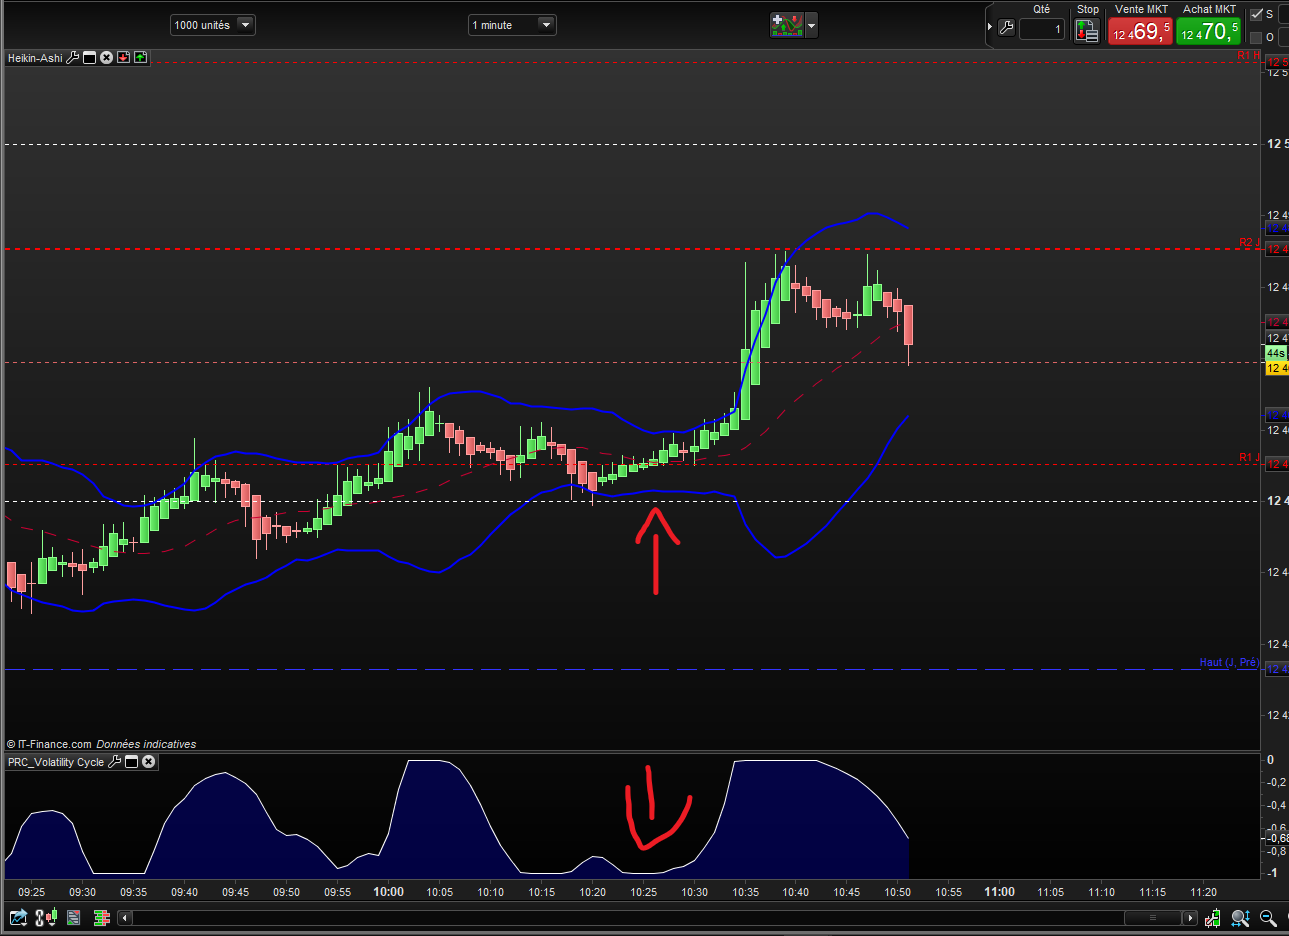
Je souhaiterai que le screener nous sorte les valeurs qui ont l’indicateur “volatility cycle” à -1, c’est a dire quand les bande de bollinger sont bien paralléles.
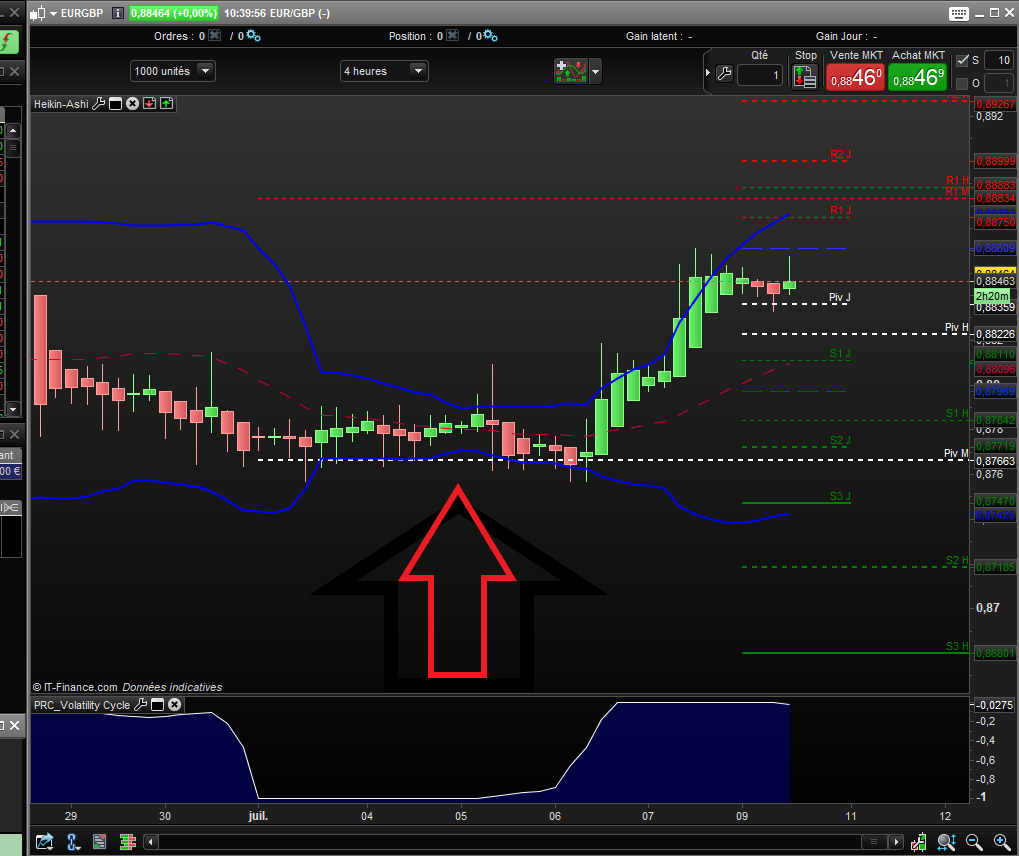
En fait tu as posté sur le site un screener : https://www.prorealcode.com/prorealtime-market-screeners/intraday-volatility-explosion-screener/
qui est vraiment bien, mais l’explosion de volatilité à déjà eu lieu, il est un peu tard pour rentrer en position. 🙂 Si on pouvait sortir les valeurs en contraction juste avant l’explosion ce serai super.
une ptite image :
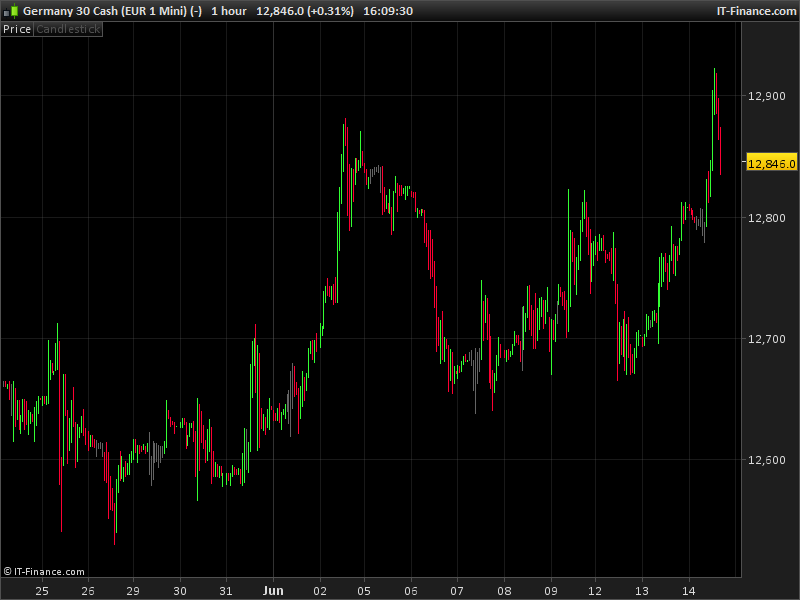
autre exemple en direct sur le dax (que j’ai manqué parceque j’étais sur prorealcode grrrrrrrrrrrrrrrr 🙂 ):
ok, c’est très facile dans ce cas, tu poses une simple condition pour tester si VolSmooth=-1, comme ceci:
//PRC_Volatility Cycle | indicator
//02.12.2016
//Nicolas @ www.prorealcode.com
//Sharing ProRealTime knowledge
//converted and adapted from Metatrader4 version

InpBandsPeriod=18      // Period
Smooth=2               // Smoothness

StdDev = std[InpBandsPeriod](close)
highindex = highest[InpBandsPeriod](StdDev)[1]
lowindex = lowest[InpBandsPeriod](StdDev)[1]

if barindex>InpBandsPeriod then
VolDer = (StdDev-highindex)/(highindex-lowindex)
VolSmooth = average[Smooth](VolDer)

if VolSmooth>0 then
VolSmooth = 0
elsif VolSmooth<-1.0 then
VolSmooth = -1.0
endif
endif

condition = VolSmooth=-1

screener[condition]
C’est une simple variable booléenne, voir la formation “débutant” ici => formation débutant prorealtime
merci Nicolas c’est parfait !