Bonjour j’ai un indicateur sur trading view que j’aimerais transposer sur prorealtime S’il vous plait
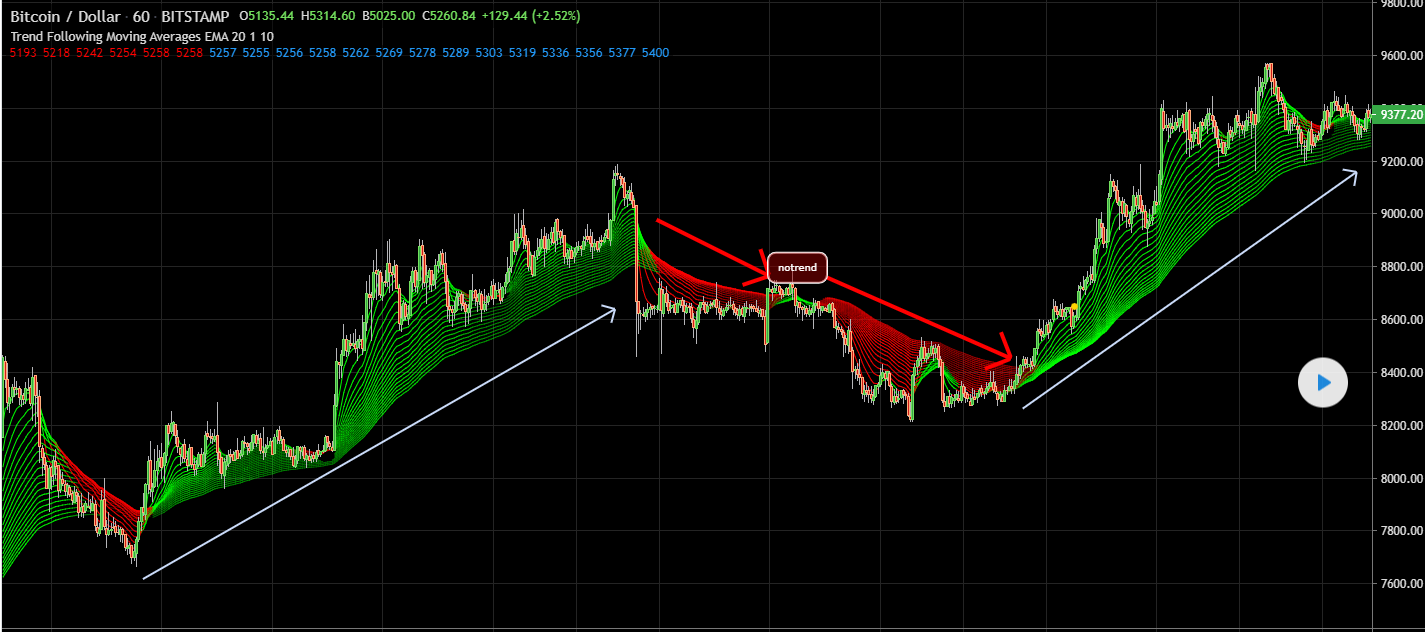
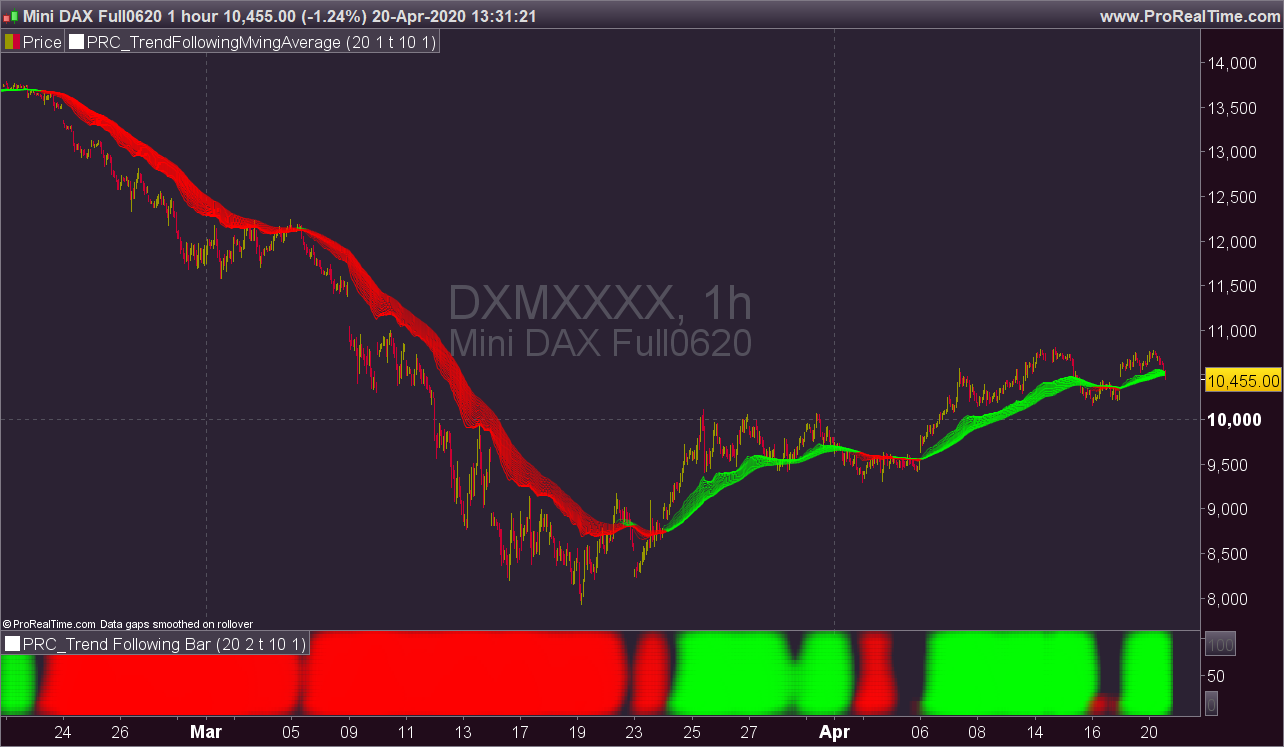
Lors de l’analyse d’un graphique, l’un des plus gros problèmes est de voir s’il y a une tendance ou non. En y réfléchissant, j’ai trouvé l’idée d’analyser les moyennes mobiles dans le canal et leur élan en fonction de la largeur du canal. Je l’ai déjà publié sous forme de barre de suivi des tendances, comme vous le voyez en bas du graphique. Comment ça fonctionne? Sur chaque barre, il crée un canal par le point le plus haut / le plus bas d’un MA. le point le plus élevé est la ligne supérieure et le point le plus bas est la ligne inférieure du canal MA, il obtient le point le plus élevé et le plus bas des 300 dernières barres, (par exemple, le canal de prix) Si la largeur du canal MA est supérieure à un certain taux de canal de prix, il décide alors is trend Après avoir décidé qu’il y a une tendance, il calcule le débit entre le canal et MA. Un résultat plus grand signifie une tendance plus forte. Selon le taux du canal MA et le canal de prix, MA Line devient plus clair / plus sombre. Ainsi, lorsque vous regardez la couleur de la ligne MA, vous pouvez voir la force de la tendance.
voici les ligne de code
//@version=4
study("Trend Following Moving Averages", overlay = true, precision=0)
matype= input('EMA', title = "MA Type", options =['EMA', 'SMA', 'RMA', 'WMA', 'VWMA'])
prd = input(20, title = "Period to Check Trend", minval = 5)
rateinp = input(1, title = "Trend Channel Rate %", minval = 0.1, step = 0.1)
ulinreg = input(true, title = "Use Linear Regression")
linprd = input(10, title = "Linear Regression Period", minval = 2)

rate = rateinp / 100
pricerange = highest(300) - lowest(300)
chan = pricerange * rate

gettrend(len)=>
    masrc = matype == 'EMA' ? ema(close, len) : matype == 'RMA' ? rma(close, len) : matype == 'VWMA' ? vwma(close, len) : matype == 'WMA' ? wma(close, len) : sma(close, len)
    ma = ulinreg ? linreg(masrc, linprd, 0) : masrc

    hh = highest(ma, prd)
    ll = lowest(ma, prd)
    diff = abs(hh - ll)

    trend = iff(diff > chan, iff(ma > ll + chan, 1, iff(ma < hh - chan, -1, 0)), 0)
    _ret = trend * diff / chan
    _ret

getcol(trend)=>
    _ret = trend >= 10.0 ? #00FF00ff : trend >= 9.0 ? #00FF00ef : trend >= 8.0 ? #00FF00df : trend >= 7.0 ? #00FF00cf : trend >= 6.0 ? #00FF00bf :
       trend >= 5.0 ? #00FF00af : trend >= 4.0 ? #00FF009f : trend >= 3.0 ? #00FF008f : trend >= 2.0 ? #00FF007f : trend >= 1.0 ? #00FF006f :
       trend <= -10.0 ? #FF0000ff : trend <= -9.0 ?  #FF0000ef : trend <= -8.0 ?  #FF0000df : trend <= -7.0 ?  #FF0000cf : trend <= -6.0 ?  #FF0000bf :
       trend <= -5.0 ?  #FF0000af : trend <= -4.0 ?  #FF00009f : trend <= -3.0 ?  #FF00008f : trend <= -2.0 ?  #FF00007f : trend <= -1.0 ?  #FF00006f :
       na
getma(lngth)=>
    _ret = matype == 'EMA' ? ema(close, lngth) : matype == 'RMA' ? rma(close, lngth) : matype == 'VWMA' ? vwma(close, lngth) : matype == 'WMA' ? wma(close, lngth) : sma(close, lngth)

plot(getma(5), color = getcol(gettrend(5)))
plot(getma(10), color = getcol(gettrend(10)))
plot(getma(15), color = getcol(gettrend(15)))
plot(getma(20), color = getcol(gettrend(20)))
plot(getma(25), color = getcol(gettrend(25)))
plot(getma(30), color = getcol(gettrend(30)))
plot(getma(35), color = getcol(gettrend(35)))
plot(getma(40), color = getcol(gettrend(40)))
plot(getma(45), color = getcol(gettrend(45)))
plot(getma(50), color = getcol(gettrend(50)))
plot(getma(55), color = getcol(gettrend(55)))
plot(getma(60), color = getcol(gettrend(60)))
plot(getma(65), color = getcol(gettrend(65)))
plot(getma(70), color = getcol(gettrend(70)))
plot(getma(75), color = getcol(gettrend(75)))
plot(getma(80), color = getcol(gettrend(80)))
plot(getma(85), color = getcol(gettrend(85)))
plot(getma(90), color = getcol(gettrend(90)))
plot(getma(95), color = getcol(gettrend(95)))
plot(getma(100), color = getcol(gettrend(100)))
Cela serais vraiment chouette