DD Graph

Viewing 3 posts - 1 through 3 (of 3 total)
  • Author
    Posts
  • #102256 quote
    TempusFugitTempusFugit
    Participant
    Veteran

    Hi,

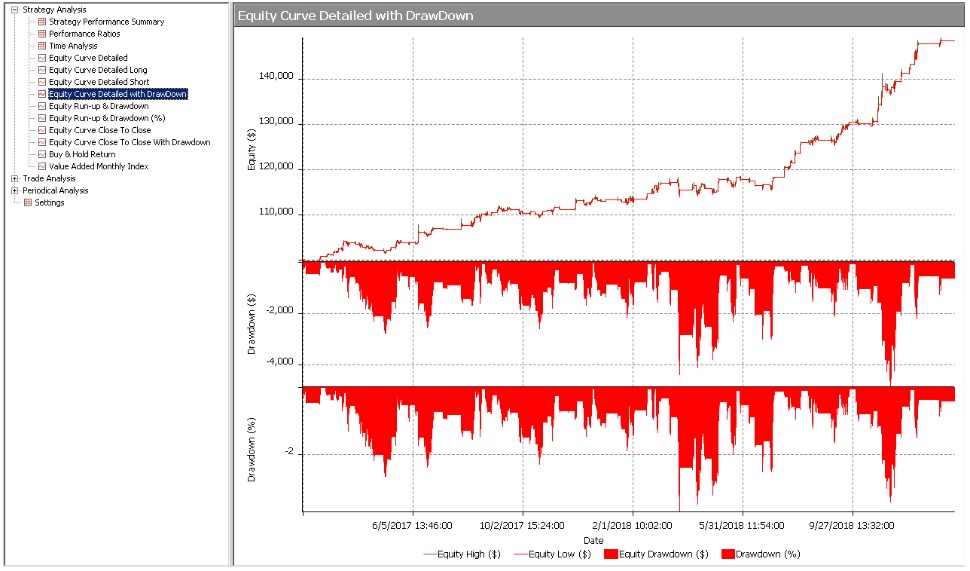
    Does anyone know how to draw the DrawDown in a graph under the equitycurve? Something like the image attached

    Thanks in advance

    DD.jpg DD.jpg
    #102264 quote
    VonasiVonasi
    Moderator
    Master

    This may be of use:

    Drawdowns – Have you got the Stomach??

    or maybe this:

    Possible to graph drawdowns?

    TempusFugit thanked this post
    #102277 quote
    TempusFugitTempusFugit
    Participant
    Veteran

    The second one is great, thanks!

    I just changed the penultime line  to graph value instead of percentage

    if longonmarket then
    floatingProfit = (((low - positionprice ) * pointvalue) *countofposition) / pipsize
    endif
    
    if shortonmarket then
    floatingProfit = (((high - positionprice) * pointvalue) * abs(countofposition)) / pipsize
    endif
    
    floatingEquity = StrategyProfit + floatingProfit
    maxequity = max(maxequity, StrategyProfit + floatingProfit)
    ddvalue =  MIN(0,floatingequity - maxequity)
    
    graph ddvalue
Viewing 3 posts - 1 through 3 (of 3 total)

  • You must be logged in to reply to this topic.

ProRealAI ProRealAI New

Stuck on this ProBuilder code?

Describe what this topic is trying to build, in plain English, and ProRealAI writes the ProRealTime™ indicator, screener or system for you.

Available in 7 languages
Try ProRealAI

DD Graph


ProOrder: Automated Strategies & Backtesting

New Reply
Author
Summary

This topic contains 2 replies,
has 2 voices, and was last updated by TempusFugitTempusFugit
7 years, 2 months ago.

Topic Details
Forum: ProOrder: Automated Strategies & Backtesting
Language: English
Started: 07/09/2019
Status: Active
Attachments: 1 files
ProRealCode ProRealCode
Loading...