Paul
PaulParticipant
Master
@Jaykay its performance was already questionable in a downtrend. See page 9 and it appeared to be so!
Green bars and a nice equity curve, even with 100+ trades, don’t bear much meaning if the market changes direction.
@Stefanb always nice to see it tested on other markets. You can have surprises!
I think the strategy doesn’t perform well in downtrends because of the value of “entertime” and “lasttime” variables. If you chose a different time like 21 o’ clock it will be the opposite. It will perform in downtrends but not in uptrends.
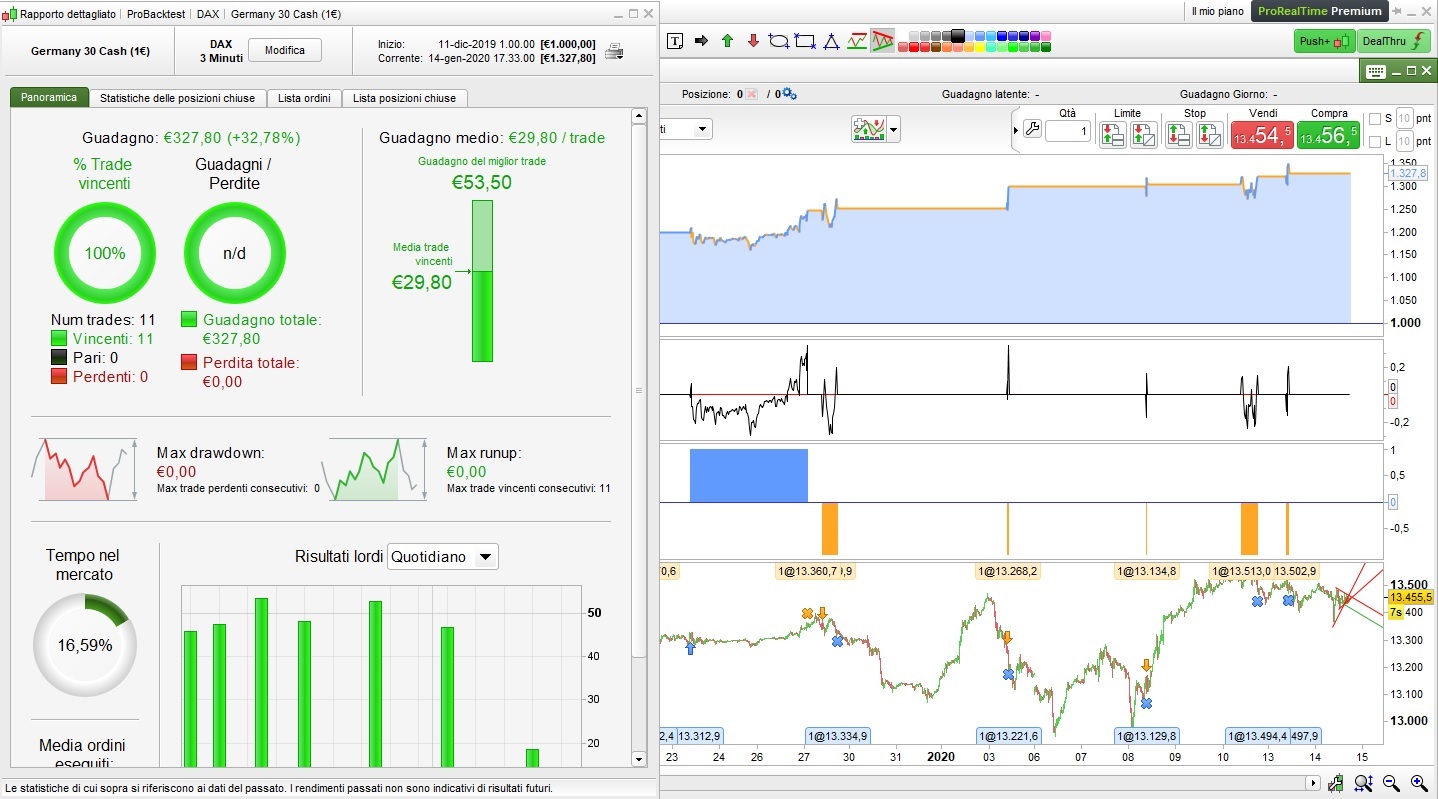
Modified the code a bit and tested it on USA 500 with timeframe 30 sec and spread 1.6.
You have very little data in 30 sec, but the graph looks interesting.
someone could test with a larger period?
MODERATORS EDIT: Excessive amount of unnecessary quoted code removed. Please avoid quoting large amounts of code in your replies.
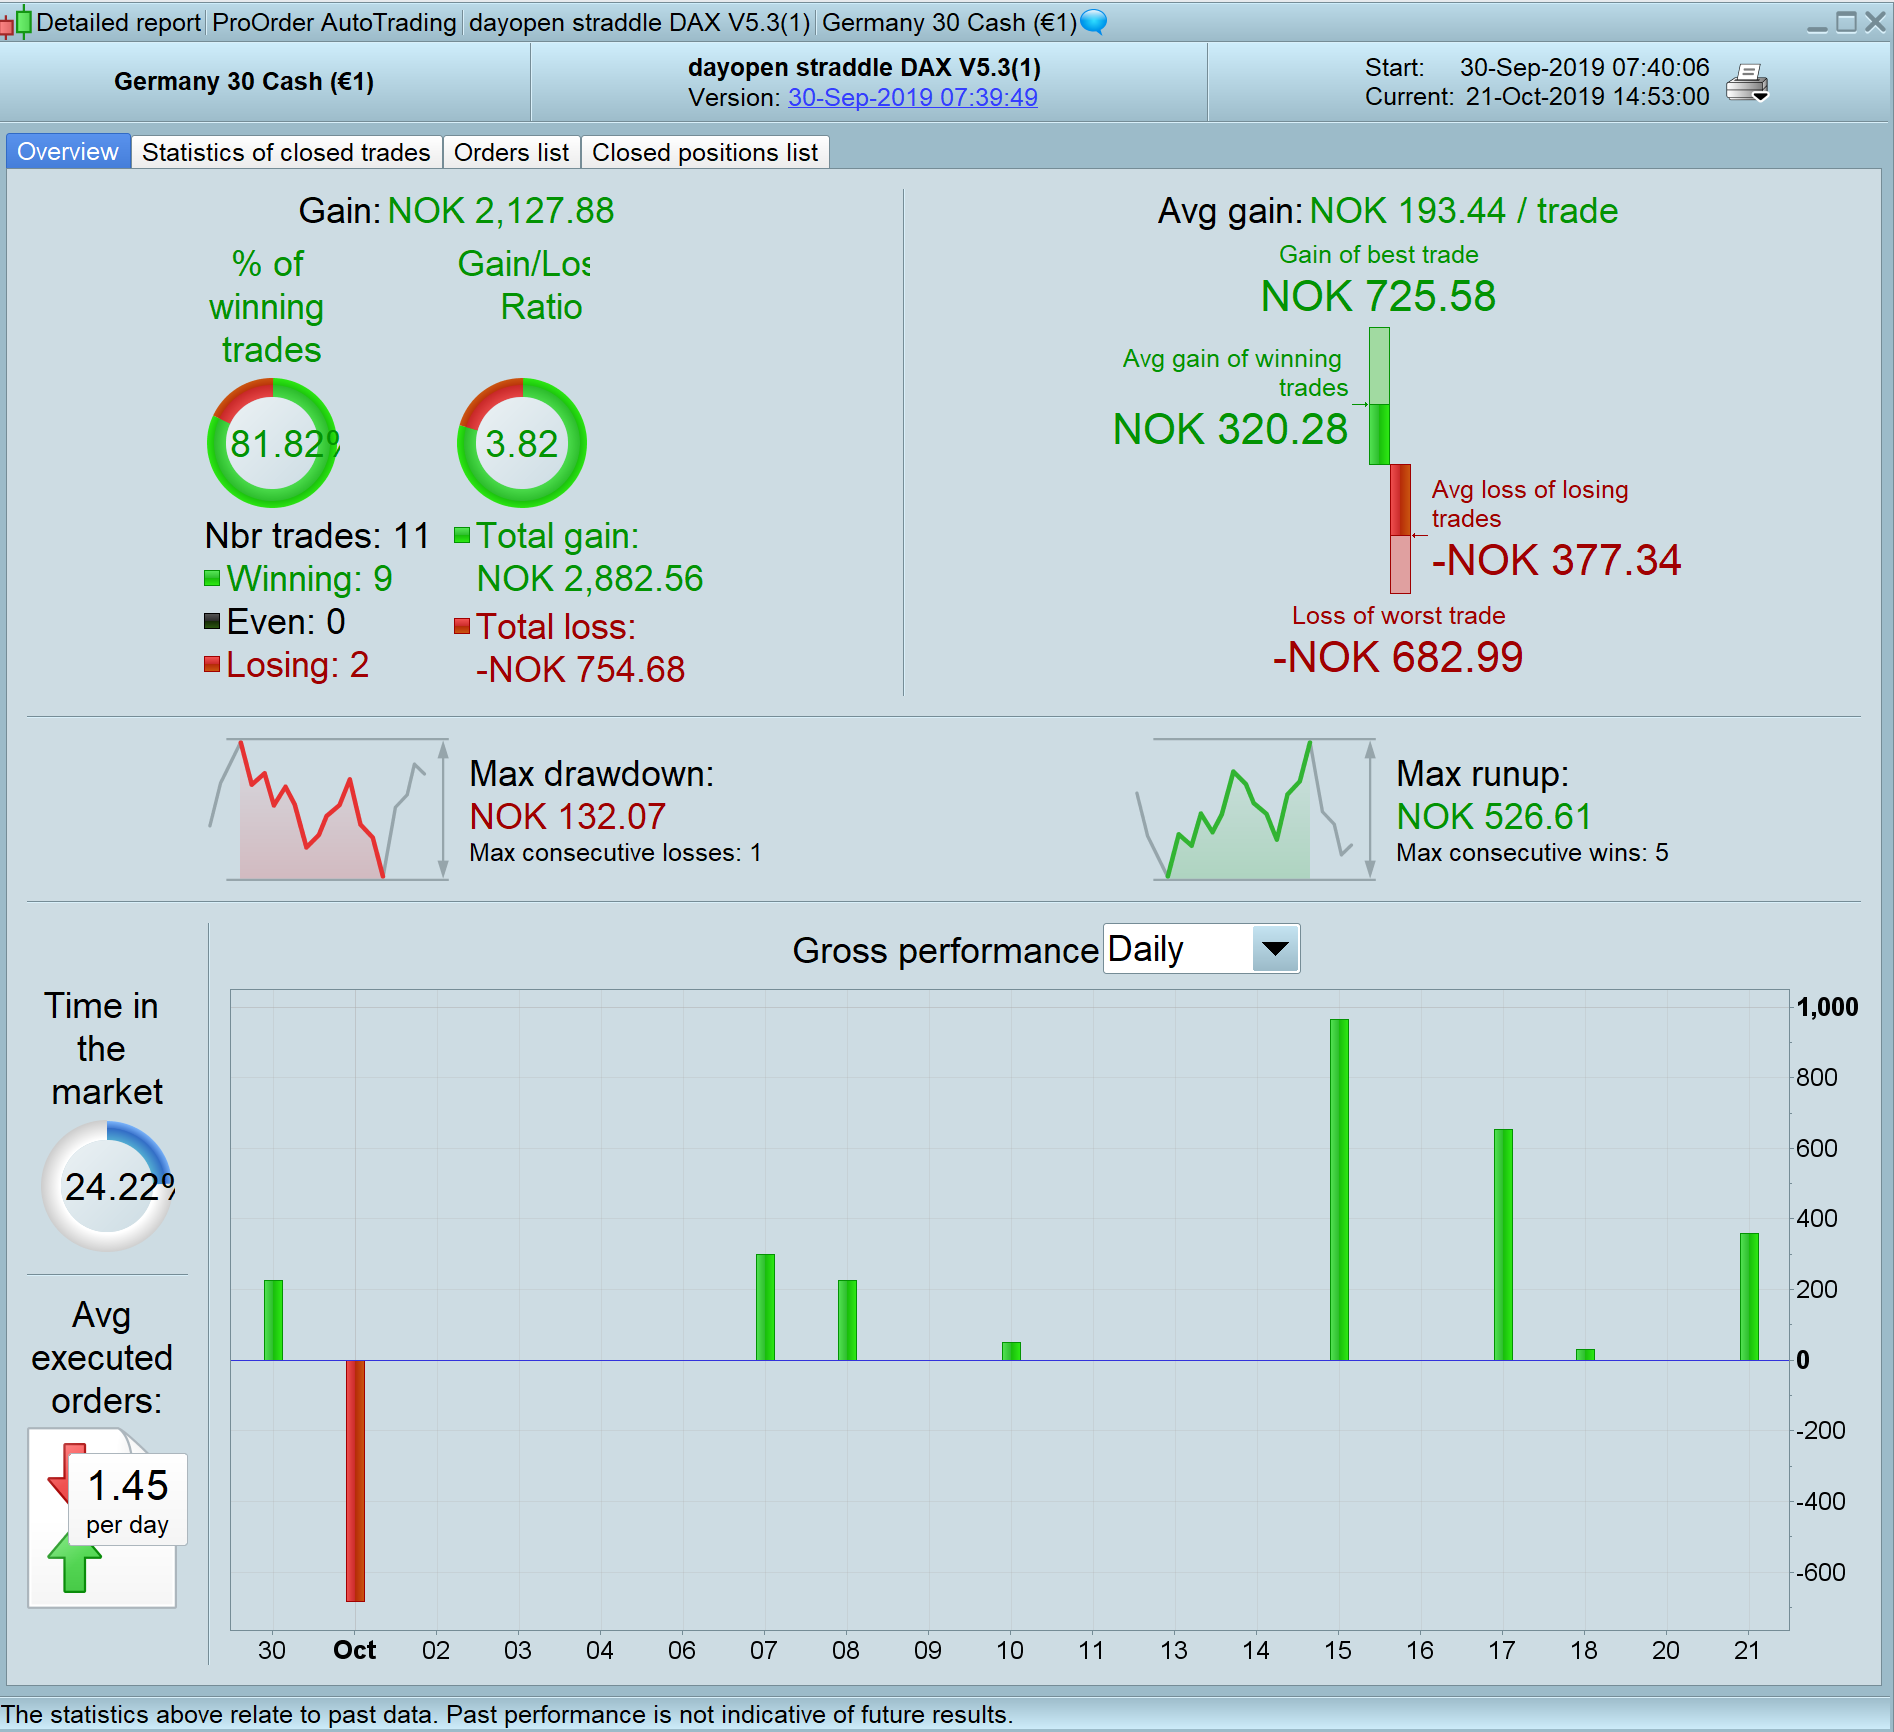
Since running variants of this in both demo and live I’ve had the feeling that the dax daily open has a strong tendency to fool this strategy the first minute about which direction things will go.
I have tested to run ‘once entertime = 090200’ instead of ‘090000’ and since 30 september G/L of this version has been 3.82, (same profitability both long and short) compared to backtest of ‘090000’ version which gives 1.73 G/L and losing on short positions.
I haven’t studied this strategy deeply so maybe I am missing something and how it could impact the strategy performance over time.
Any thoughts?
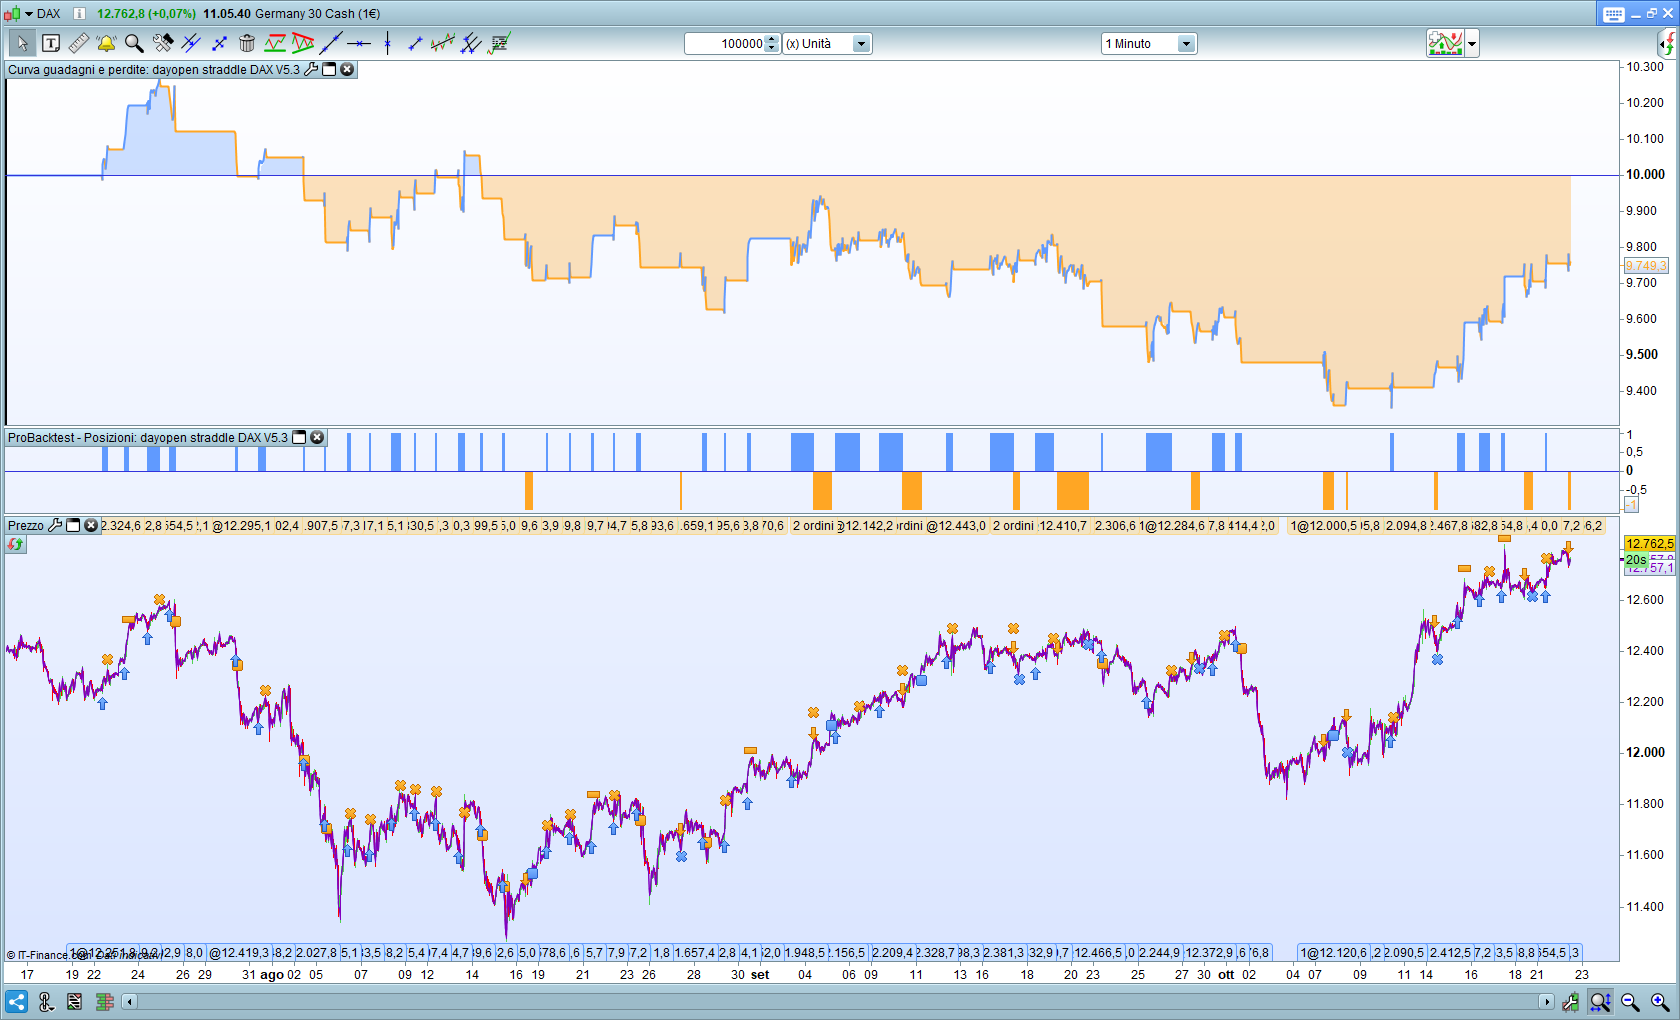
You try with ‘once entertime=090000’ and timeframe=2 minute
Actually I tried with 1 minute. No change there. Or is that a suggestion?
You try with ‘once entertime=090000’ and timeframe=2 minute
OK I see what you mean now. It doesn’t quite give the same results since 30 september.
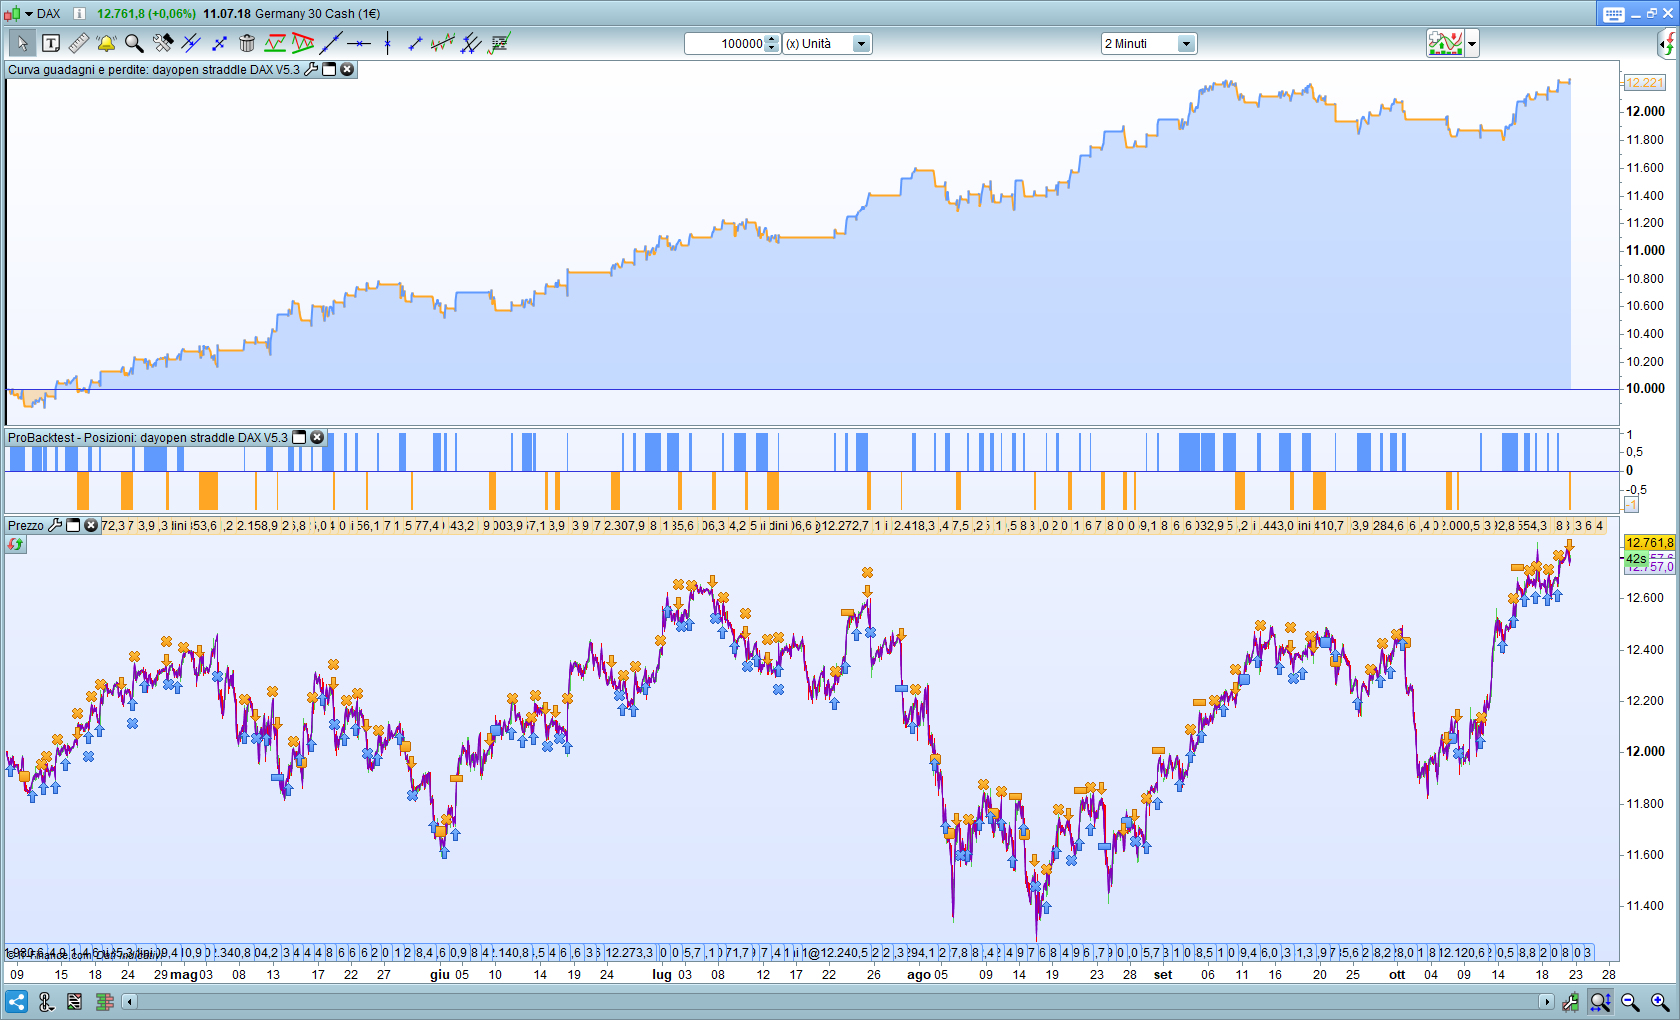
You have to test a system over a longer period: set up 100,000 units (x units)
MODERATORS EDIT: I have deleted your accidental identical post in the other forum.
PaulParticipant
Master
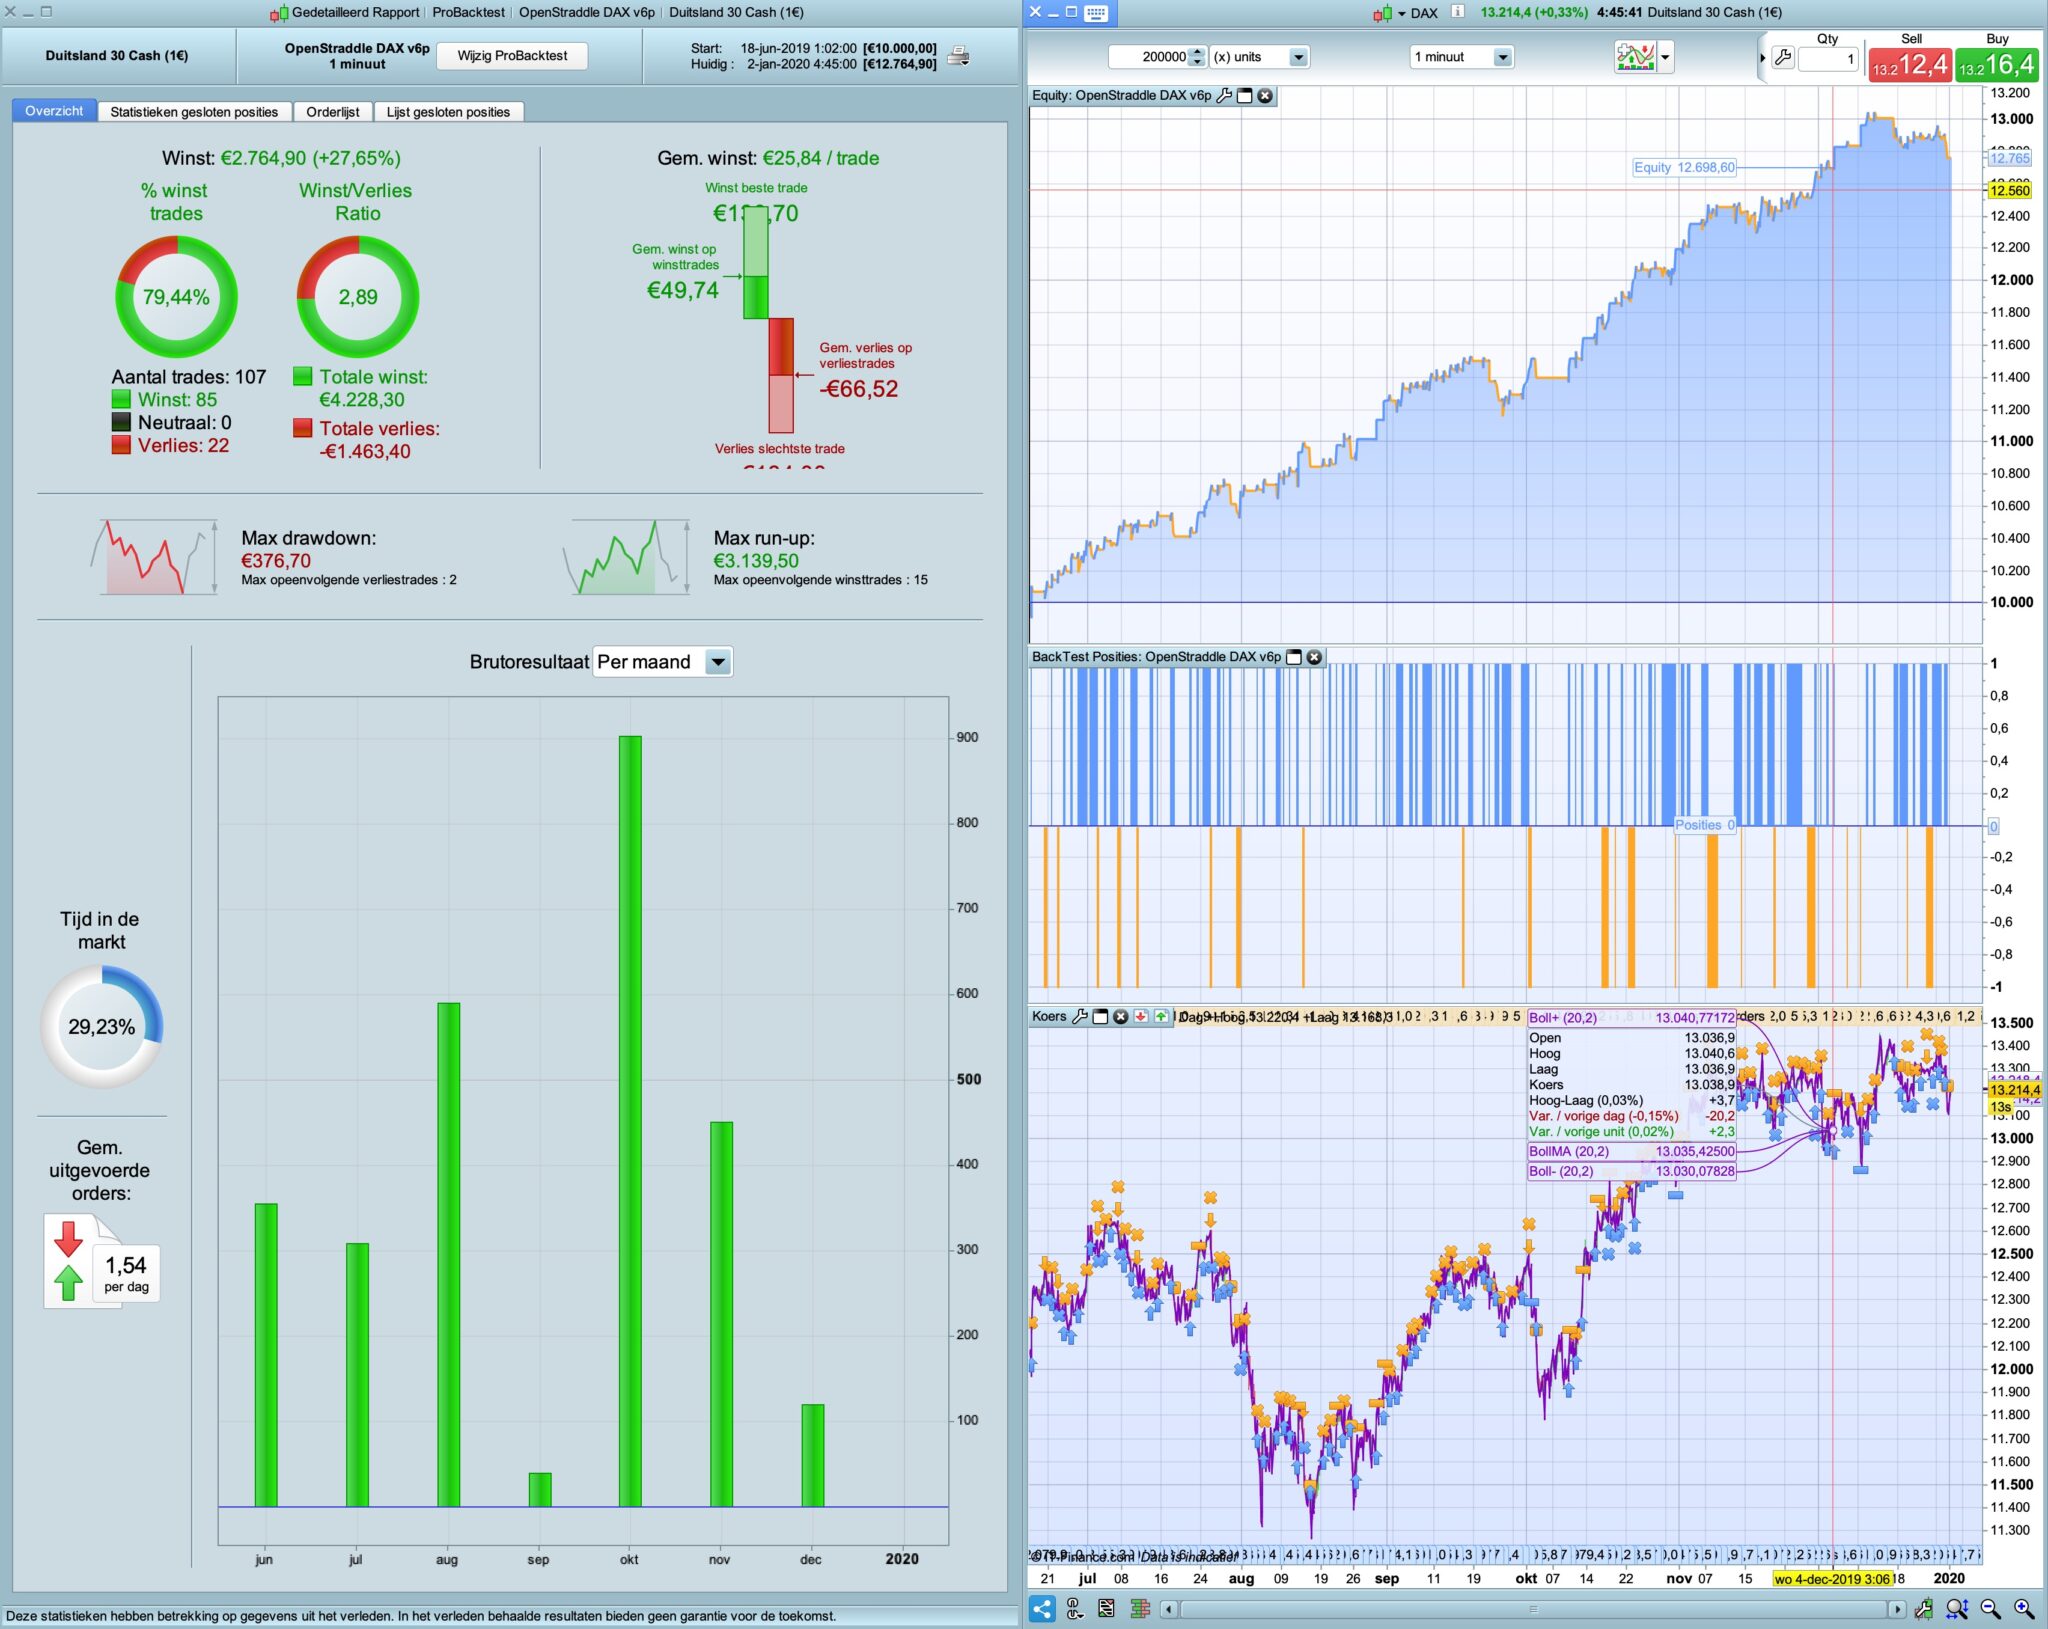
an update to this strategy
Good evening,
I have backtested your strategy for the last 6 months of 2019: it looks promising!
What were the real results for the first 6 months of 2019 and previous years?
Hi guys !
impressive results with this strategy !
Can I have a consideration that may improve the results ?
With my poor 100k of backtest, I have the impression by watching on higher timeframe H1 that we manage to decrease the losses?
Explanation : with each losing trade, i saw (in H1) the 9 o’clock candle closes in the wrong direction of the position. But the reverse works almost all the time.
I’m sorry to ask but I’m bad in programming !
Is it possible to add a position closure if the 9 o’clock candle H1 closes in the wrong direction?
thank you so much and thanks to your jobs 😉
PaulParticipant
Master
@funkystuff
Thanks for the suggestion!
on top:
defparam cumulateorders = false
defparam preloadbars = 10000

TIMEFRAME (default)
next above entry
// added suggestion funkystuff
TIMEFRAME (1 hour, updateonclose)

once toggle1=1

if toggle1 then
if intradaybarindex=9 then
if longonmarket then
if close<open then
sell at market
endif
endif
if shortonmarket then
if close>open then
exitshort at market
endif
endif
endif
endif
TIMEFRAME (default)
Arrfff I was wrong… 🙁
However I was convinced !! Damn it !
Really thanks Paul and sorry to lose your time
I tried to add a breakeven function at the code on 3 min timeframe, and these are the results of the last month.
PaulParticipant
Master
@funkystuff np! I that’s why I post them, to get new ideas.
@Francesco Petrone Looks nice but it needs more data to test. Can you post the code or adjustments?