AE
AEParticipant
Senior
Hi guys,
Let me show you this simple strategy using SAR. It use a simple SAR with two filters (stochastic and macd) to select better operations.
I have a lot of fake signals but anyway winners are better than lossers so it make money.
It works for DAX 1h.
Any idea to improve this strategy?
// Definición de los parámetros del código
DEFPARAM CumulateOrders = False // Acumulación de posiciones desactivada

// Condiciones para entrada de posiciones largas
parabolic = SAR[0.02,0.02,0.2]
sto = Stochastic[5,3](close)
signal = average[3](sto)

mac = MACD[12,26,9](close)


c1 = (parabolic < close)
c2 = (signal > 50)
c3 = (parabolic[1] > close[1])


IF c1 AND c2 AND c3 and mac >0 THEN
BUY 1 CONTRACT AT MARKET
ENDIF
// Condiciones de salida de posiciones largas

c4 = (close < parabolic)

IF c4 THEN
SELL AT MARKET
ENDIF

c5 = (parabolic > close)
c6 = (parabolic[1] < close[1])

if not c2 and c5 and c6 and mac < 0 then
Sellshort 1 contract at market
endif

c7 = (close > parabolic)

IF c7 THEN
EXITSHORT AT MARKET
ENDIF

SET STOP pTRAILING 55
Thanks for sharing with us online.
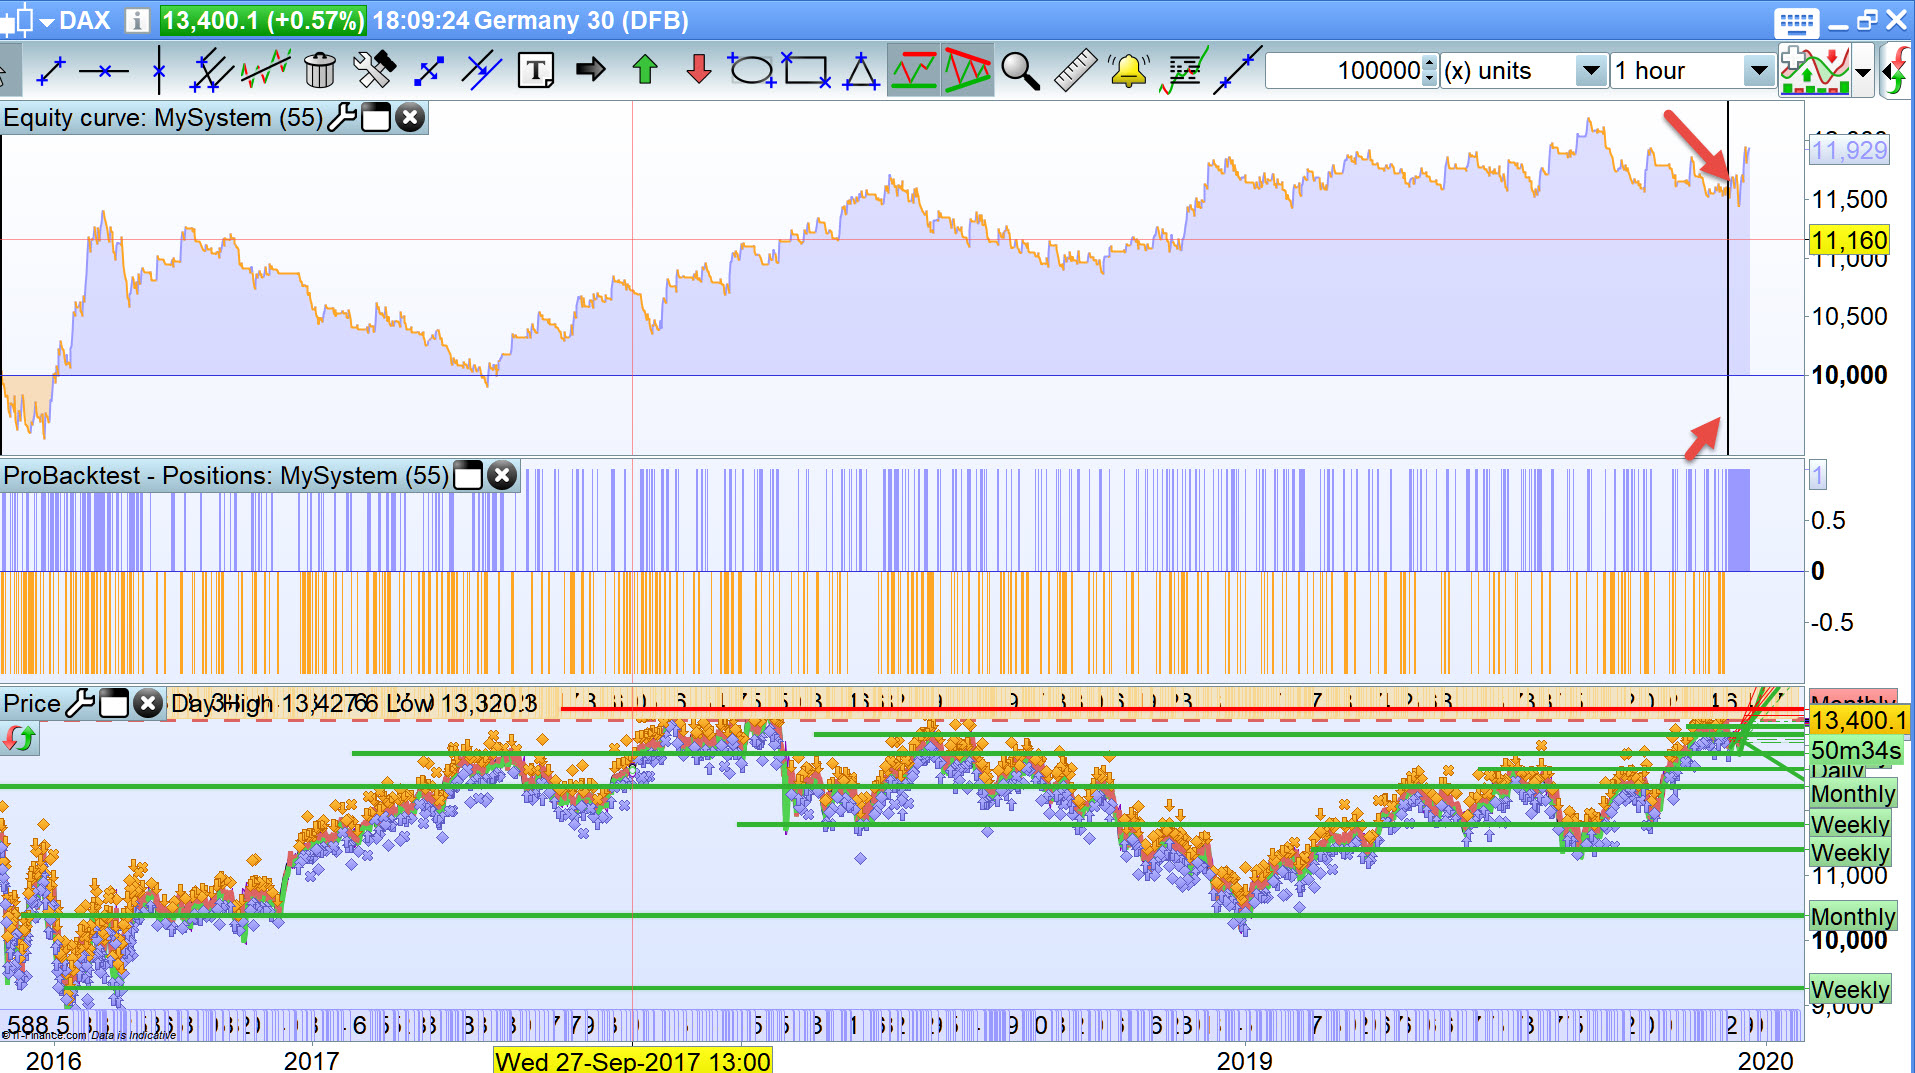
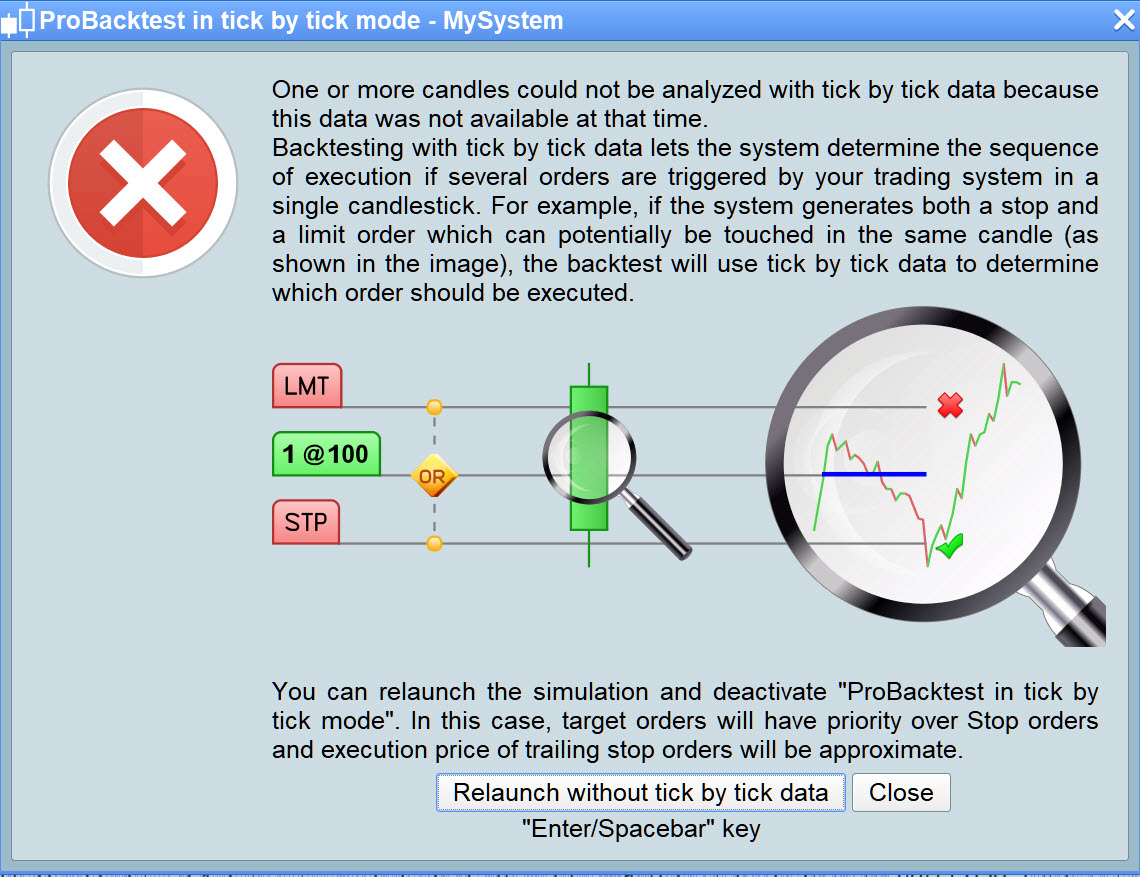
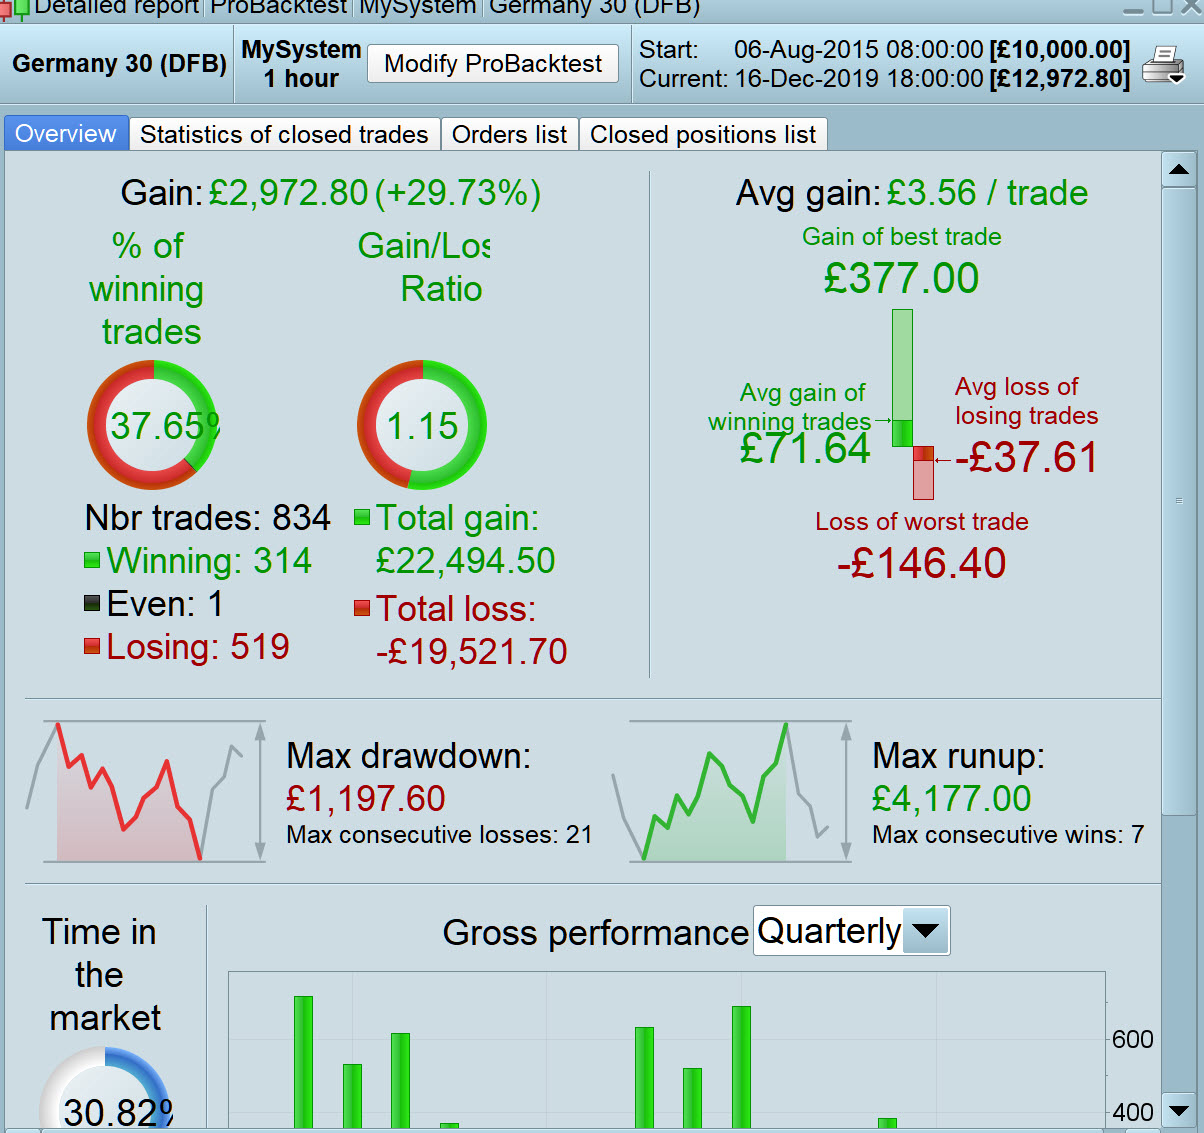
With TS = 55, I get attached error message and the Strategy stopped at the red arrowheads.
Do you get same over 100k bars?
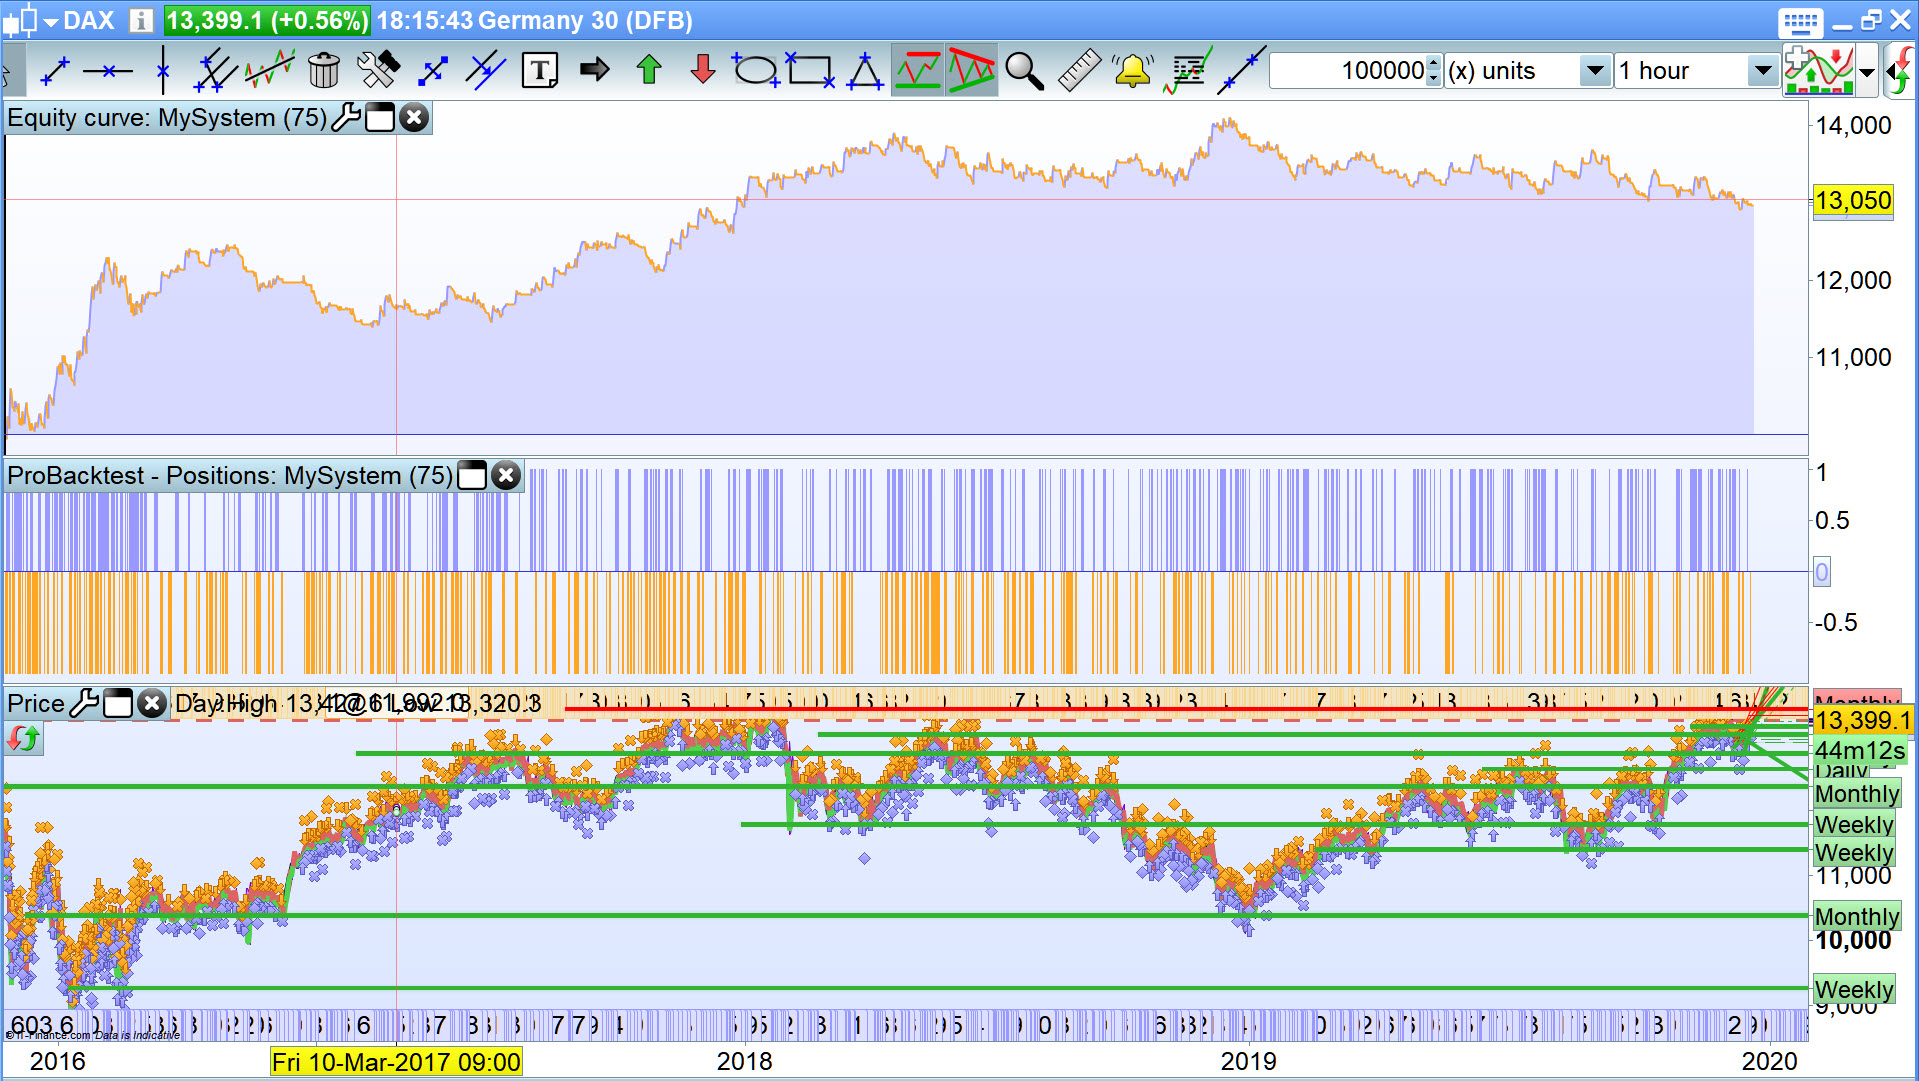
But with TS = 75 I get attached … much better! 🙂
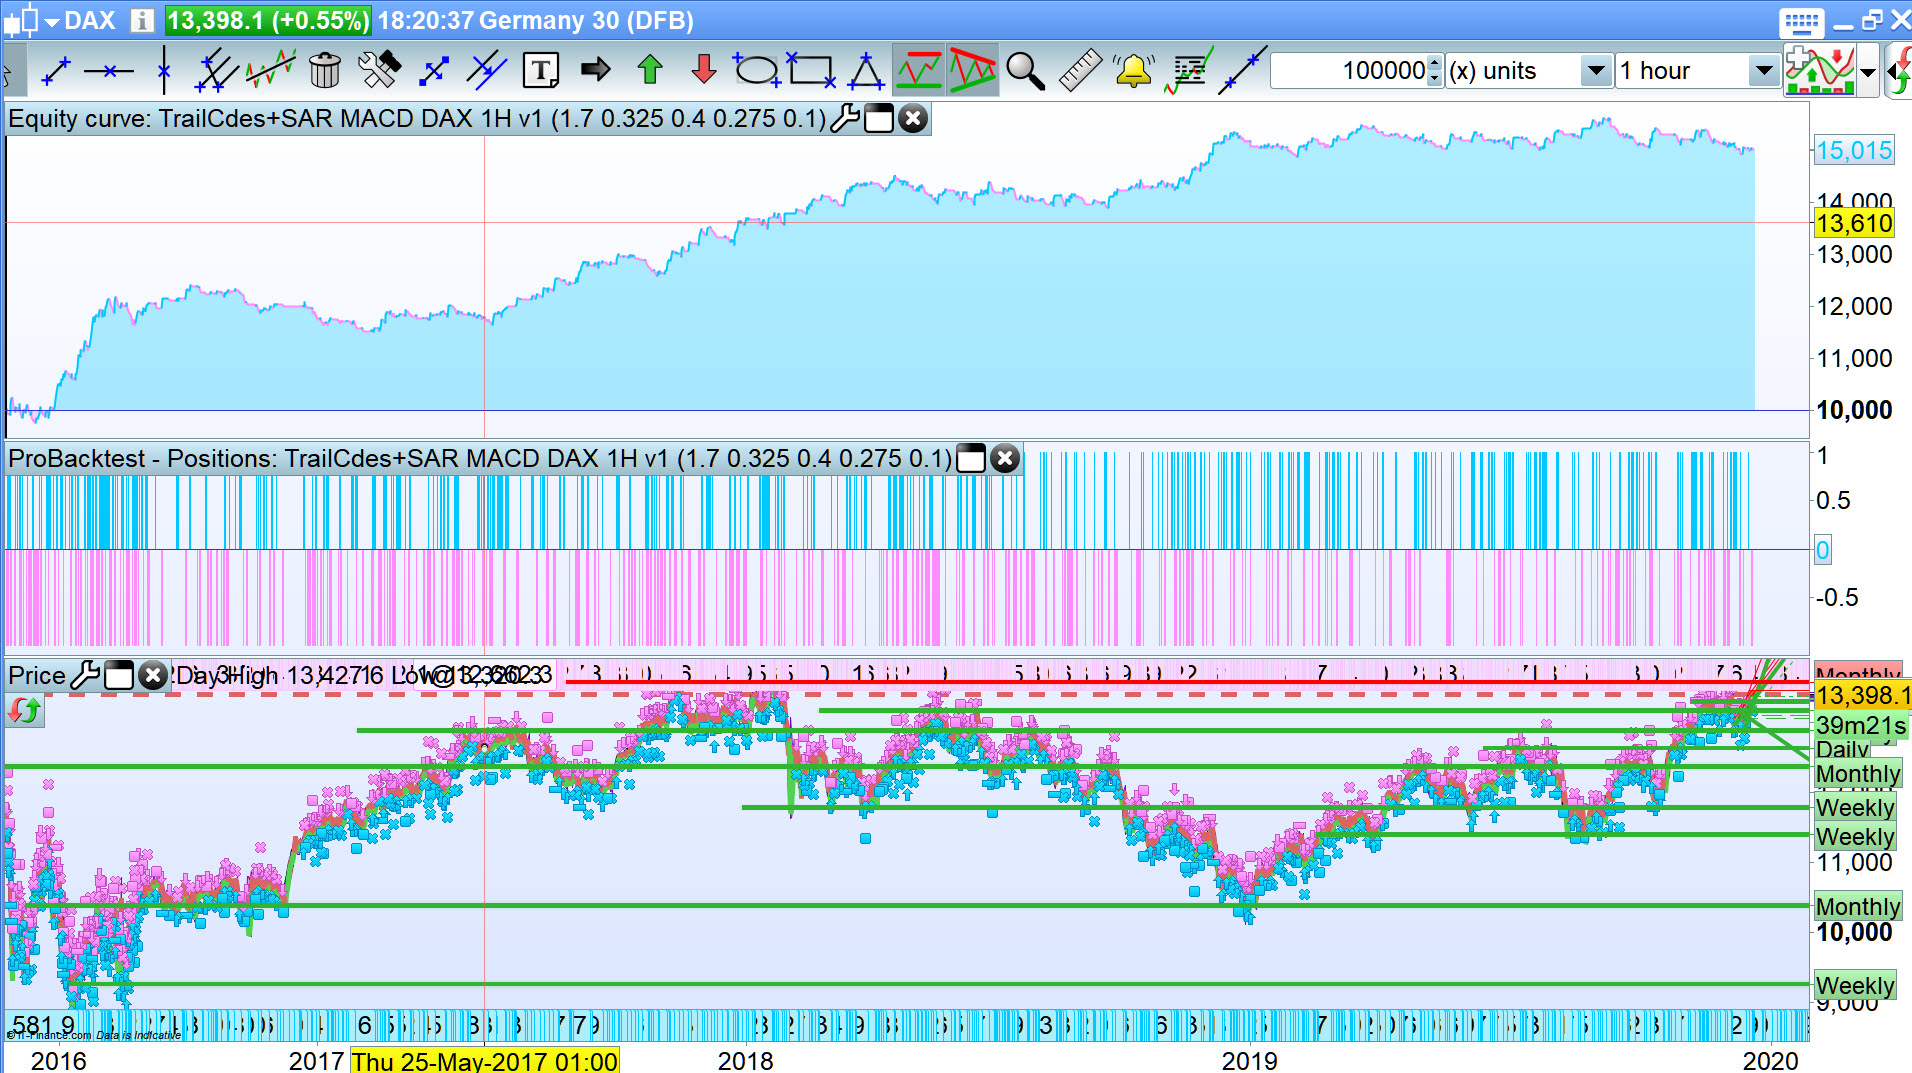
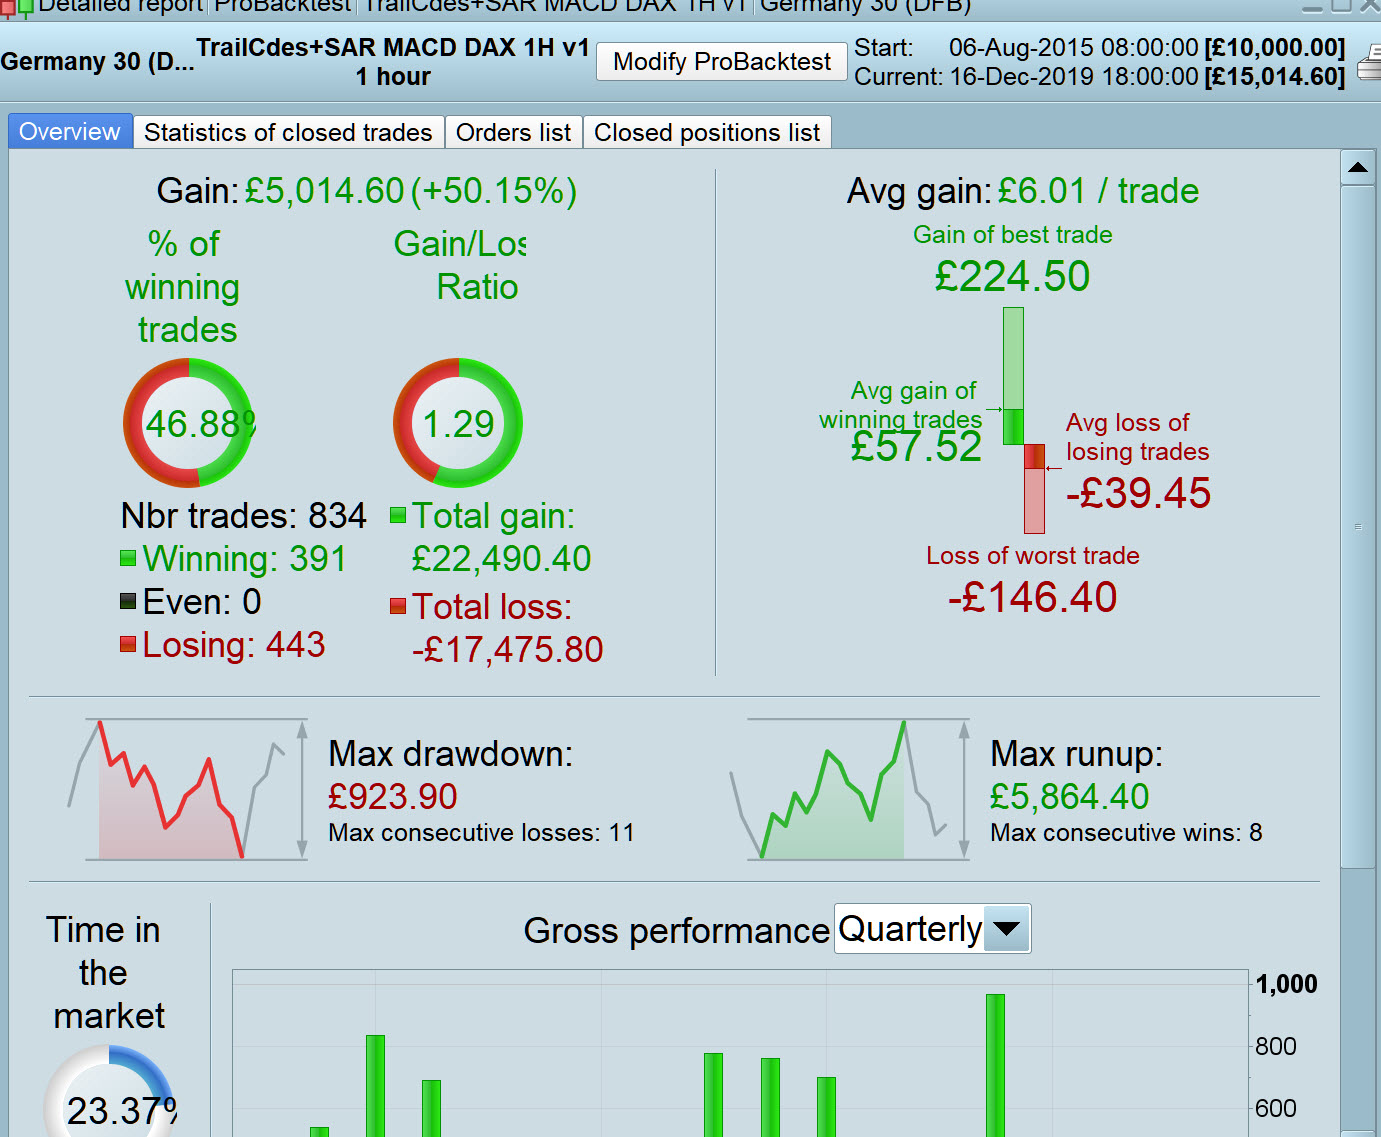
And using the TS code found at Log 65 here …
Snippet Link Library
I get attached … better again! 🙂
AEParticipant
Senior
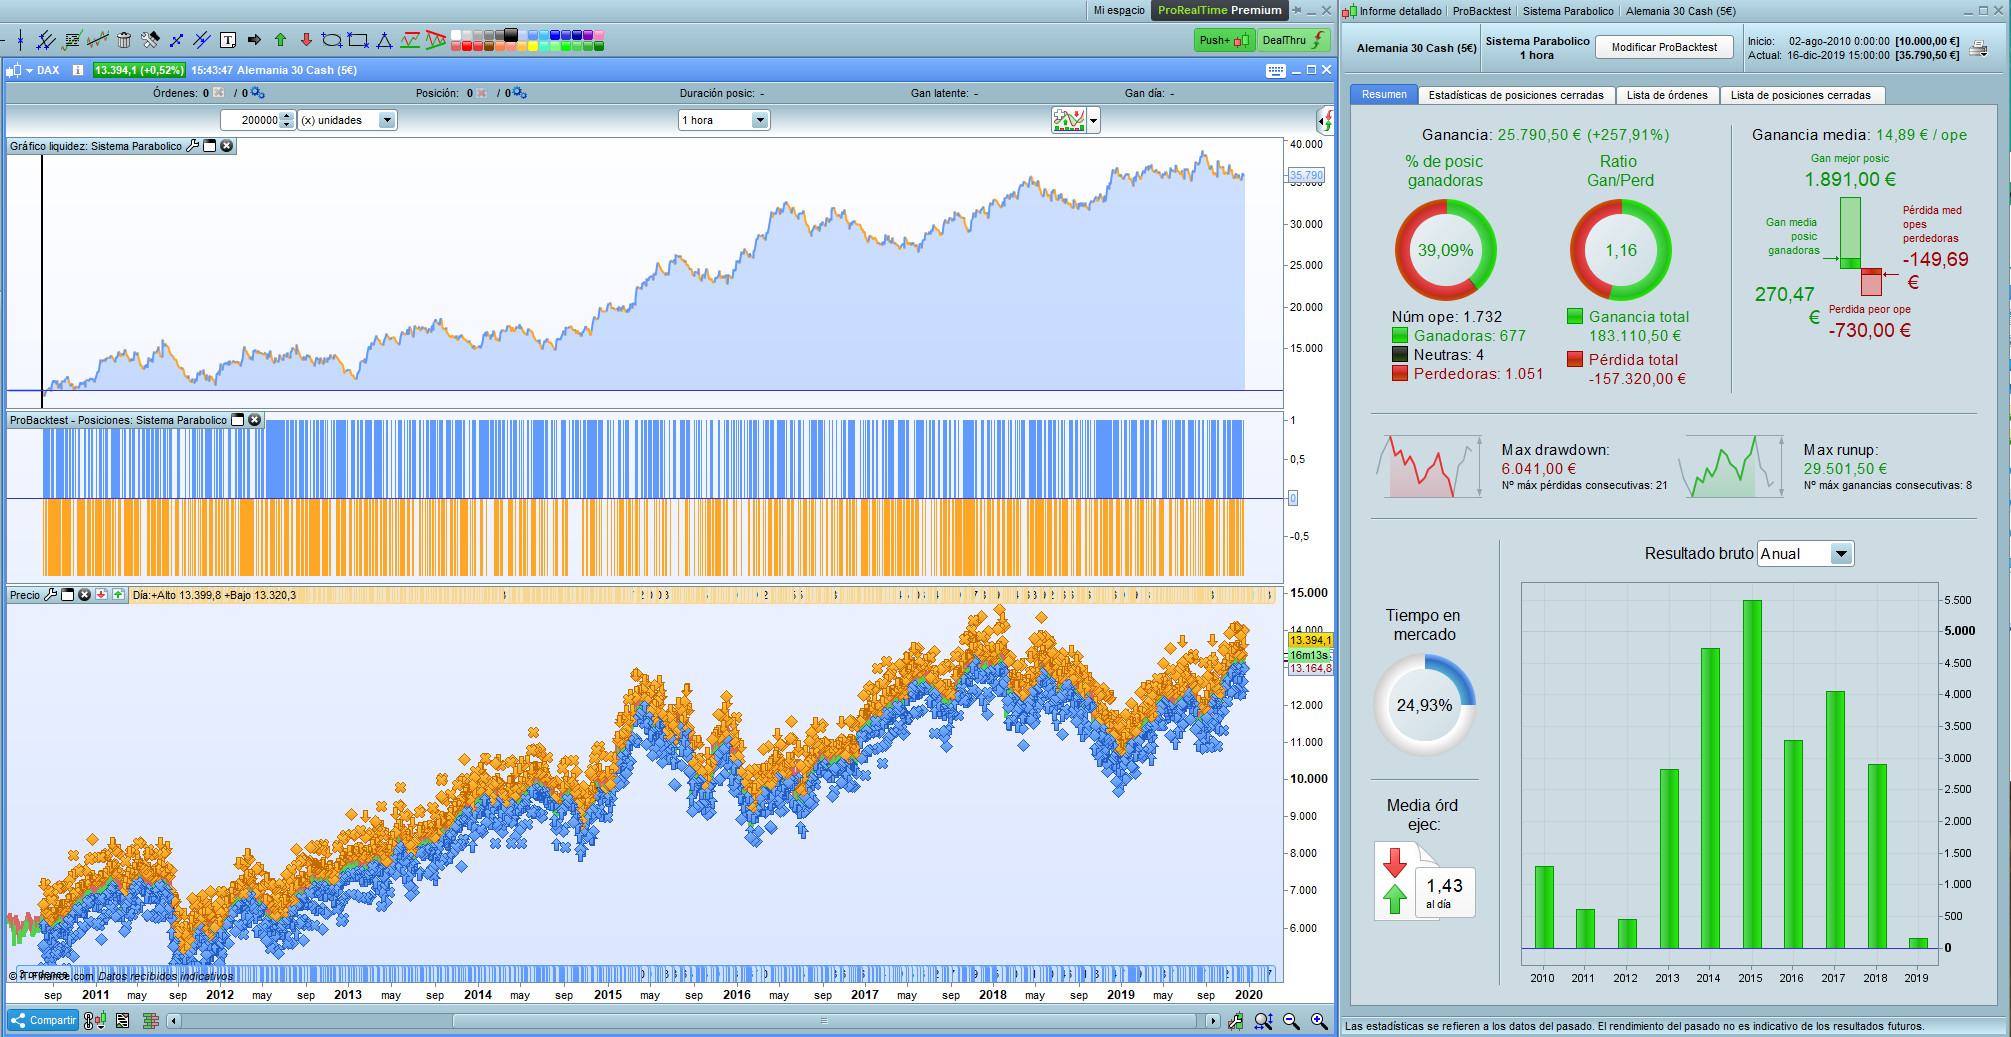
In deed, with no TS you will get the best result, but the DD is more high. Check the picture
Ideas to improve it? 😀
With TS = 55, I get attached error message and the Strategy stopped at the red arrowheads.
You’ve unfortunately hit on a tick by tick data hole. I see this error quite often on the DJI daily when using tick by tick because there is a day sometime in 2010 that has data problems or no tick by tick and if a trade happens to be open on this day then the strategy crashes and gives me that error message.
Thank you Vonasi … I had no thoughts on what had caused the stoppage … ‘tick by tick data hole’ … I like it (well only the description! 🙂
Hello.
Forgive my ignorance and my English, I am new.
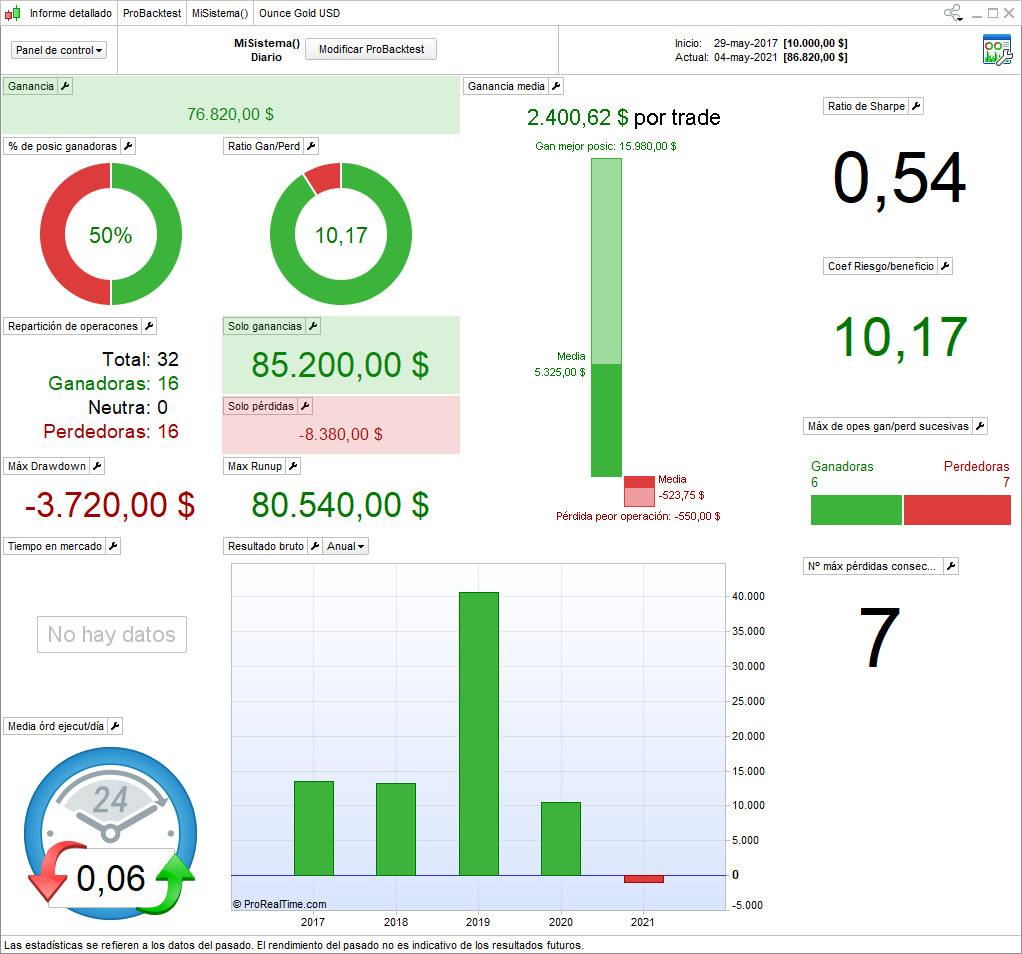
Applying it to Gold I get this (photo attached).
As you see ???. Thanks. Greetings.
@DECO2021
What’s your question exactly, is it too good to be true or is it not as good as expected?
Did you include spread?
Did you use tick-by-tick mode?
How many lots/contracts did you trade each time?
Please post the ITF file you have used.
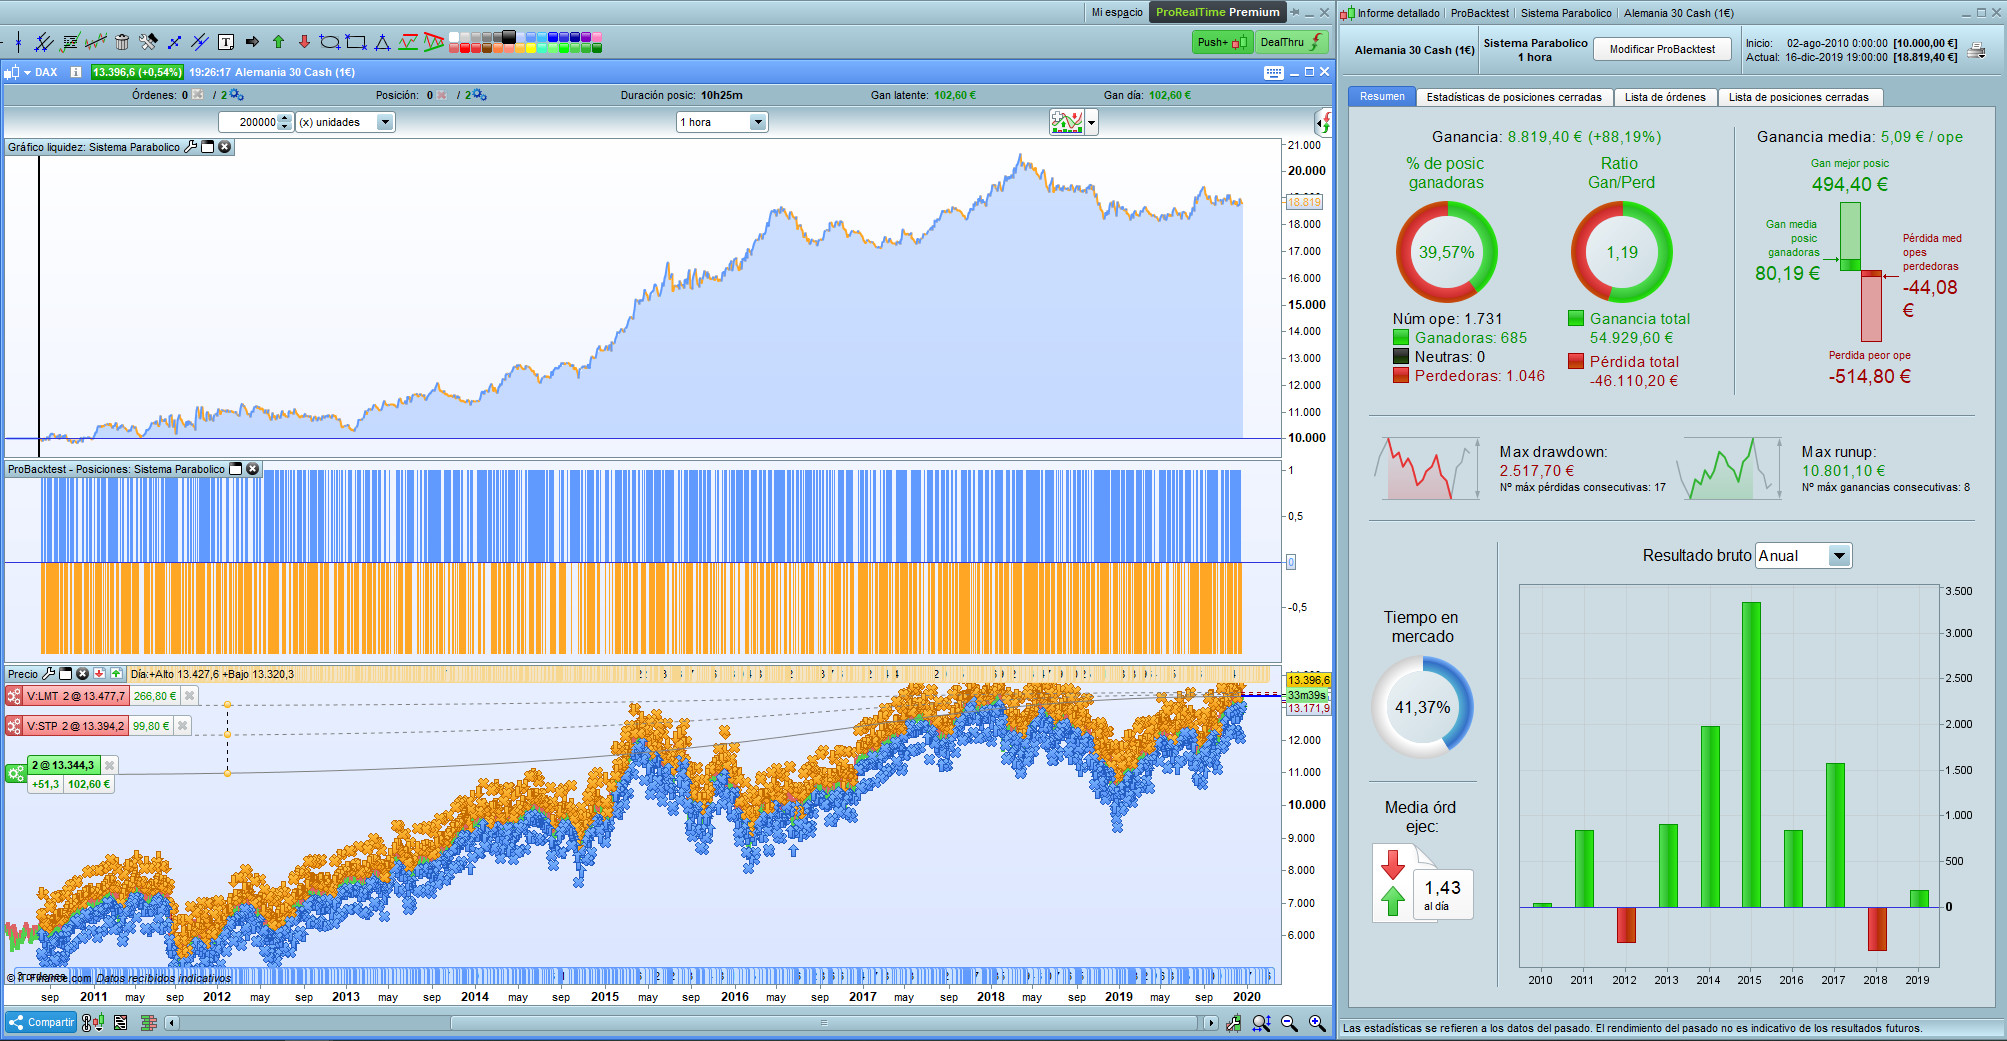
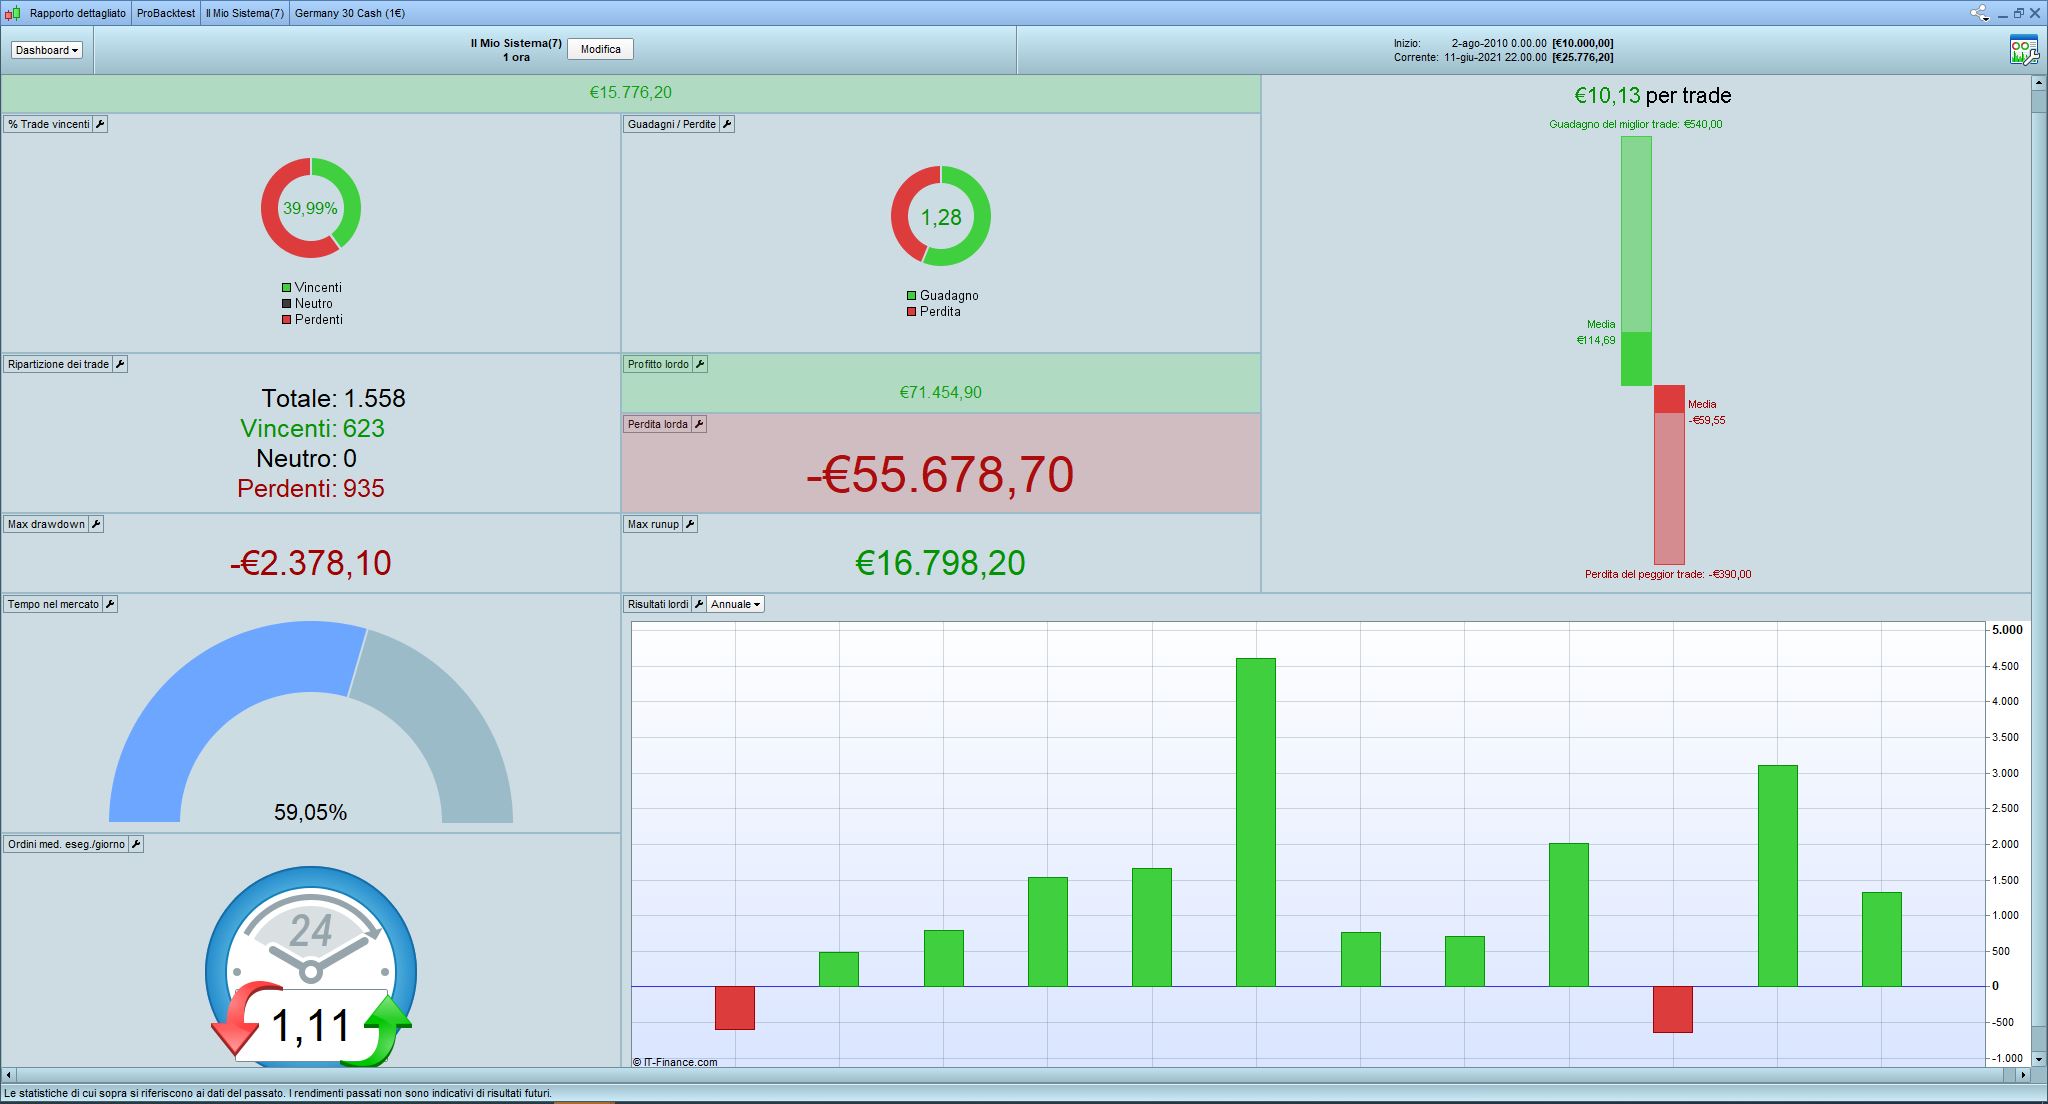
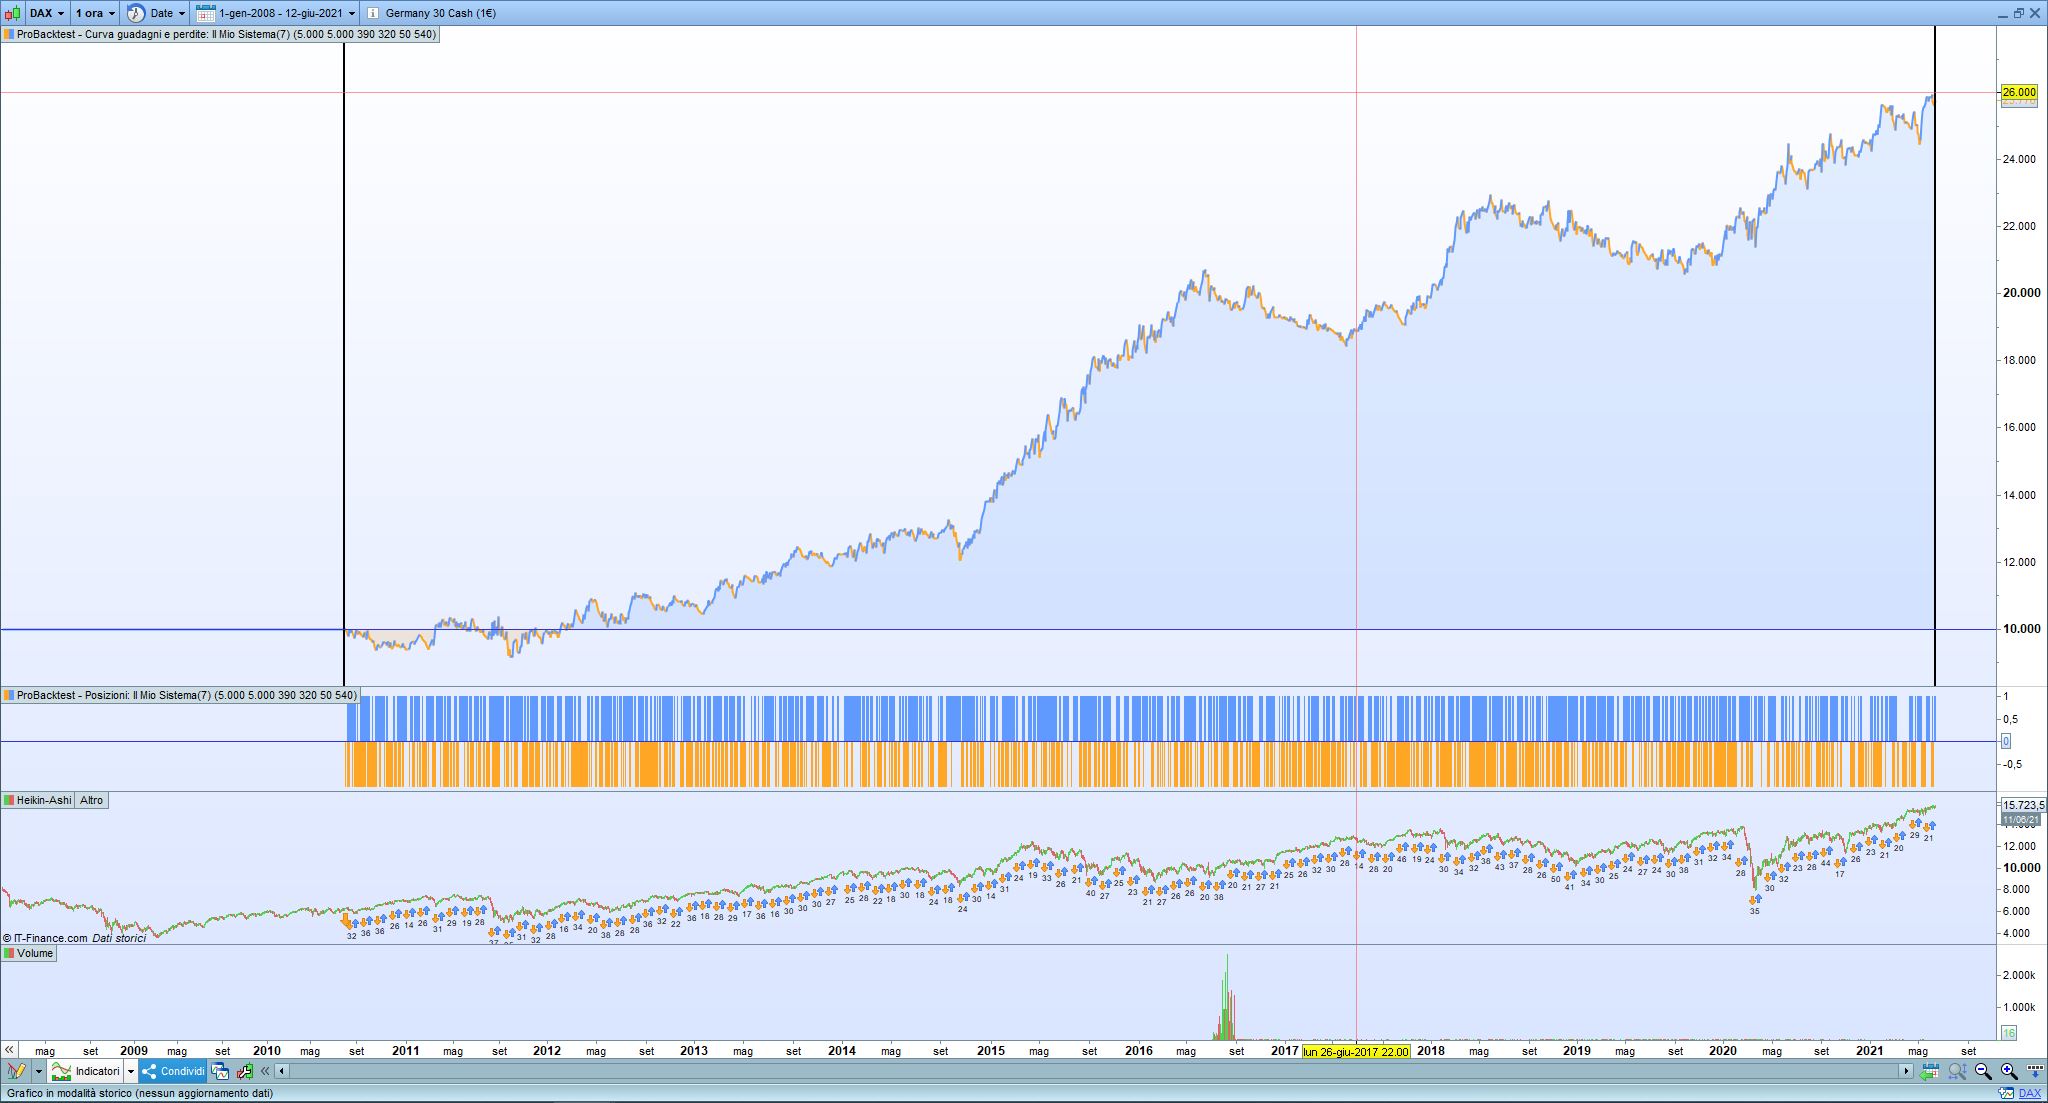
Hi, I’d improved this system with fix stop loss and take profit and Nicolas’s trailing stop. I add a condition that close trade on friday after time that I setted.
I attach file and images of equity and report. In my opinion we have to filter much better, because there are a lot of trade and we have to consider overnight costs (if someone expert coder can do that).
I backtested this system from 2010 to now with tick by tick mode with 2point spread.
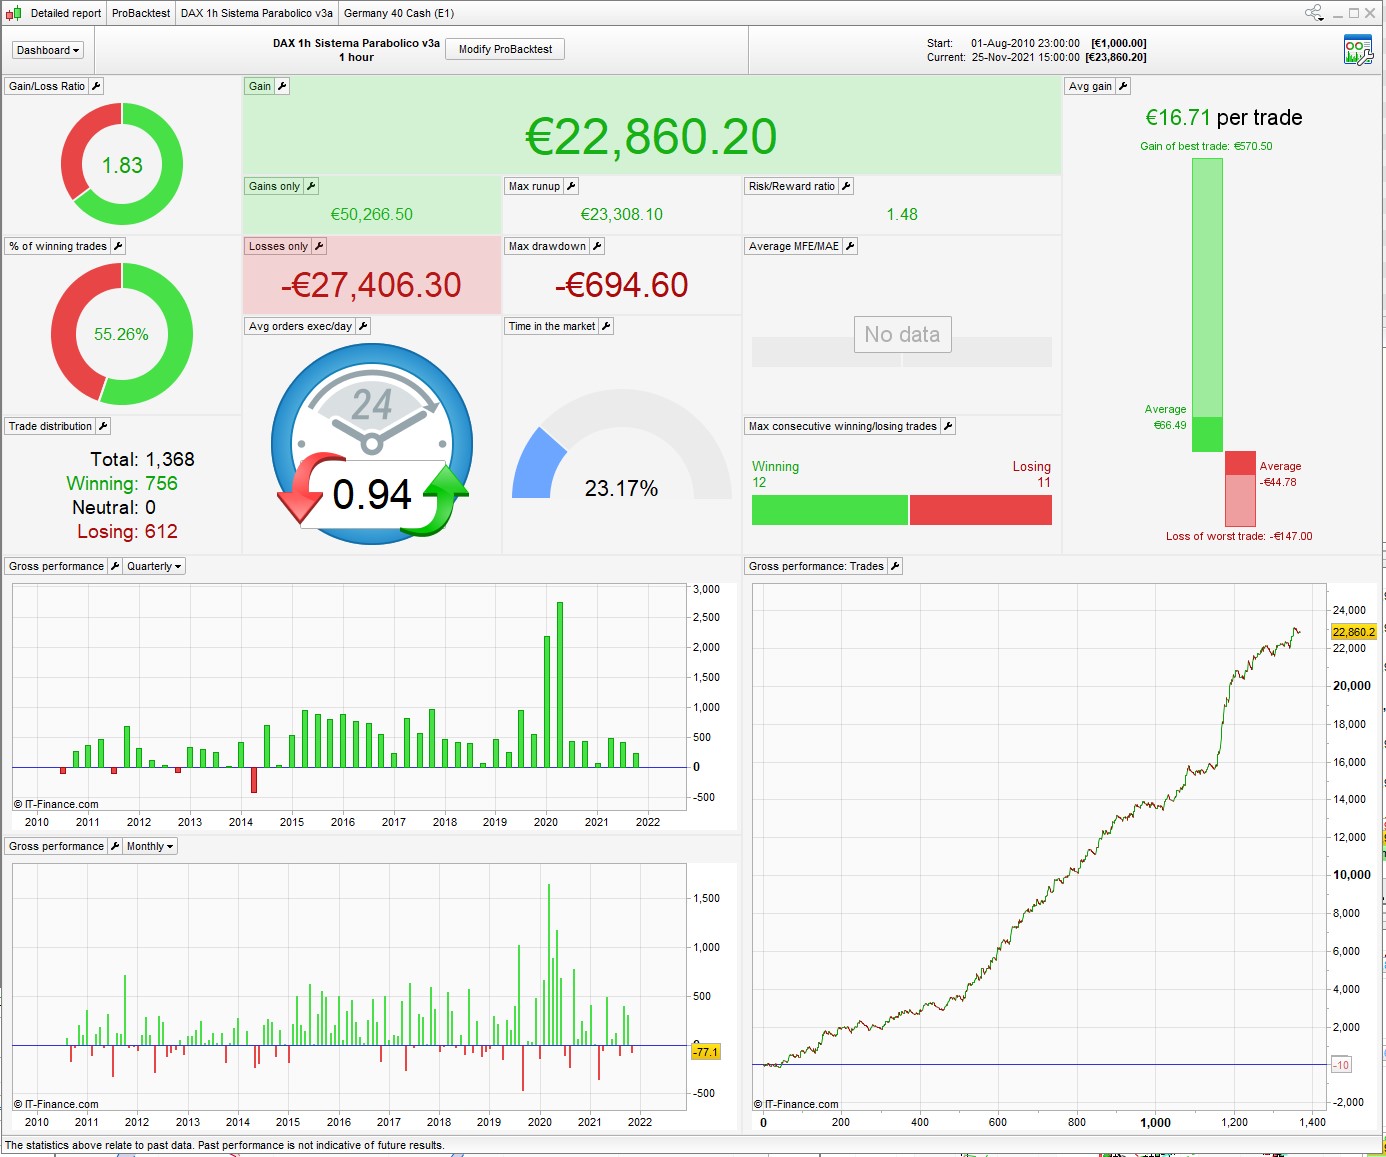
I came across this in the library – thanks to AE for sharing.
Made a few changes, tweaked the numbers here and there, I’m sure there’s still room for improvement.
***Optimized on 100% of data so still needs out of sample testing***
No reason this shouldn’t be re-optimized for the NAS, SP etc.
// 25/11/21
DEFPARAM CumulateOrders = False // Acumulación de posiciones desactivada
DEFPARAM preloadbars = 10000

positionsize=1

Timeframe (4 hours)
ma = average[p,t](typicalprice)
cb1 = ma > ma[1]

mb = average[p2,t2](typicalprice)
cs1 = mb < mb[1]

Timeframe (default)
parabolic = SAR[q,w,e]
parabolicS = SAR[qs,ws,es]

sto = Stochastic[s1,s2](close)
signal = average[av,t3](sto)
mac = MACD[m,a,c](close)

cb2 = (close > parabolic)
cb3 = (close[1] < parabolic[1])

cs2 = (close < parabolicS)
cs3 = (close[1] > parabolicS[1])

cb4 = (signal > l)
cs4 = (signal < s)

//Stochastic RSI | indicator
lengthRSI = lr //RSI period
lengthStoch = ls //Stochastic period
smoothK = sk //Smooth signal of stochastic RSI
smoothD = sd //Smooth signal of smoothed stochastic RSI
myRSI = RSI[lengthRSI](close)
MinRSI = lowest[lengthStoch](myrsi)
MaxRSI = highest[lengthStoch](myrsi)
StochRSI = (myRSI-MinRSI) / (MaxRSI-MinRSI)
K = average[smoothK](stochrsi)*100
D = average[smoothD](K)

cb5 = K>D
cs5 = K<D

//Volatility Filter
Vol = (Std[v1](Close) / Close) * 100
cb6 = Vol < v2
cs6 = Vol < v3

CB = cb1 AND cb2 AND cb3 and cb4 and cb5 and cb6 and mac >0
CS = cs1 AND cs2 AND cs3 and cs4 and cs5 and cs6 and mac <0

IF CB THEN
BUY positionsize CONTRACT AT MARKET
SET STOP %LOSS sl
SET TARGET %PROFIT tp
ENDIF

// Condiciones de salida de posiciones largas
IF cs2 THEN
SELL AT MARKET
ENDIF

if CS then
Sellshort positionsize contract at market
SET STOP %LOSS sls
SET TARGET %PROFIT tps
endif

IF cb2 THEN
EXITSHORT AT MARKET
ENDIF

// %trailing stop function incl. cumulative positions
once trailingstoptype1= 1
if trailingstoptype1 then
//====================
trailingpercentlong  = tsl // %
trailingpercentshort = tss // %
once acceleratorlong = a1 // [1] default; always > 0 (i.e. 0.5-3)
once acceleratorshort= a2 // 1 = default; always > 0 (i.e. 0.5-3)
ts2sensitivity  = 2 // 1 = close 2 = High/Low 3 = Low/High 4 = typicalprice (not use once)
//====================
once steppercentlong  = (trailingpercentlong/10)*acceleratorlong
once steppercentshort = (trailingpercentshort/10)*acceleratorshort
if onmarket then
trailingstartlong = positionprice*(trailingpercentlong/100)
trailingstartshort = positionprice*(trailingpercentshort/100)

trailingsteplong = positionprice*(steppercentlong/100)
trailingstepshort = positionprice*(steppercentshort/100)
endif

if not onmarket or ((longonmarket and shortonmarket[1]) or (longonmarket[1] and shortonmarket)) then
newsl           = 0
mypositionprice = 0
endif
positioncount = abs(countofposition)
if newsl > 0 then
if positioncount > positioncount[1] then
if longonmarket then
newsl = max(newsl,positionprice * newsl / mypositionprice)
else
newsl = min(newsl,positionprice * newsl / mypositionprice)
endif
endif
endif
if ts2sensitivity=1 then
ts2sensitivitylong=close
ts2sensitivityshort=close
elsif ts2sensitivity=2 then
ts2sensitivitylong=high
ts2sensitivityshort=low
elsif ts2sensitivity=3 then
ts2sensitivitylong=low
ts2sensitivityshort=high
elsif ts2sensitivity=4 then
ts2sensitivitylong=typicalprice
ts2sensitivityshort=typicalprice
endif
if longonmarket then
if newsl=0 and ts2sensitivitylong-positionprice>=trailingstartlong then
newsl = positionprice+trailingsteplong
endif
if newsl>0 and ts2sensitivitylong-newsl>=trailingsteplong then
newsl = newsl+trailingsteplong
endif
endif
if shortonmarket then
if newsl=0 and positionprice-ts2sensitivityshort>=trailingstartshort then
newsl = positionprice-trailingstepshort
endif
if newsl>0 and newsl-ts2sensitivityshort>=trailingstepshort then
newsl = newsl-trailingstepshort
endif
endif
if barindex-tradeindex>1 then
if longonmarket then
if newsl>0 then
sell at newsl stop
endif
if newsl>0 then
if low crosses under newsl then
sell at market
endif
endif
endif
if shortonmarket then
if newsl>0 then
exitshort at newsl stop
endif
if newsl>0 then
if high crosses over newsl then
exitshort at market
endif
endif
endif
endif
mypositionprice = positionprice
endif

//*****************************************

//EXIT ZOMBIE TRADE
EZT = 1
if EZT then
IF longonmarket and (barindex-tradeindex(1)>= b1 and positionperf>0) or (barindex-tradeindex(1)>= b2 and positionperf<0) then
sell at market
endif
IF shortonmarket and (barindex-tradeindex(1)>= b3 and positionperf>0) or (barindex-tradeindex(1)>= b4 and positionperf<0) then
exitshort at market
endif
endif

//===================================
RSIexit = 1 // in profit
if RSIexit then
myrsi2=rsi[r](close)
if myrsi2<rl and barindex-tradeindex>1 and longonmarket and positionperf>0 then
sell at market
endif
if myrsi2>rs and barindex-tradeindex>1 and shortonmarket and positionperf>0 then
exitshort at market
endif
endif
Hi – like the look of the results. Was wondering, if you optimise on 100% of the data wouldn’t this effectively curve fit the results shown? So a higher risk that it may fall flat once live? Trying to learn – thanks
that’s why it needs out of sample testing. put it on demo for a few months, see what happens.
Or, you can do your own 70/30 optimization if you prefer.
I find testing in demo to be more reliable as it more closely resembles real trading conditions (changes in the spread, overnight fees etc)
That’s a good point. I have done the same, optimised a strategy on a 70/30 split then run in demo, and finally launched in an incubation phase on small size to test for a period of time. The issue is that the live trades don’t always match up to the back test trades (some trades are completely missing or there is a difference in profit/loss that is greater than the spread).
After all that I look to only keep those strategies which have a 90% or greater match between back test and live results. Optimising becomes dangerous if used excessively, but even still you will always get a difference between live and back test.