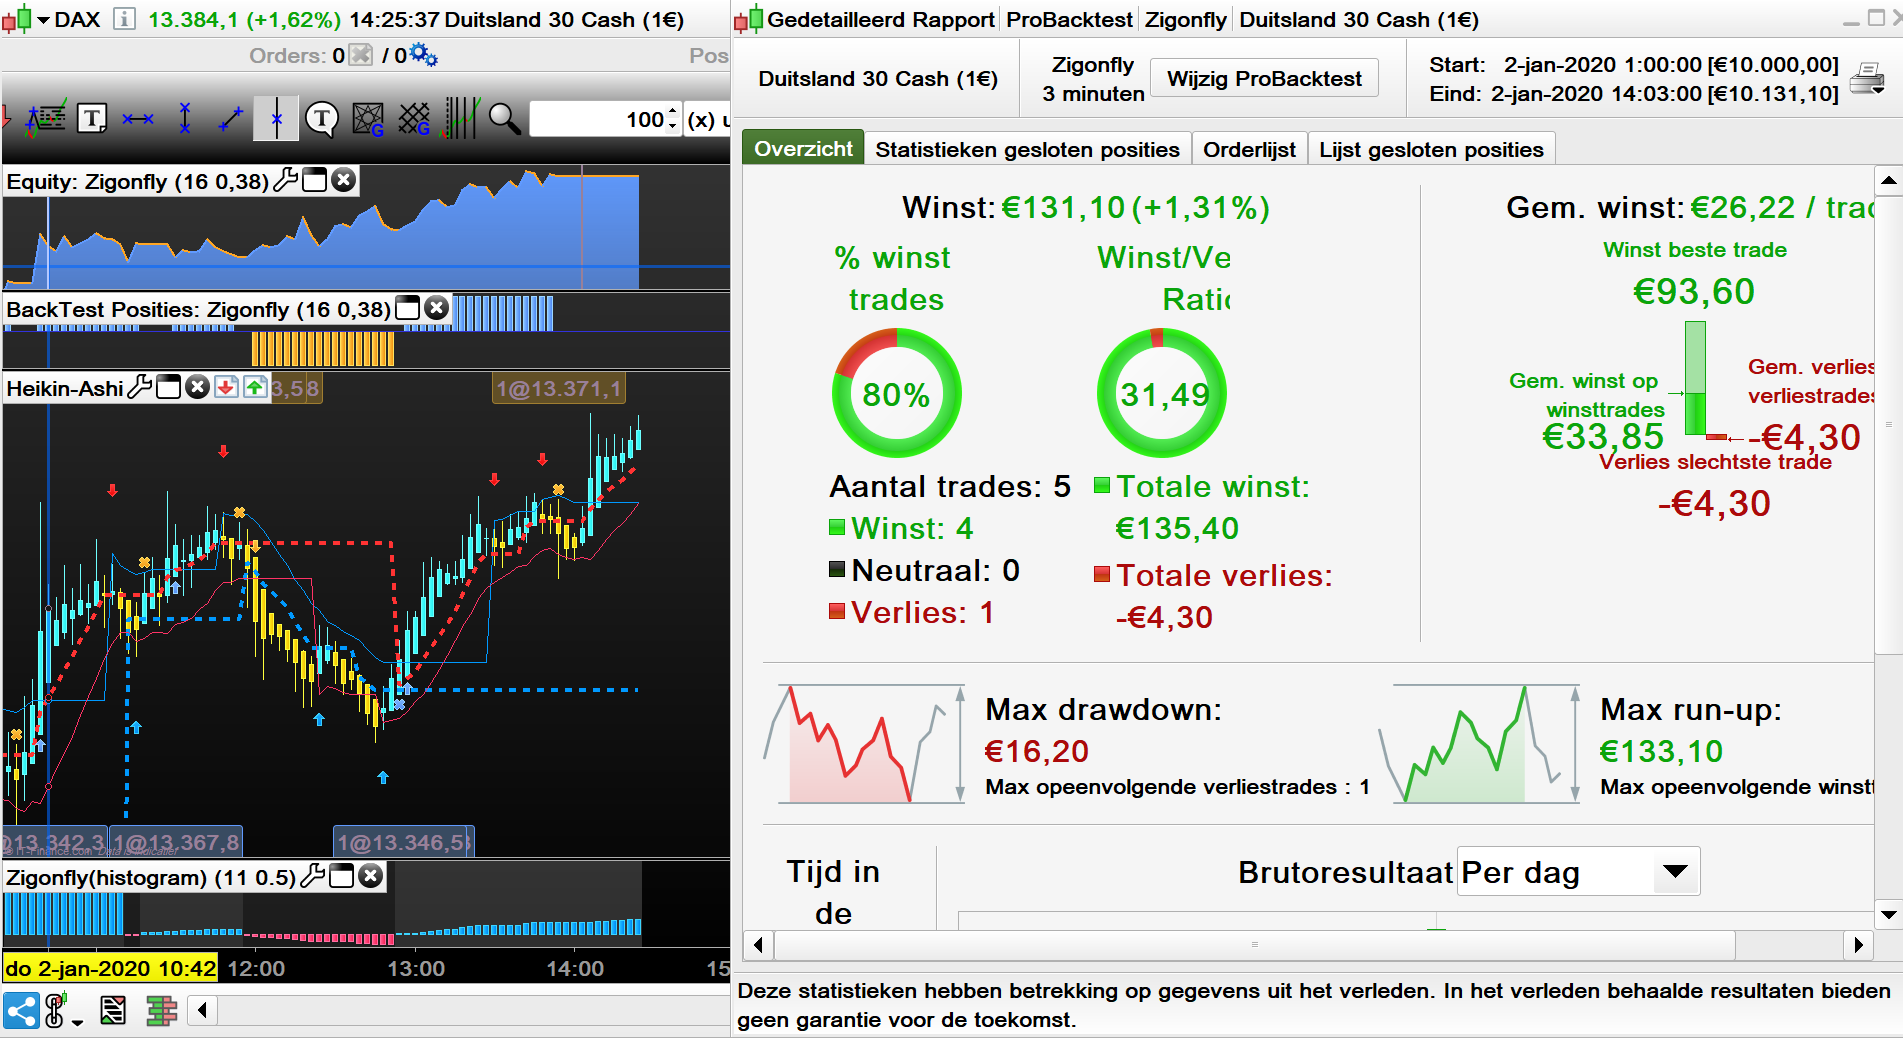
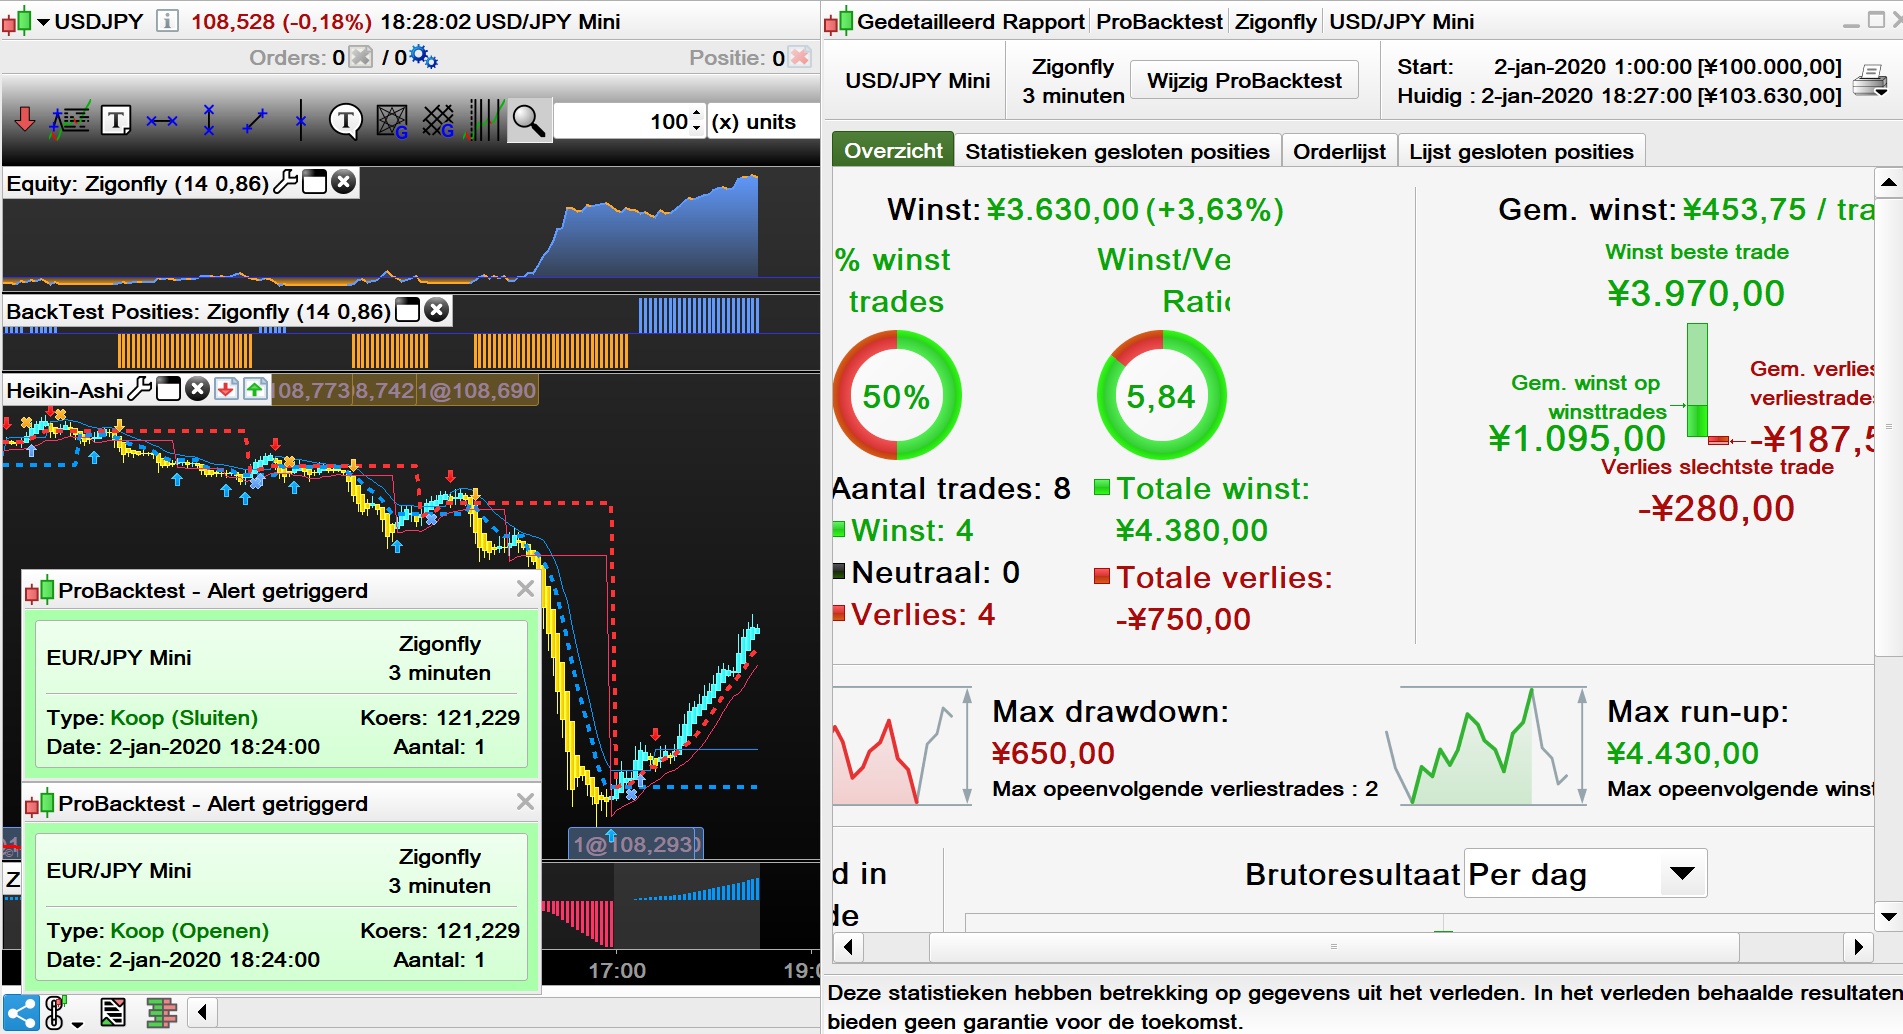
The last 10 years I have written or rewritten over 100 indicators, one of them is Zigonfjy.
Zigonfly indicator is not completed jet, therefore I did’n publish the code.
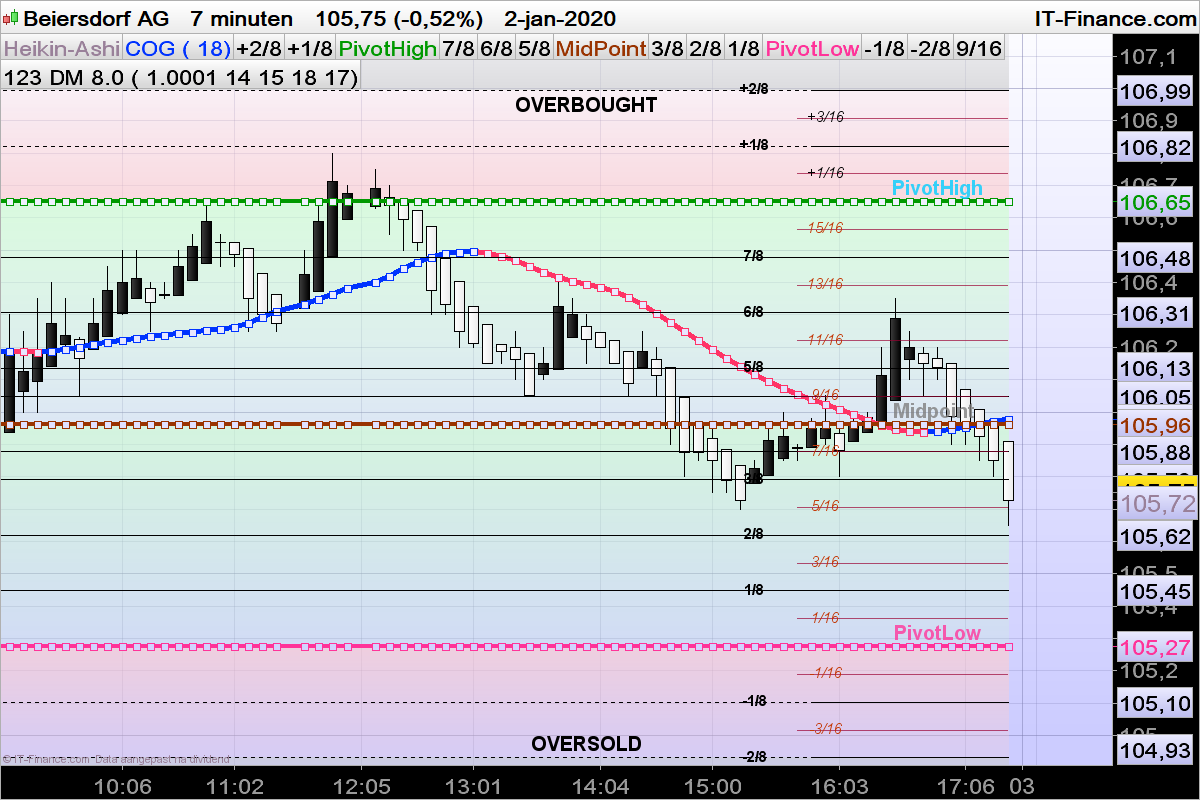
I also write an Indicator on Demark Pivot Points (Daily). This indicator is completed as well as my COG Indicator.
Code for COG (Center of Gravity):
HL=(high+low)/2
Sum=(summation[18](HL))/n
a0=TriangularAverage[7](sum)
return a0
Code for DeMark Pivot Points (Daily):
Defparam DRAWONLASTBARONLY = true
Defparam CALCULATEONLASTBARS =2000

if Dayofweek = 1 then
n=2
else
n=1
endif
KO=dopen(n)
KH=dhigh(n)
KL=dlow(n)
KS=dclose(n)
If KS > KO then
Phigh = KH + (KH-KL)/2
Plow= (ks+kl)/2
elsif KS<KO then
Phigh = (KH+KS)/2
Plow = KL-(KH-KL)/2
else
PHigh= KS+ (KH-KL)/2
Plow= KS-(KH-KL)/2
endif
a=phigh[1]
DRAWTEXT("PivotHigh", barindex[5], a+(0.25*d),dialog,bold,20)coloured(0,205,255,200)
DRAWTEXT("OVERBOUGHT",barindex[30], a+(1.75*d),dialog,bold,20)
b=plow[1]
DRAWTEXT("PivotLow", barindex[5], b+(0.25*d),dialog,bold,20)coloured(255,51,153,200)
DRAWTEXT("OVERSOLD", barindex[30],b-(1.75*d), dialog,bold,20)
c=a-b
a21=b+c*0.5
DRAWTEXT("Midpoint ", barindex[5], a21+(0.25*d),dialog,bold,20)coloured(125,125,125,200)
d=c/8
fr0=a+2*d
DRAWTEXT("+2/8", barindex[st], f*Fr0,dialog,bold,15)
DRAWSEGMENT(barindex, fr0, barindex[m], fr0[m])
Fr1=a+d
DRAWTEXT("+1/8", barindex[st], f*Fr1, dialog,bold,15)
DRAWSEGMENT(barindex,fr1,barindex[m],fr1[m])
fr2=a-d
DRAWTEXT("7/8", barindex[st], f*Fr2,dialog,bold,15)
DRAWSEGMENT(barindex, fr2, barindex[m], fr2[m])
fr3=a-2*d
DRAWTEXT("6/8", barindex[st], f*Fr3,dialog,bold,15)
DRAWSEGMENT(barindex, fr3, barindex[m], fr3[m])
fr4=a-3*d
DRAWTEXT("5/8", barindex[st], f*Fr4,dialog,bold,15)
DRAWSEGMENT(barindex, fr4, barindex[m], fr4[m])
fr5=a-5*d
DRAWTEXT("3/8", barindex[st], f*Fr5,dialog,bold,15)
DRAWSEGMENT(barindex, fr5, barindex[m], fr5[m])
fr6=a-6*d
DRAWTEXT("2/8", barindex[st], f*Fr6,dialog,bold,15)
DRAWSEGMENT(barindex, fr6, barindex[m], fr6[m])
fr7=a-7*d
DRAWTEXT("1/8", barindex[st], f*Fr7,dialog,bold,15)
DRAWSEGMENT(barindex, fr7, barindex[m], fr7[m])
fr8=a-9*d
DRAWTEXT("-1/8", barindex[st], f*Fr8,dialog,bold,15)
DRAWSEGMENT(barindex, fr8, barindex[m], fr8[m])
fr9=a-10*d
DRAWTEXT("-2/8", barindex[st], f*Fr9,dialog,bold,15)
DRAWSEGMENT(barindex, fr9, barindex[m], fr9[m])
// Tussenlijnen 1/16 dus rood gekleurd//
FRr3=a+ob*d
DRAWSEGMENT(barindex, frr3, barindex[s], frr3[s])coloured(155,0,50,175)
DRAWTEXT("+16/16", barindex[st-5], f*Frr3, dialog,Italic,15)
FRr1=a+1.5*d
DRAWSEGMENT(barindex, frr1, barindex[s], frr1[s])coloured(155,0,50,175)
DRAWTEXT("+3/16", barindex[st-5], f*Frr1, dialog,Italic,15)
frr2=a+0.5*d
DRAWSEGMENT(barindex, frr2, barindex[s], frr2[s])coloured(155,0,50,175)
DRAWTEXT("+1/16", barindex[st-5], f*Frr2, dialog,Italic,15)
fr11=a-0.5*d
DRAWSEGMENT(barindex, fr11, barindex[s], fr11[s])coloured(155,0,50,175)
DRAWTEXT("15/16", barindex[st-5], f*Fr11, dialog,Italic,15)coloured(195,55,5,255)
fr22=a-1.5*d
DRAWSEGMENT(barindex, fr22, barindex[s], fr22[s])coloured(155,0,50,175)
DRAWTEXT("13/16", barindex[st-5], f*Fr22, dialog,Italic,15)coloured(195,55,5,255)
fr33=a-2.5*d
DRAWSEGMENT(barindex, fr33, barindex[s], fr33[s])coloured(155,0,50,175)
DRAWTEXT("11/16", barindex[st-5], f*Fr33, dialog,Italic,15)coloured(195,55,5,255)
fr44=a-3.5*d
DRAWSEGMENT(barindex, fr44, barindex[s], fr44[s])coloured(155,0,50,175)
DRAWTEXT("9/16", barindex[st-5], f*Fr44, dialog,Italic,15)coloured(195,55,5,255)
fr55=a-4.5*d
DRAWSEGMENT(barindex, fr55, barindex[s], fr55[s])coloured(155,0,50,175)
DRAWTEXT("7/16", barindex[st-5], f*Fr55, dialog,Italic,15)coloured(195,55,5,255)
fr66=a-5.5*d
DRAWSEGMENT(barindex, fr66, barindex[s], fr66[s])coloured(155,0,50,175)
DRAWTEXT("5/16", barindex[st-5], f*Fr66, dialog,Italic,15)coloured(195,55,5,255)
Fr77=a-6.5*d
DRAWSEGMENT(barindex, fr77, barindex[s], fr77[s])coloured(155,0,50,175)
DRAWTEXT("3/16", barindex[st-5], f*Fr77, dialog,Italic,15)coloured(195,55,5,255)
fr88=a-7.5*d
DRAWSEGMENT(barindex, fr88, barindex[s], fr88[s])coloured(155,0,50,175)
DRAWTEXT("1/16", barindex[st-5], f*Fr88, dialog,Italic,15)coloured(195,55,5,255)
frr8=a-8.5*d
DRAWSEGMENT(barindex, frr8, barindex[s], frr8[s])coloured(155,0,50,175)
DRAWTEXT("-1/16", barindex[st-5], f*Frr8, dialog,Italic,15)coloured(195,55,5,255)
frr9=a-9.5*d
DRAWSEGMENT(barindex, frr9, barindex[s], frr9[s])coloured(155,0,50,175)
DRAWTEXT("-3/16", barindex[st-5], f*frr9, dialog,Italic,15)coloured(195,55,5,255)
frr10=a-10.5*d
DRAWSEGMENT(barindex, frr10, barindex[s], frr10[s])coloured(155,0,50,175)
DRAWTEXT("-5/16", barindex[st-5], f*frr10, dialog,Italic,15)coloured(195,55,5,255)
return fr0 as"+2/8", Fr1 as"+1/8", a as"PivotHigh", fr2 as"7/8", fr3 as"6/8", fr4 as"5/8", a21 as"MidPoint", fr5 as"3/8", fr6 as"2/8", fr7 as"1/8", b as"PivotLow", fr8 as"-1/8", fr9 as"-2/8", fr44 as"9/16", fr55
Both Indicators are showed in the attachement
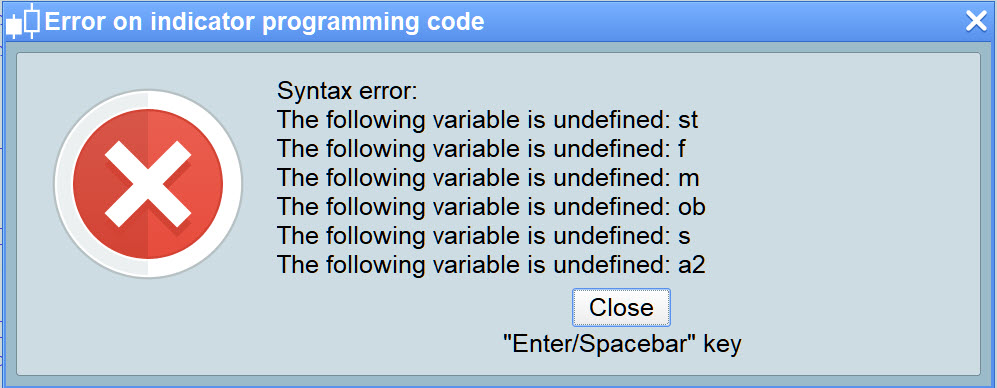
Zigo