Zigo
ZigoParticipant
Master
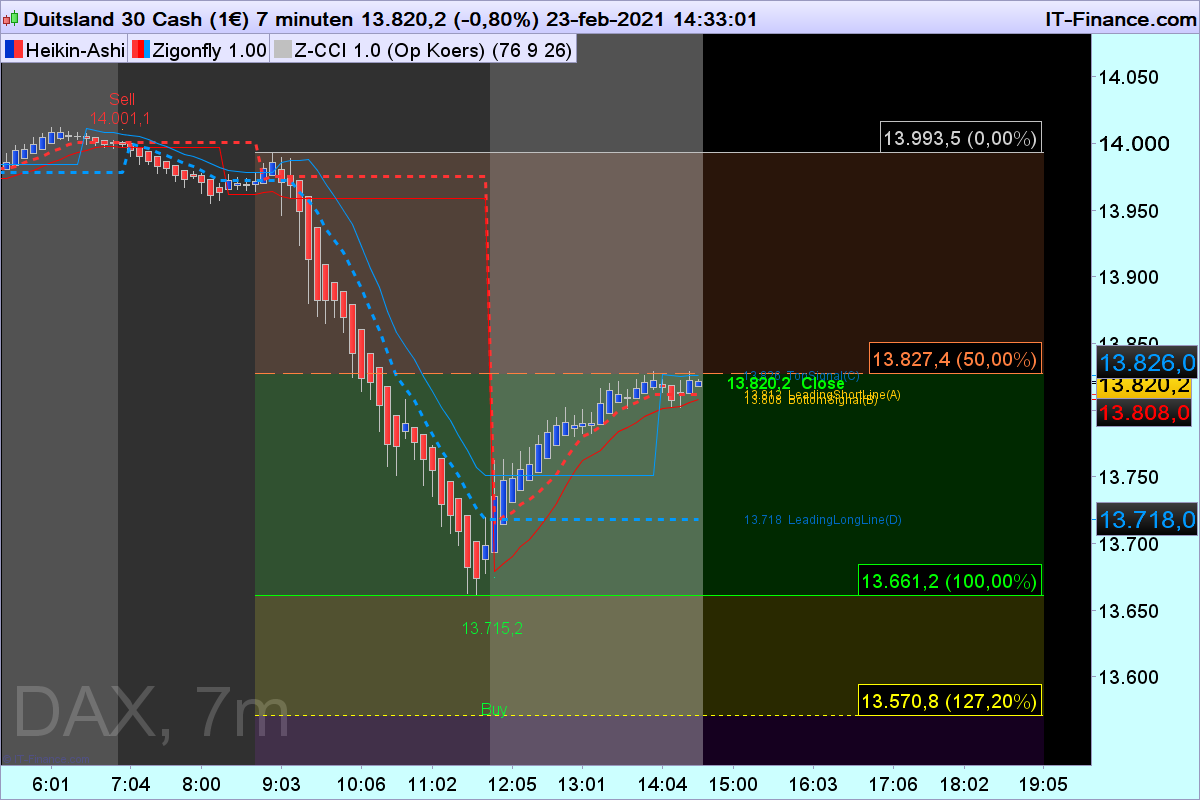
Wat next, maybe a 50% retrace?
Zigo – I have no idea what I am supposed to be looking at. Your last 8 posts have had a total of just 43 words in them and 5 screenshots. Perhaps some detailed description of what we are supposed to see in those screenshots and why the things drawn in them are drawn in them would be beneficial for everyone. Maybe the odd arrow and some text on the screenshots would help as well as a description of how your indicator works would help readers to get more involved. The code would be useful too – maybe you posted it and I missed it?
How are we supposed to get as excited as you and talk about what you are posting if we have no idea what your point is or how your indicator works?
ZigoParticipant
Master
I would like to give a sensible answer, but I do not want to disturb you in your point of view. I myself am a man of few words, but I have made a living by talking. My first post was February 1, 2020 and what stands out most is the curiosity among the various forum members, I can release the code of the indicator without any problem, but want to protect the forum members from recklessness. By showing different images in the right order, I would like to show prospective users that Zigonfly Indicator acts as a total indicator, the pretension to compare with Ichimoku (Chapter 8) is not present, but do know that Zigonfly can be a splendour of a supplement.
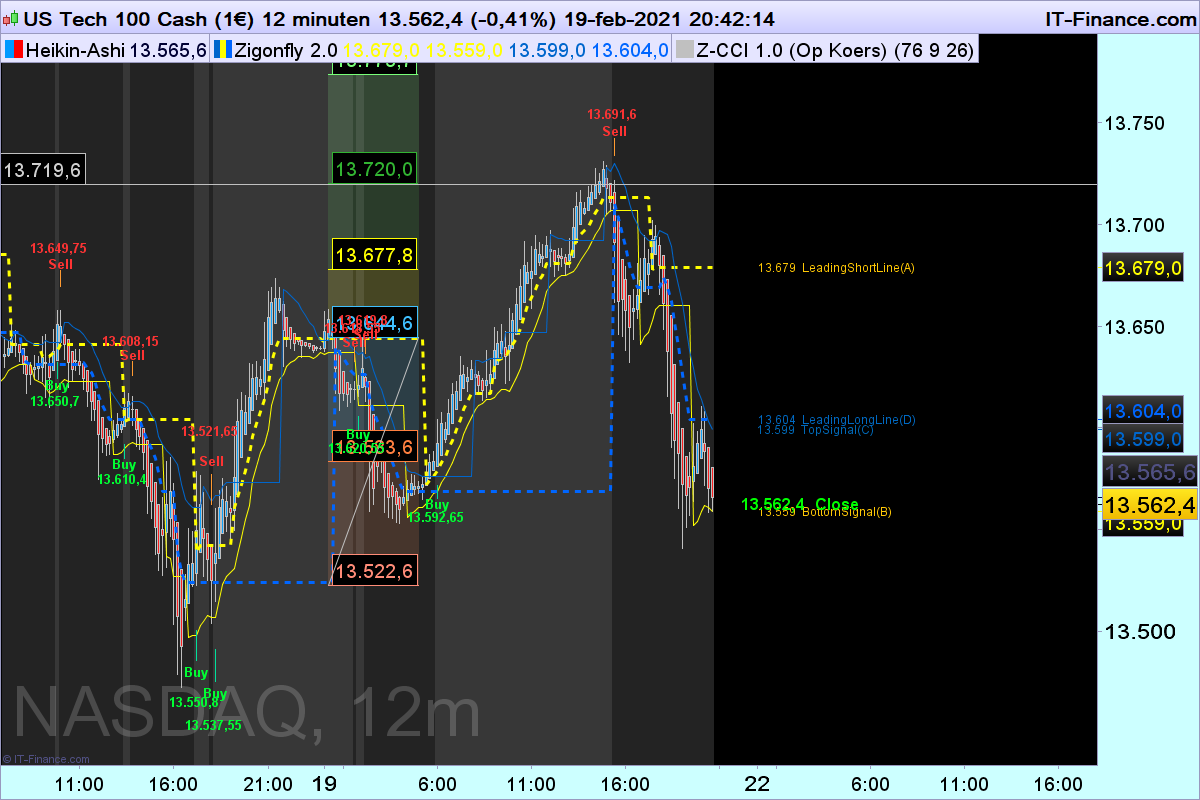
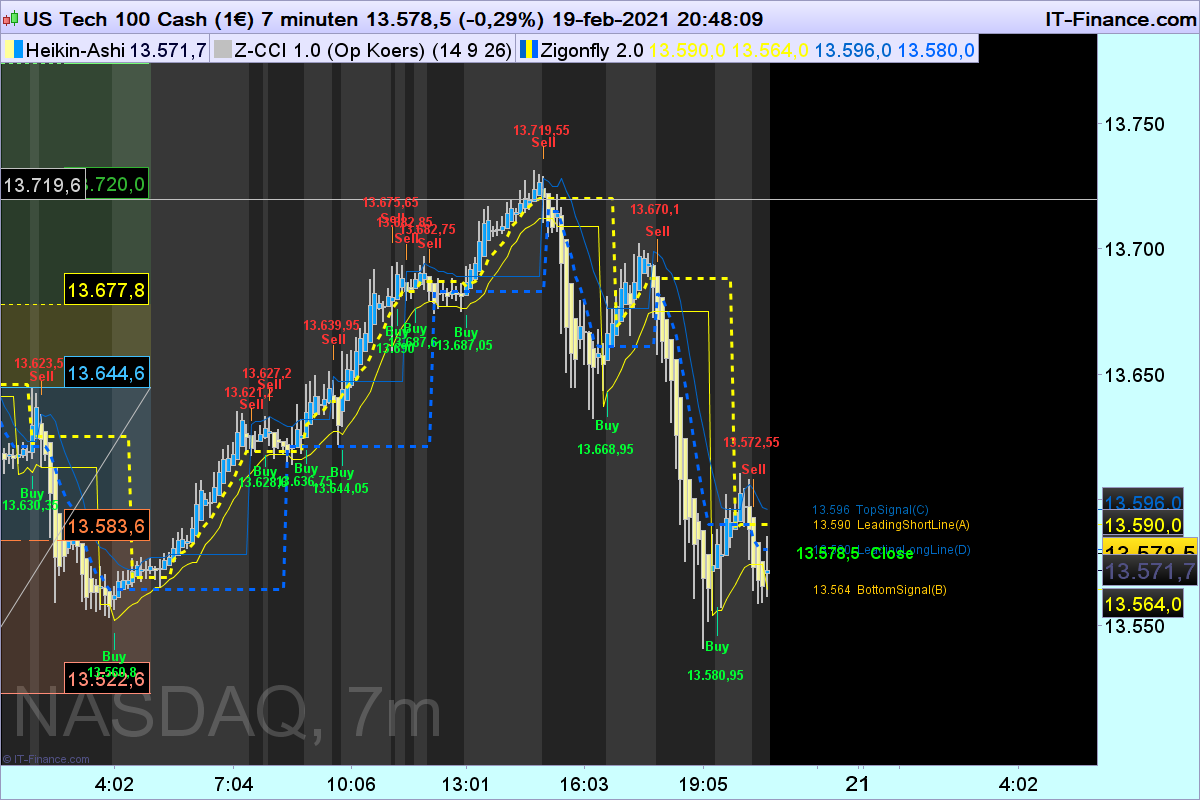
The thoroughness with which I vetted and adjusted this indicator eventually resulted in the 4 lines A, B, C, and D. Opposite these 4 lines is the close (CL) of each candle to compare and determine where the lines are relative to the closing price.
Cl (close) shall be higher than lines A, B, C and D for a relatively reliable increase and CL shall be lower than lines A, B, C and D for a relatively reliable decrease. Finally, I’m not going to post before Marketplace is open. If the amount of words becomes more important than the content. ( 226 words).
My 2 cents :
For demonstration purpose I would rather see screenshots on the same asset, only on some standart Time Frame and on different market env
Yesterday Trend is easy even for a simple moving average cross indicator ; difficulty appear when market is more choppy.
Jumping from 521 ticks to 7 minutes to 4 minutes to 15 minutes as you are showing us is a weakness to me. It’s easy to adapt the Time Frame to have ‘perfect’ signal on this specific TF. You understand what I mean ?
Positive criticisme.
ZigoParticipant
Master
@ Luciole
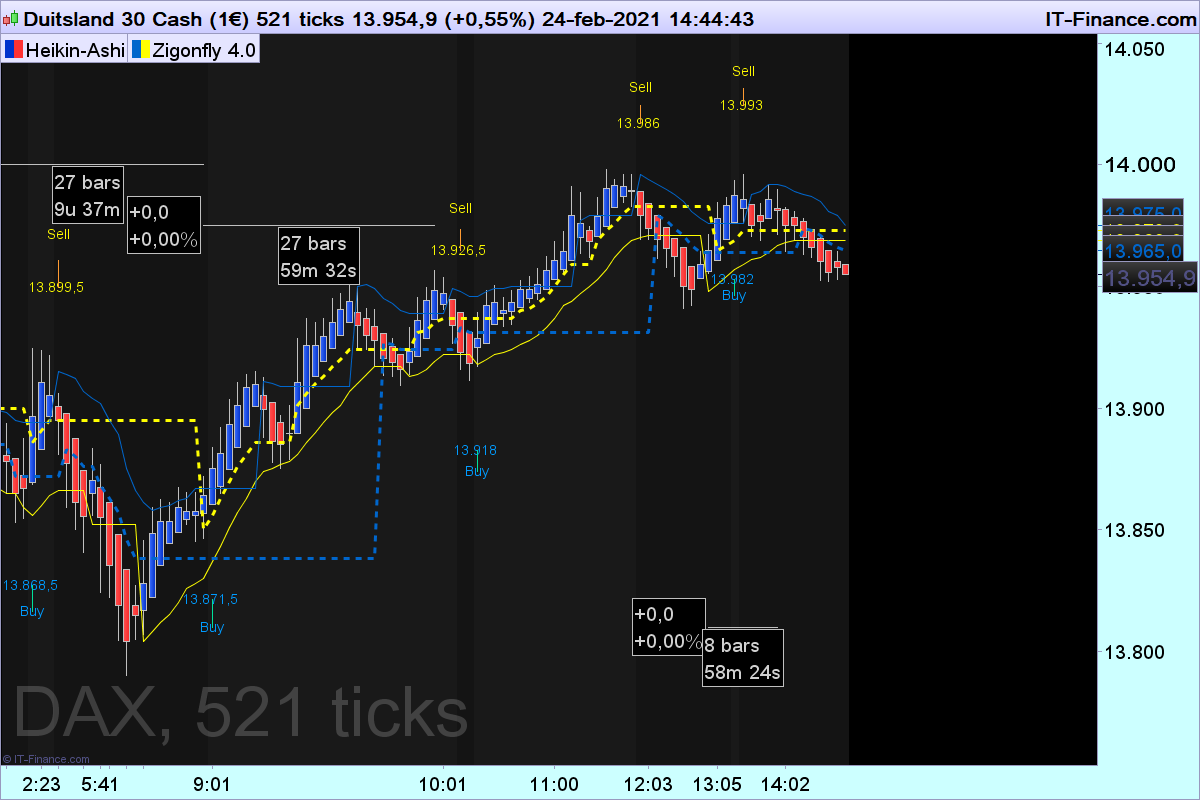
Its a non-repainting indicator, therefore the smallest timeframes gives earlier signals, the tick frames gives an idea over the volume.
Mostly smaller TF gives much more false signals, but can be used if you want clean desk at evening.
Today 521 tick frame gives 27 bars between 00u00 and 9u00 and even so 27 bars between 9u00 and 10u00 and 8 bars between 13u00 and 14u00.
I have multiple screen on my computer and mostly 4 diff TF’s (521 ticks, 4 min, 7 min and 12 min).
By the way I don’t trade every signal. Now I prepare for nine holes.
and what stands out most is the curiosity among the various forum members
Did something change and I missed it because in this post you were questioning the lack of interest in your topic:
ZigonFly (Day Trading)
I learn’t more in your last 226 word post about your indicator than in every previous screen shot – and that was still just that it draws lines on a chart at different levels – so we still might need a few more words to know what those lines are calculated or based on. Hence my suggestion that you describe what we are supposed to be looking at to help you get other people interested. A screenshot and a comment such as ‘What next a 50% retrace?’ is unlikely to sell your indicator to anybody – lots more detail and working examples of how it predicted that something might happen and then the result of what actually happened is needed to sell the concept.
Just trying to be helpful with my point of view which you failed to disturb. 🙂
Not even your usual one or two? 🙂
ZigoParticipant
Master
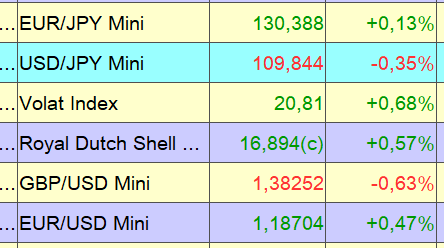
Today I noticed something special. It may not be special at all, but the special thing is that the Zigonfly indicator is very suitable for studying the joint pattern of behaviour of the USD/JPY eur/usd and eur/jpy.
Just in memory we have 4 lines in the Indicator Zigonfly namely:
1. A (LeadingShortLine) Yellow dotted line
2. B (Bottom Signal Line) Yellow line with points
3. C (Top Signal Line) Blue line with points
4. D (LeadingLongLine) Blue Dotted Line
If line B suddenly crosses price downwards then that is a halt to the increase if then line A does the same then this is an almost certain trend reversal and we can take a Long position or we stop a Short position.
Conversely, if line C crosses the price upwards, that is a halt to the decrease if line D does the same after that, then this is an almost certain trend change. We’ll stop a Long position or we’ll take a Short position. Or both.
This finding basically means that:
1. If the EUR/USD increases that either EUR/JPY or USD/JPY decreases or both fall or the decrease of the latter two is equal to the EUR/USD increase.
2. If the EUR/USD decreases that either EUR/JPY or the USD/JPY increase or the increase of the latter two is equal to the decrease of EUR/USD.
ZigoParticipant
Master
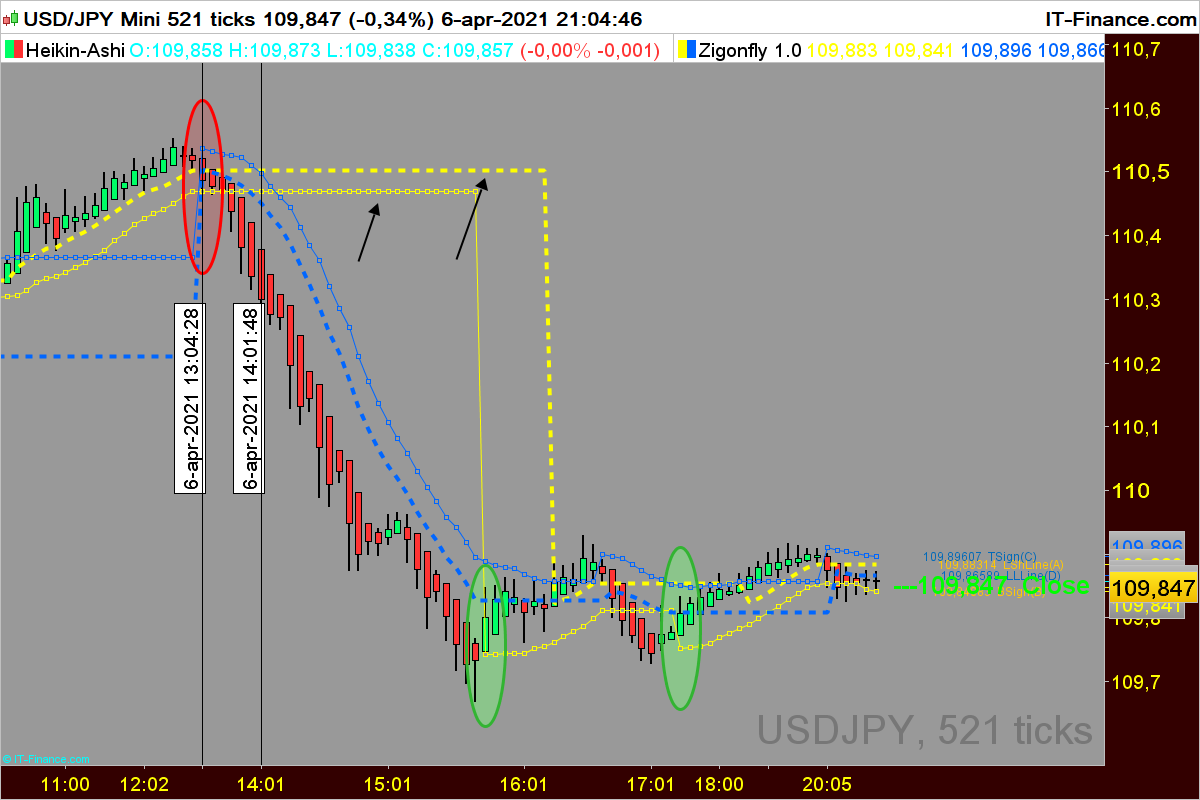
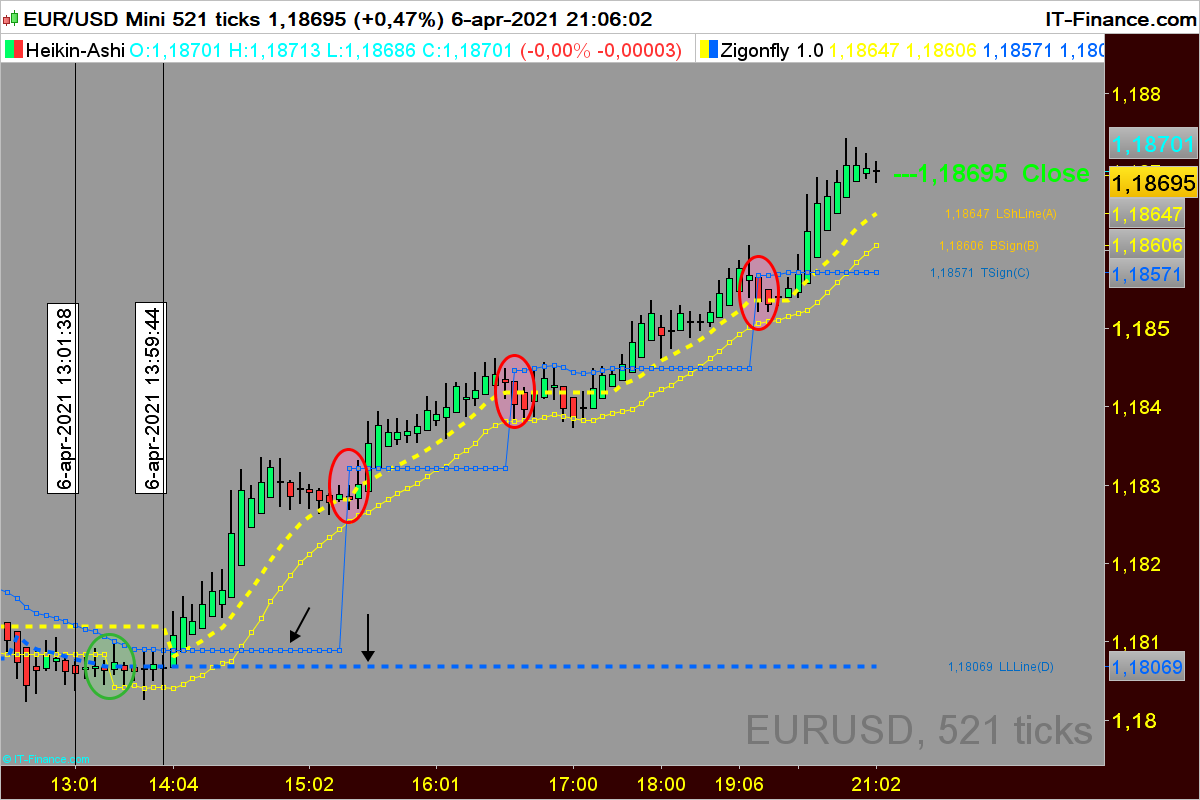
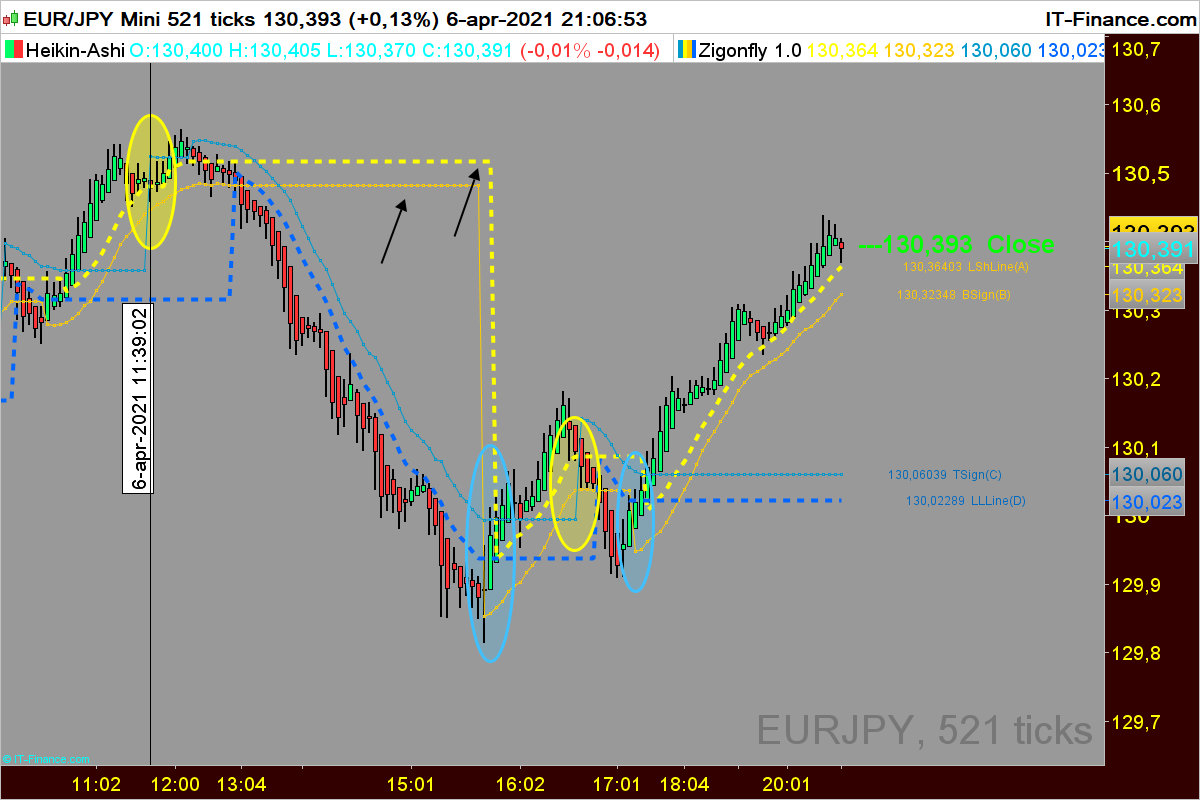
The analysis of the three graphs gives different insights:
- USD/JPY. The thin blue line C and the blue dotted line D cross the course at 13:04:28 upwards. This indicates downwards. (See also the first red circle)
- EUR/USD. The first green circle is between 13:01:38 and 13:59:44. The real increase started immediately after 14:00:00. The increase continues until now, albeit with three interruptions (red circles).
- EUR/JPY. The indication of the end of the previous increase is announced at 11:39:02, more than an hour earlier than in the other two charts.
All this data together indicate a fairly marked increase in the EUR/USD and a strengthening of the Yen.
Origineel
Al deze gegevens samen geven een vrij duidelijke stijging van de EUR/USD aan en een versterking van de Yen.
Zigo – Please check your posts before hitting submit.
- Only post in the language of the forum that you are posting in. For example English only in the English speaking forums and French only in the French speaking forums.
ZigoParticipant
Master
Sorry, bur post 166346 has to be :
If line B suddenly crosses price downwards then that is a halt to the decrease if then line A does the same then this is an almost certain trend reversal and we can take a Long position or we stop a Short position.
Conversely, if line C crosses the price upwards, that is a halt to the increase if line D does the same after that, then this is an almost certain trend change. We’ll stop a Long position or we’ll take a Short position. Or both.