Maybe this is a starting point?
[attachment file=”Bar Counter.itf”]
//Bar Counter
//By Vonasi
//20181214
//StartDate = 20181214
//StartTime = 080000
y = (high - low) * 0.20
if date = startdate and time = starttime then
timeok = 1
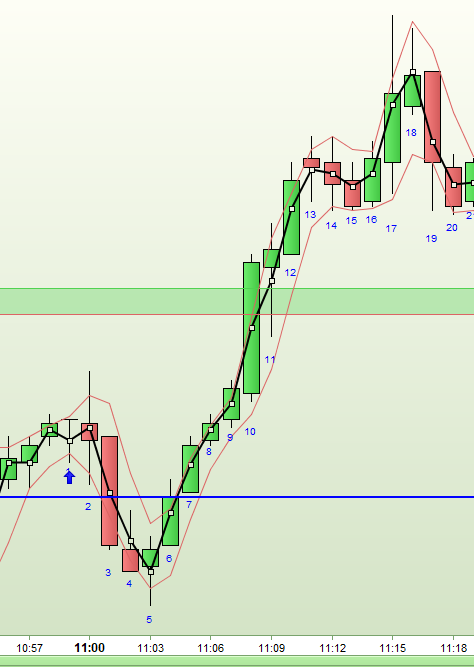
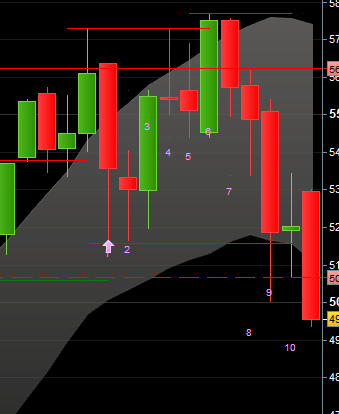
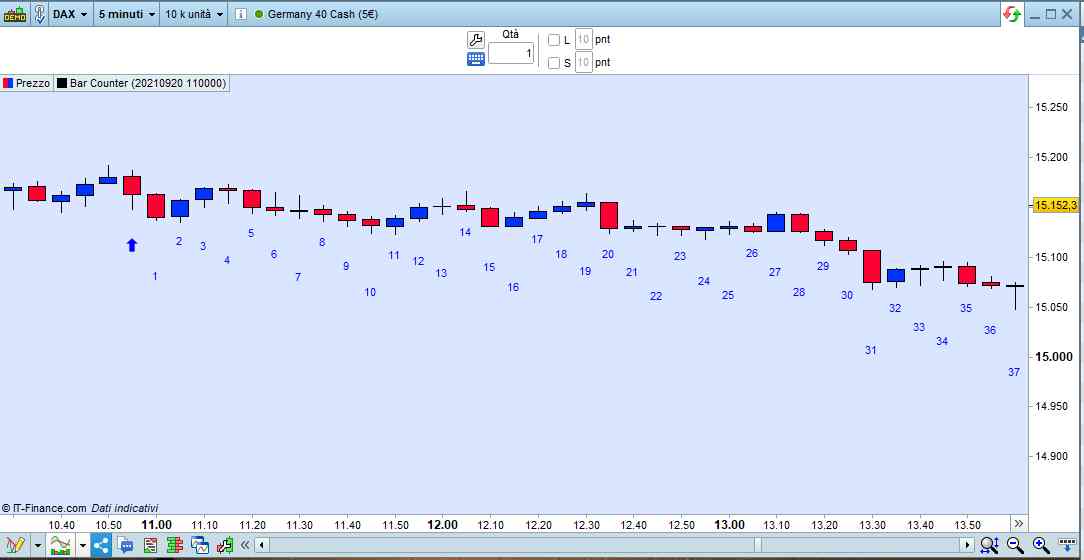
drawarrowup(barindex, low - (y * 2)) coloured(0,0,255)
endif
if timeok then
number = number + 1
drawtext("#number#",barindex, low - y) coloured(0,0,255)
endif
return
[attachment file=87091]
Thank you, Vonasi!
That already looks good.
It is a pity that the start time is 1 bar too early, can you still adjust that?
If you enter 11.00, the arrow and the ‘1’ will come under the 10.00 bar for example (in the 1 hour timeframe).
And can the time display also be in 4 positions? I do not use seconds.
Sorry – I forgot I was coding an indicator and not a strategy. Just change TIME to OPENTIME and DATE to OPENDATE and that should do it.
Yes the time can be in four digits – I’ll be back in a minute with that.
//Bar Counter
//By Vonasi
//20181214

//StartDate = 20181214
//StartTime = 0800

y = (high - low) * 0.20

if opendate = startdate and opentime = (starttime * 100) then
timeok = 1
drawarrowup(barindex, low - (y * 2)) coloured(0,0,255)
endif

if timeok then
number = number + 1
drawtext("#number#",barindex, low - y) coloured(0,0,255)
endif

return
..and ITF file to import:
[attachment file=”Bar Counter.itf”]
It works great now, Vonasi.
Thanks for your support during the day
Have a nice weekend!
Good morning Vonasi,
There is still something not going well.
Intraday everything works fine, but in the day, week and month charts are some difficulties.
Entering date and time does not work correctly and the numbers under the bars are not correct shown.
As an example in the attachment a monthly chart that starts in February.
Only if I enter the date 20180228 and the time 0 this result appears (I adjusted the color).
The position, of the numbers (the distance to the bar) seems to be moved 1 bar.
Can you take a look at it?
It doesn’t do it on my platform and I tested on several different markets. It might be something to do with how you have time set up on your chart. I would just create a different indicator for monthly and weekly as you don’t need time on a monthly or weekly chart.
//Bar Counter - Monthly/Weekly
//By Vonasi
//20181214

//StartDate = 20181214

y = (high - low) * 0.20

if opendate = startdate then
timeok = 1
drawarrowup(barindex, low - (y * 2)) coloured(0,0,255)
endif

if timeok then
number = number + 1
drawtext("#number#",barindex, low - y) coloured(0,0,255)
endif

return
You are right. After I turned off the DailyData at Platform options, Time zones it works well. Thank you, also for the adjustment of the indicator.
Dear Vonasi or colleagues,
This indicator still works well.
One question:
Can it be changed that there is no number below the arrow and that the 1 and following numbers appear below the following bars?
In other words, counting starts at the next bar.
Thanks!
There yoo go:
//Bar Counter, By Vonasi, 20181214
once timeok = 0
once number = 0
//StartDate = 20181214
//StartTime = 080000
y = average[100,0](range)   //(high - low) * 0.20
if (((date >= startdate) and (time >= starttime))  or (date > startdate)) and timeok = 0 then
   timeok = 1
   drawarrowup(barindex, low - (y * 2)) coloured(0,0,255)
endif
if timeok then
   //number = number + 1
   IF number > 0 then
      drawtext("#number#",barindex, low - ((y * 1) * ((BarIndex MOD 3) + 1))) coloured(0,0,255)
   endif
   number = number + 1
endif
return
not working for me. It just opens a blank indicator windows
You have to add it ON your chart, not BELOW it.
Use the PRICE properties, then add indicator.