Hi Nicolas and others,
Maybe you can help me. I am new with ProTrader.
In the cycle analysis that I use a lot, you are constantly counting the number of expired price bars. In all timeframes.
Now I wondered if anything could be done for that.
(I have tested the Ruler, but it is not really user-friendly for this)
What would I like?
In a chart, you enter a signal at the start of a new cycle, preferably by one mouse click.
beneath this start bar an upward arrow appears.
Under each bar that (realtime) appears afterwards, the number of that new bar appears.
When entering a new signal/arrow the counter starts again, while the expired bars remain shown.
Or in other words: the bartelling continues until you click on one, then it becomes an arrow. And adjusts the counter.
Restoring from an arrow back to the counter should also be possible if the end of the last cycle turns out to be a little later.
So you can see at a glance on all time frames/charts how far you have progressed in the cycles.
Hopefully you can do something with it. Thanks in advance!
I understand what you mean, but mouse action can’t be retrieve with the code. If you have other idea to know / identify when a new cycle start, let us know.
For instance, why not declare in a new variable the time and date?
Nicolas, I am not familiar with the programming possibilities of ProRealtime.
If you think this is the fastest way to indicate the cycle start, please.
It is a feature that I use a lot all day long, it would be nice to click and set as little as possible.
In your proposal, is there a window that shows my last entered date and time and where I can change this for the new cycle start?
Does that upward arrow also come under the cycle starts? And can it work for the rest as I had indicated?
Hello
What kind of cycle are you scanning?
-Sinewave
-Demark counts
Hi Yannick,
the Walter Bressert Double Stochastics method on several timeframes
Hello Nicolas, Roberto and others,
Hopefully you can find some time to look at my above question for the price bar counter. What I already wrote, I use it all day long for cycle trading in all timeframes.
It would be nice if the start of a new period can be configured as convenient and fast as possible. That, for instance, the settings window shows the current date and time.
To make it more clear, in the attachment I have drawn what I mean.
A cycle will have a maximum of 50 bars.
it doesn’t seem possible to send an 18kb .png attachment
When entering a new signal/arrow the counter starts again, while the expired bars remain shown.
If we enter a new date then the indicator will be calculated again over the complete history and therefore will delete all previous symbols..
The best way would be to add multiple times the same indicator but with different start time. But all other previous numbers and arrows will still be visible.
Nicolas,
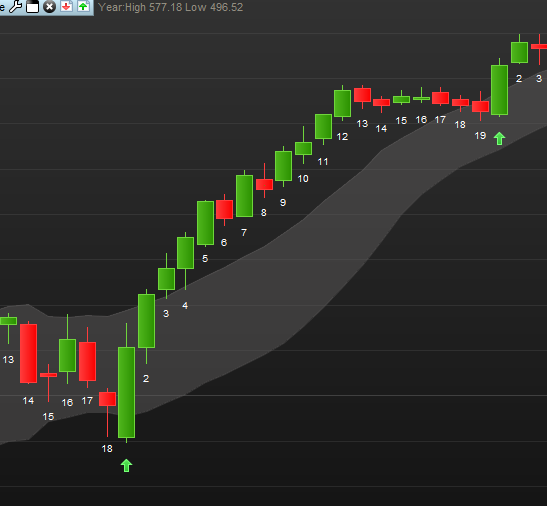
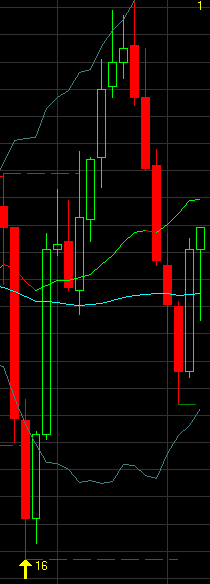
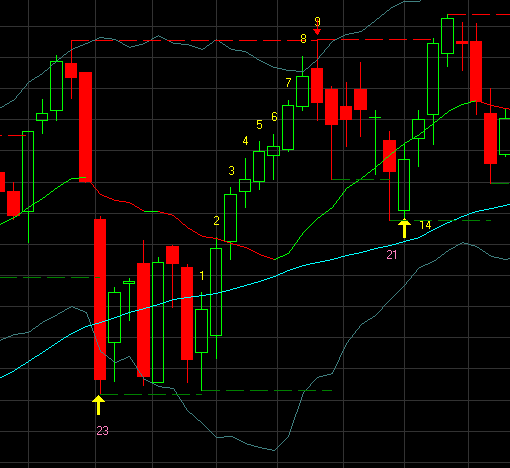
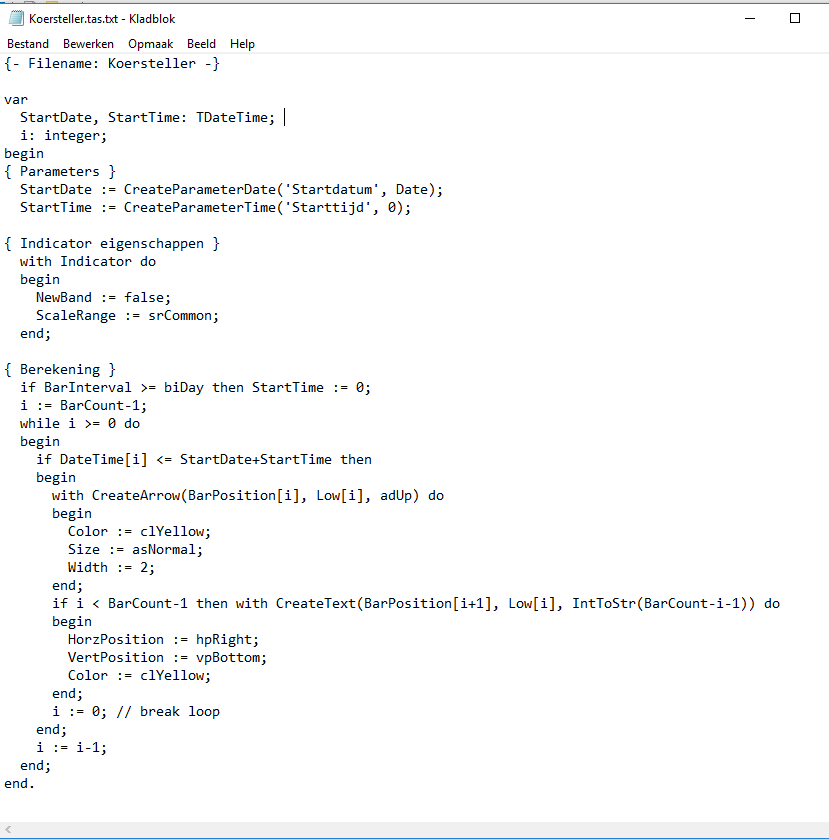
In the attachments you can see how it was shown in my previous (WallStreetPro) software, with the script.
When I entered a new date and time, there appeared a yellow arrow in the chart and with each new bar the number mentioned here was increased.
In a new cycle, I set the date and time again and drew an yellow arrow at the previous point and in purple the number of that cycle.
I hoped that in ProRealtime it could be some simplified. And that the figure appeared under each new bar.
Is what you mean what I had in my previous software?
Perhaps this helps to come to the most friendly indicator.
Hi Nicolas and others,
Excuse me if I’m too impatient, but can someone write the code for what I’ve asked for in the last weeks. Who can help me?
If I can give more information, I would like to hear it.
I switched to ProRealtime and this indicator is very valuable for my daily trading.
If it is not possible, please give me a sign too.
Many thanks in advance.
As Nicolas said before it is not possible in PRT to have any human interaction with an indicator once it has been set running so every time you change a value (such as the start date) then everything that has been drawn already is deleted. The only two ways to work around this are as he said are to launch multiple versions of the same indicator – but you could end up with an awful lot of indicators launched that will then later need deleting. Another option is if you can supply the methodology of how and why you choose to start a new cycle then maybe this could be automated into an indicator. If it is just by feel or emotion then I’m afraid that it can’t be coded!
I believe that Nicolas might be feeling a little under the weather at the moment (he is just human and not the coding robot he appears to be!) – so there might be a short period of delay if anyone would like him to try code any indicators for them.
Thank you for your response, Vonasi! I appreciate that very much.
Starting a new cycle does not start on emotion but on the price level and especially on the supporting indicators from the Bressert cycle theory that I use.
From the reaction of Nicolas I also understood that my first wish is not possible.
But would you like to take a look on what I posted afterwards, with attachments, where I use only one starttime/date indicator, which I manually stop and refresh (and manually plot the arrow en cycletotal of the previous cycle).
Is it not possible to write the code for this indicator?
Preferably with the numbers below the bars and otherwise an ascending number next to the arrow of the start of the period.
As in the attachment from my previous software.
So, an indicator where you can easily set a date and time. That plots a green arrow under the startingbar and sets the next numbers under all following bars. An indicator that I remove and start again if necessary. Is that possible?
If I’m not clear, please give me a sign.
I’m afraid that I know nothing about Bressert cycle theory and so cannot comment on whether it is possible to automate it.
Drawing an arrow and putting numbers under the bars is possible. Automatically drawing an arrow for when ever the last cycle finished is not as once you stop an indicator to enter a new cycle date/time that information disappears.
I’m a little busy right now with other things but will try to do it later for you.
Thank you, Vonasi. I look forward to it.