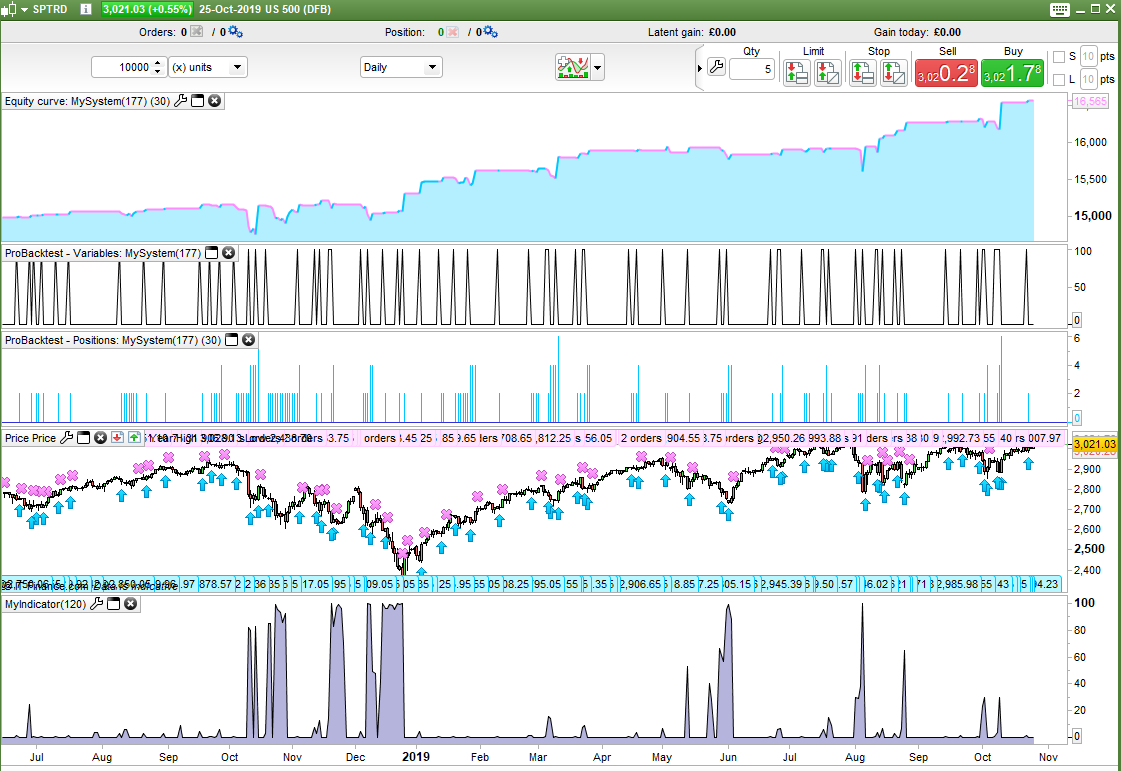
I coded an indicator to simply count how many different stochastics are under a certain level.
level = 20

flag = 0
for j = 1 to 100
if Stochastic[j,1](close) < level then
flag = flag + 1
endif
next

return flag
It works fine and returns varying values between zero and 100.
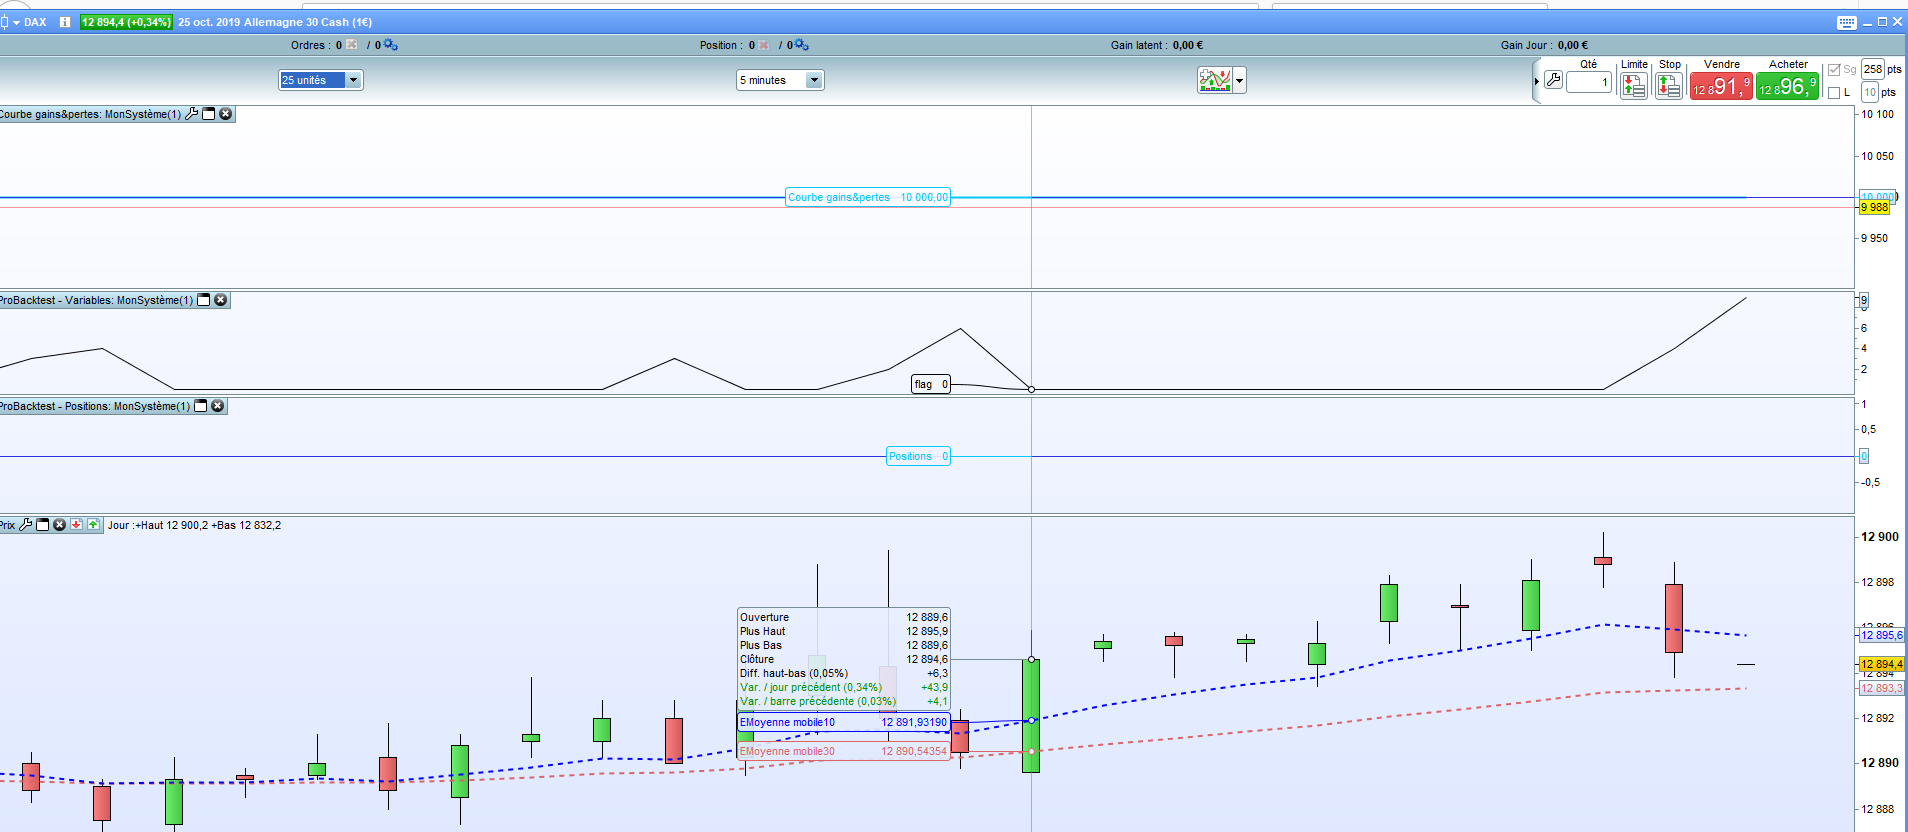
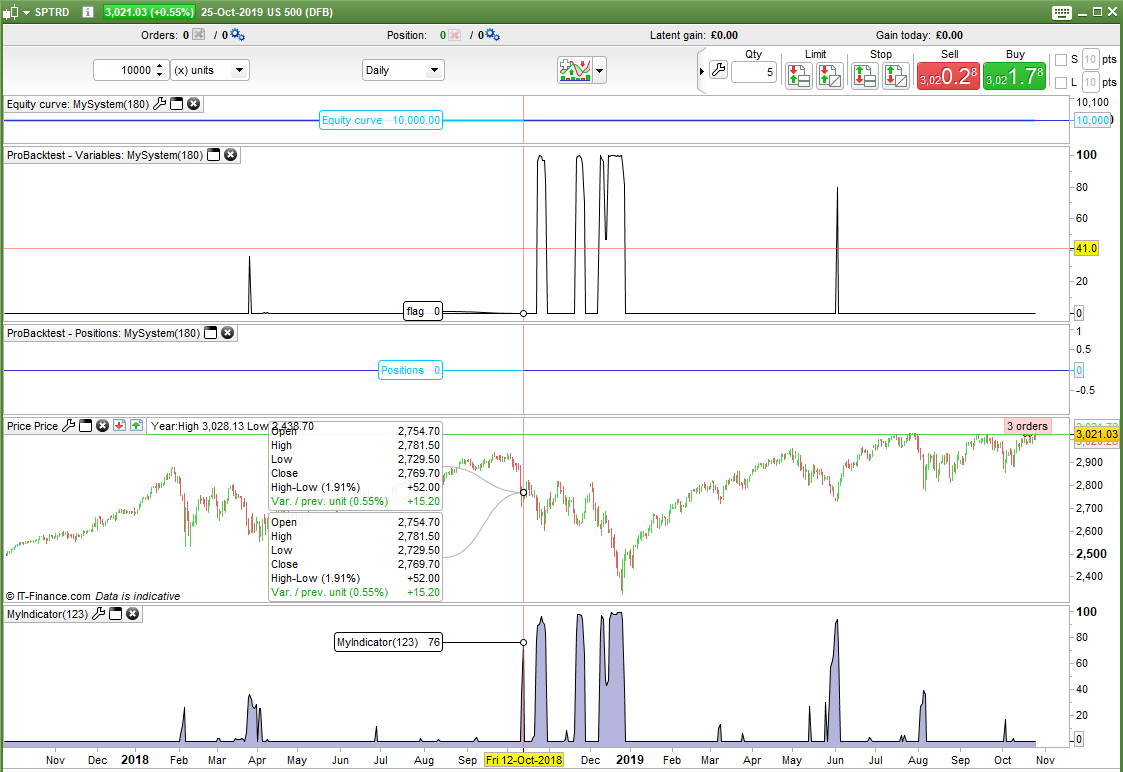
I then put the same code in a strategy and it only returns zero or 100 and nothing else.
level = 20

flag = 0
for j = 1 to 100
if Stochastic[j,1](close) < level then
flag = flag + 1
endif
next

buy at -close limit

graph flag
If I CALL the indicator from the strategy I get 0 or 100 and nothing else too.
It feels like a weird bug but I might just be missing something really obvious as to why it works as an indicator but not in a strategy.
If I do the same test with RSI instead of Stochastic then it works fine.
Why do you have trades opened?
Try GRAPHing j, or replacing FOR…NEXT with WHILE…WEND.
Trades are opened because the image is with the code actually in a working strategy. I was trying to use the flag value for dynamic position sizing. When the position sizes did not change I went looking for the problem and coded the loop as a separate dummy code – it still didn’t work. 🙁
I already did try changing the FOR NEXT loop with WHILE WEND and that did not work either.
If I graph J it will just be 100 because the loop has ended!
Hello
I will write
level = 20

flag = 0
for j = 1 to 100 do
if Stochastic[j,1](close) < level then
flag = flag + 1
buy 1 contract at close limit
break
endif
next


graph flag
fifi743 Thanks for your input but the only difference I can see in your code is the use of DO in line 4 and as far as I am aware DO is an optional instruction so I don’t think that it will make any difference – but I’ll try it anyway!
In fact I have just coded my own stochastic to try to eliminate the platforms stochastic as being the fault but even with my own calculations I get the same results. It works in a loop in an indicator but not in a loop in a strategy.
flag = 0
for j = 1 to 100
d = 1
ll = lowest[j](low)
hh = highest[j](high)
Stoch = average[d](((close - ll)/(hh - ll))*100)
if Stoch < level then
flag = flag + 1
endif
next

return flag
OK – I’m starting to get somewhere. It has something to do with the averaging in the stochastic calculation. With the following code I get the correct results but this does mean that I can only test STOCHASTIC[j,1].
level = 20

flag = 0
for j = 1 to 100
ll = lowest[j](low)
hh = highest[j](high)
stoch = (((close - ll)/(hh - ll))*100)
if stoch < level then
flag = flag + 1
endif
next

buy at -close limit
graph flag
Yes – but if I use STOCHASTIC or use AVERAGE in my own calculation of the stochastic value then I get zero or the maximum value of j and no values in between.
If you see the image in the first post the indicator at the bottom is the exact same code counting stochastics that are below level and it works in an indicator but not in a strategy. There is something wrong in the ProOrder engine that is not wrong in the ProBuilder engine I think.
I coded this dummy strategy that in my mind should be able to calculate a stochastic[j,3] using a second loop to work out the average but even this returns different results to the indicator with settings of [j,3].
Top graphed line is the strategy and bottom is the indicator.
I’ll give up for tonight and wait for Nicolas to clock on to work tomorrow morning and see what he makes of it all!
level = 20

flag = 0
for j = 1 to 100
ll = lowest[j](low)
hh = highest[j](high)
stoch = (((close - ll)/(hh - ll))*100)

total = 0
d = 3
for a = 0 to d-1
total = total + stoch[a]
next
mystoch = total/d

if mystoch < level then
flag = flag + 1
endif
next

buy at -close limit

graph flag
Yes, it reminds me of the problem I encountered in this topic: Possible to code this 3D heatmap in PRT? (Mark Whistler’s Wave PM)
The conclusion was that the average takes the last calculated data and not the one of the period calculated dynamically in a loop..
Yes that all looks very familiar! I wish I’d remembered that topic yesterday as it could have saved a lot of time.
It seems that it has not yet been fixed.
It still seems strange that the last code I posted does not work as I tried to eliminate all built in indicators. When in a loop it must be picking up an incorrect value for something but loops are impossible for us to debug with graph so finding out which value is not possible.