EHLERS’ DOMINANT CYCLE INDICATORS convert From Amibroker To PRT

Viewing 2 posts - 1 through 2 (of 2 total)
  • Author
    Posts
  • #82733 quote
    MiketraderMiketrader
    Participant
    Average

    Hello

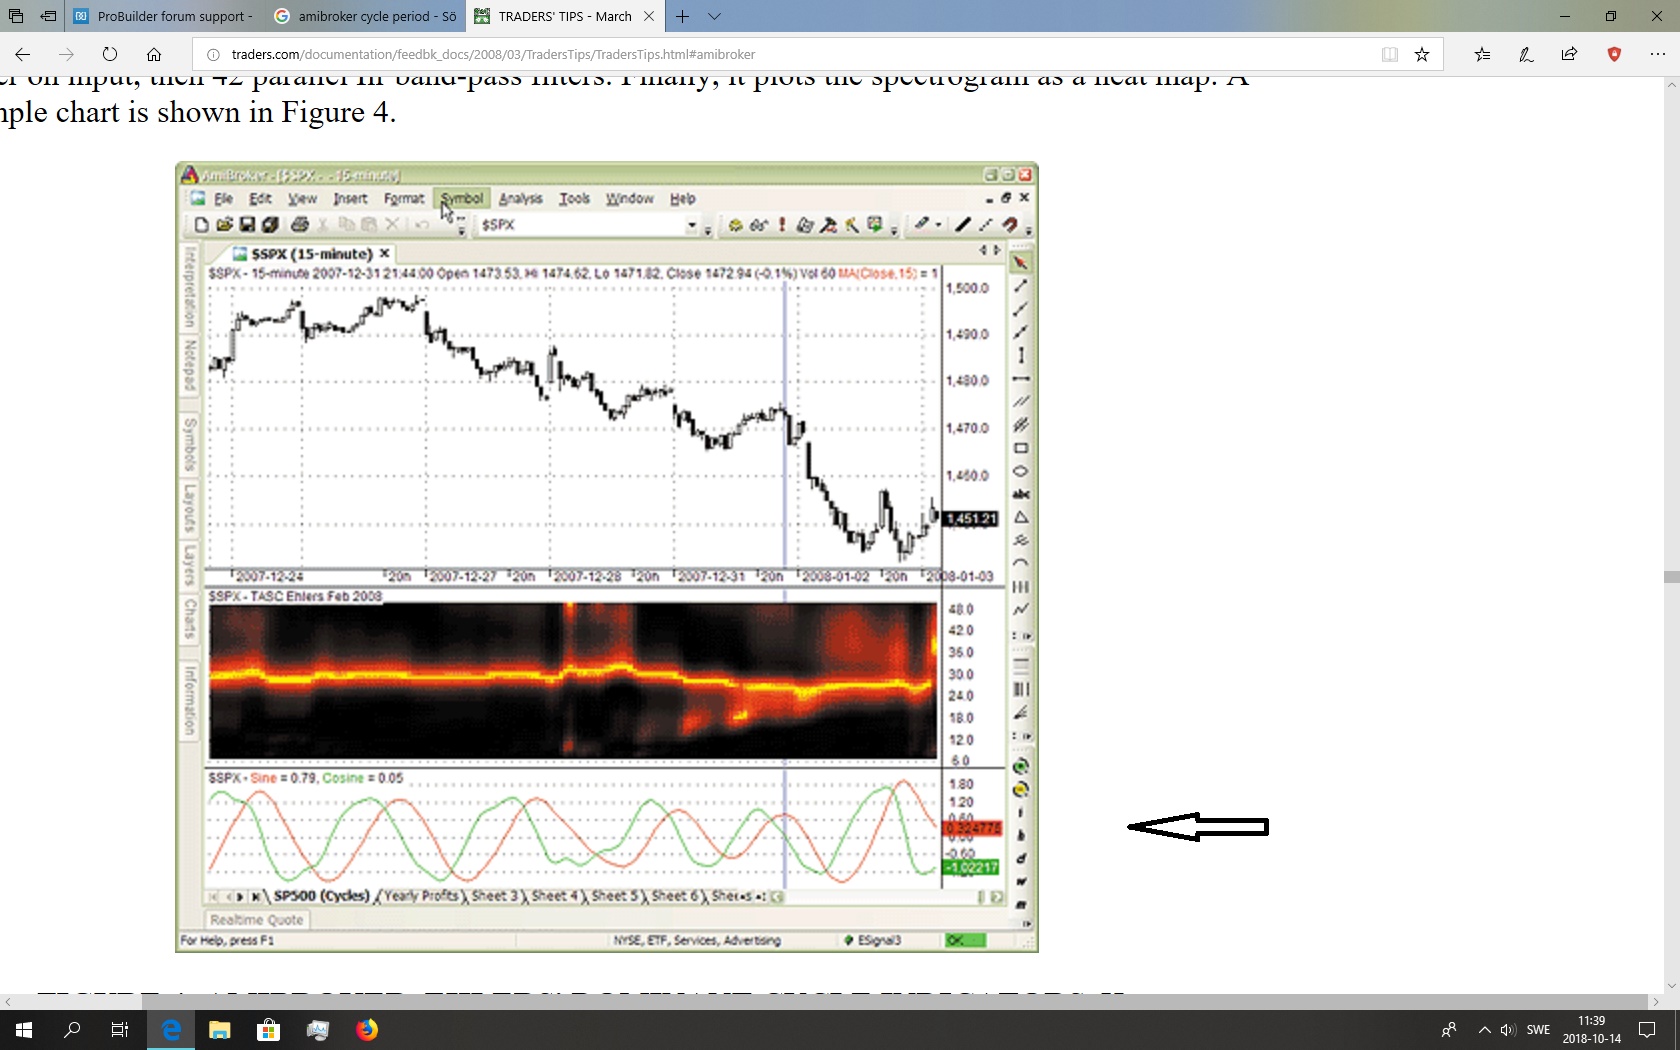
    I need help to convert this Amibroker Indicator code to PRT code.It’s contain two indicator ,what it looks. Cycle indicator I am interested in.

    It name is AMIBROKER, EHLERS’ DOMINANT CYCLE INDICATORS

    Any expert could help with this code?

    Best Regards Miketrader

    LISTING 1: Spectrum derived from filter bank and dominant cycle-tuned filter
    PI = 3.1415926;
    Data = (H+L)/2;
    // detrending ( high-pass filter )
    HFPeriods = Param("HP filter cutoff", 40, 20, 100 );
    alpha1 = ( 1-sin(2*pi/HFPeriods) ) / cos( 2 * pi / HFPeriods );
    HP = AMA2( Data - Ref( Data, -1 ), 0.5 * ( 1 + alpha1 ), alpha1 );
    // 6-tap low-pass FIR filter
    SmoothHP  = ( HP + 2 * Ref( HP, -1 ) + 3 * Ref( HP, -2 ) +
       3 * Ref( HP, -3 ) + 2 * Ref( HP, -4 ) + Ref( HP, -5 ) )/12;
    SmoothHPDiff = SmoothHP - Ref( SmoothHP, -1 );
    x = BarIndex();
    delta = -0.015 * x + 0.5;
    delta = Max( delta, 0.15 );
    Q  = 0;
    Real = 0;
    Imag = 0;
    Ampl = 0;
    DB =  0;
    I = SmoothHP;
    MaxAmpl = 0;
    for( N = 8; N <= 50; N++ )
    {
      beta = cos( 2 * PI / N );
      Q = ( N / ( 2 * PI ) ) * SmoothHPDiff;
     
      for( bar = 8; bar < BarCount; bar++ )
      {
         gamma = 1 / cos( 4 * PI * delta[ bar ] / N );
         alpha = gamma - sqrt( gamma ^ 2 - 1 );
     
         Real[ bar ] = 0.5 * ( 1 - alpha ) * ( I[ bar ] - I[ bar - 1 ] ) +
                       beta * ( 1 + alpha ) * Real[ bar - 1 ] -
                       alpha * Real[ bar - 2 ];
         Imag[ bar ] = 0.5 * ( 1- alpha ) * ( Q[ bar ] - Q[ bar - 1 ] ) +
                    beta * ( 1 + alpha ) * Imag[ bar - 1 ] -
                    alpha * Imag[ bar - 2 ];
       }
       Ampl = Real ^ 2 + Imag ^ 2;
       MaxAmpl = Max( MaxAmpl, Ampl );
       VarSet("Ampl"+N, Ampl );
    }
    TunedFilterDisplay = ParamToggle("Dom Cycle Tuned Filter", "No|Yes" );
    // Plot Heat Map ( Spectrogram )
    // and find dominant cycle
    DcNum = DcDenom = 0;
    for( N = 8; N <= 50; N++ )
    {
       Ampl = VarGet("Ampl"+N);
       db  = Nz( -10 * log10( 0.01 / ( 1 - 0.99 * Ampl / MaxAmpl ) ) );
     
       db = Min( db, 20 ) ;
       Red = IIf( db <= 10, 255, 255 * ( 2 - db/10 ) );
       Green = IIf( db <= 10, 255 * ( 1 - db/10 ), 0 );
       if( NOT TunedFilterDisplay  )
          PlotOHLC( N, N, N-1, N-1, "", ColorRGB( Red, Green, 0 ),
                                        styleCloud | styleNoLabel );
       DcNum = DcNum + (db < 3 ) * N * ( 20 - db );
       DcDenom = DcDenom + ( db < 3 ) * ( 20 - db );
    }
    DC = DcNum / DcDenom;
    if( ParamToggle("Show Dom. Cycle?", "No|Yes" ) )
    {
      DomCycle = Median( DC, 10 );
      Plot( DomCycle, "Dominant Cycle", colorBlue );
    }
    if( TunedFilterDisplay )
    {
       DomCycle = Median( DC, 10 );
       DomCycle = Max( DomCycle, 8 );
       Value = 0;
       for( bar = 10; bar < BarCount; bar++ )
       {
         beta = cos( 2 * PI / domCycle[ bar ] );
         gamma = 1 / cos( 4 * PI * delta[ bar ] / DomCycle[ bar ] );
         alpha = gamma - sqrt( gamma ^ 2 - 1 );
         Value[ bar ] = 0.5 * ( 1 - alpha ) * SmoothHPDiff[ bar ] +
               beta * ( 1 + alpha ) * Value[ bar - 1 ] -
               alpha * Value[ bar - 2 ];
       }
       Value2 = ( domCycle / ( 2 * PI ) ) * ( Value - Ref( Value, -1 ) );
       Plot( Value, "Sine", colorRed );
       Plot( Value2, "Cosine", colorGreen );
    }
    GraphZOrder = 1;


    NamnlösAMIBROKER-EHLERS-DOMINANT-CYCLE-INDICATORS.jpg NamnlösAMIBROKER-EHLERS-DOMINANT-CYCLE-INDICATORS.jpg
    #82785 quote
    NicolasNicolas
    Keymaster
    Legend

    There are a lot of Ehler’s indicators around in the forum about cycle, you’ll find them easily by using the search function of the website or with Google.

    Ehlers' Sinewave Indicator

    Ehler’s MESA indicators constantly reload/recalculate?

    …

Viewing 2 posts - 1 through 2 (of 2 total)
  • You must be logged in to reply to this topic.

ProRealAI ProRealAI New

Stuck on this ProBuilder code?

Describe what this topic is trying to build, in plain English, and ProRealAI writes the ProRealTime™ indicator, screener or system for you.

Available in 7 languages
Try ProRealAI

EHLERS’ DOMINANT CYCLE INDICATORS convert From Amibroker To PRT


ProBuilder: Indicators & Custom Tools

New Reply
Author
author-avatar
Miketrader @miketrader Participant
Summary

This topic contains 1 reply,
has 2 voices, and was last updated by NicolasNicolas

7 years, 11 months ago.

Topic Details
Forum: ProBuilder: Indicators & Custom Tools
Language: English
Started: 10/14/2018
Status: Active
Attachments: 1 files
ProRealCode ProRealCode
Loading...