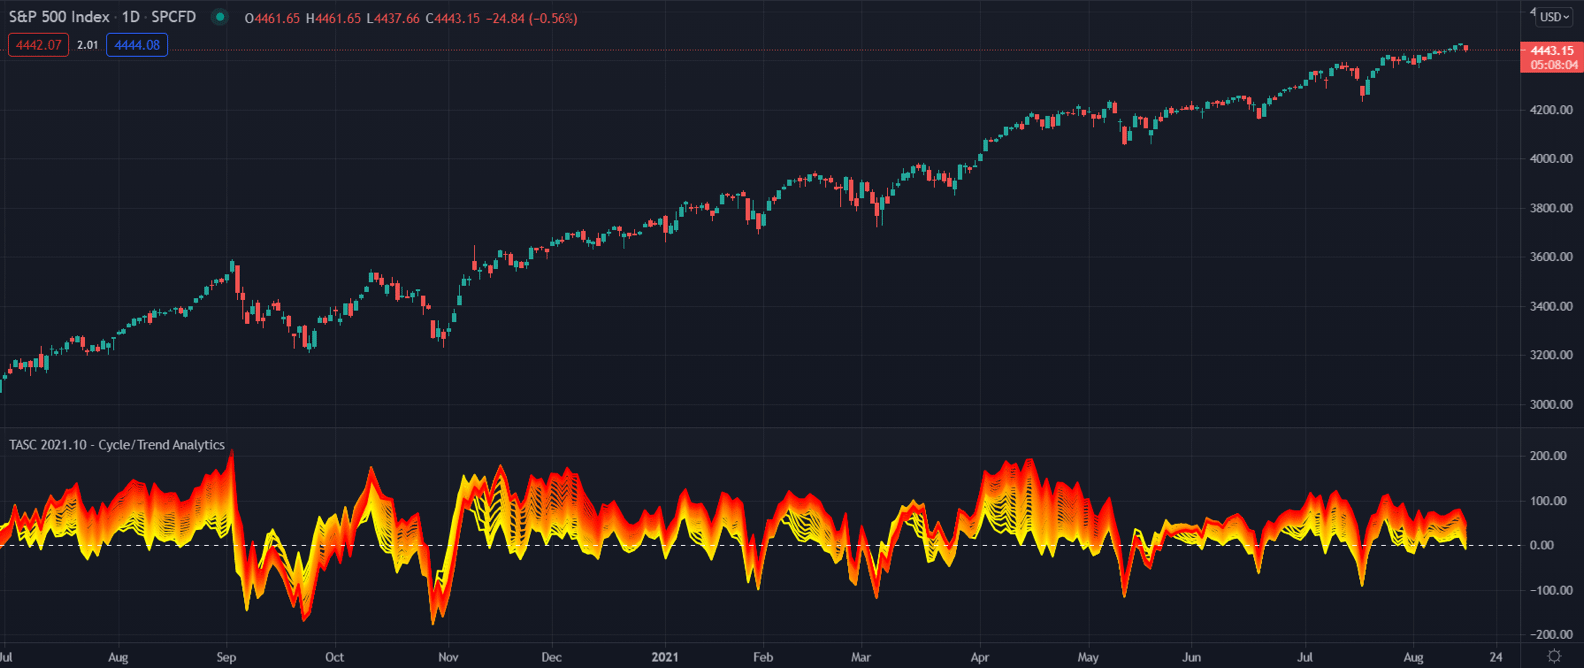
Codice su TradingView dell’indicatore Cycle/Trend Analytics e MAD Indicator, pubblicato sul TASC di Ottobre del 2021 di John F. Ehlers.
// (C) 2021 John F. Ehlers
// Translation from EasyLanguage to TradingView’s Pine Script by Ricardo Santos, for PineCoders.
//@version=4
study(“TASC 2021.10 – Cycle/Trend Analytics”)
string i_mode = input(“trend”, “Mode”, options = [“cycle”, “trend”])
float cyclePrice = 0.0
float trendPrice = 0.0
color c_cyan = color.new(#00ffff, 20)
if i_mode == “cycle”
cyclePrice := sin(360 * bar_index / 30)
trendPrice := cyclePrice
else if i_mode == “trend”
cyclePrice := na
trendPrice := close
plot(trendPrice – sma(trendPrice, 05), “Osc05”, color.rgb(255, 306 – 10.2 * 05, 0, 0), 2)
plot(trendPrice – sma(trendPrice, 06), “Osc06”, color.rgb(255, 306 – 10.2 * 06, 0, 0), 2)
plot(trendPrice – sma(trendPrice, 07), “Osc07”, color.rgb(255, 306 – 10.2 * 07, 0, 0), 2)
plot(trendPrice – sma(trendPrice, 08), “Osc08”, color.rgb(255, 306 – 10.2 * 08, 0, 0), 2)
plot(trendPrice – sma(trendPrice, 09), “Osc09”, color.rgb(255, 306 – 10.2 * 09, 0, 0), 2)
plot(trendPrice – sma(trendPrice, 10), “Osc10”, color.rgb(255, 306 – 10.2 * 10, 0, 0), 2)
plot(trendPrice – sma(trendPrice, 11), “Osc11”, color.rgb(255, 306 – 10.2 * 11, 0, 0), 2)
plot(trendPrice – sma(trendPrice, 12), “Osc12”, color.rgb(255, 306 – 10.2 * 12, 0, 0), 2)
plot(trendPrice – sma(trendPrice, 13), “Osc13”, color.rgb(255, 306 – 10.2 * 13, 0, 0), 2)
plot(trendPrice – sma(trendPrice, 14), “Osc14”, color.rgb(255, 306 – 10.2 * 14, 0, 0), 2)
plot(trendPrice – sma(trendPrice, 15), “Osc15”, color.rgb(255, 306 – 10.2 * 15, 0, 0), 2)
plot(trendPrice – sma(trendPrice, 16), “Osc16”, color.rgb(255, 306 – 10.2 * 16, 0, 0), 2)
plot(trendPrice – sma(trendPrice, 17), “Osc17”, color.rgb(255, 306 – 10.2 * 17, 0, 0), 2)
plot(trendPrice – sma(trendPrice, 18), “Osc18”, color.rgb(255, 306 – 10.2 * 18, 0, 0), 2)
plot(trendPrice – sma(trendPrice, 19), “Osc19”, color.rgb(255, 306 – 10.2 * 19, 0, 0), 2)
plot(trendPrice – sma(trendPrice, 20), “Osc20”, color.rgb(255, 306 – 10.2 * 20, 0, 0), 2)
plot(trendPrice – sma(trendPrice, 21), “Osc21”, color.rgb(255, 306 – 10.2 * 21, 0, 0), 2)
plot(trendPrice – sma(trendPrice, 22), “Osc22”, color.rgb(255, 306 – 10.2 * 22, 0, 0), 2)
plot(trendPrice – sma(trendPrice, 23), “Osc23”, color.rgb(255, 306 – 10.2 * 23, 0, 0), 2)
plot(trendPrice – sma(trendPrice, 24), “Osc24”, color.rgb(255, 306 – 10.2 * 24, 0, 0), 2)
plot(trendPrice – sma(trendPrice, 25), “Osc25”, color.rgb(255, 306 – 10.2 * 25, 0, 0), 2)
plot(trendPrice – sma(trendPrice, 26), “Osc26”, color.rgb(255, 306 – 10.2 * 26, 0, 0), 2)
plot(trendPrice – sma(trendPrice, 27), “Osc27”, color.rgb(255, 306 – 10.2 * 27, 0, 0), 2)
plot(trendPrice – sma(trendPrice, 28), “Osc28”, color.rgb(255, 306 – 10.2 * 28, 0, 0), 2)
plot(trendPrice – sma(trendPrice, 29), “Osc29”, color.rgb(255, 306 – 10.2 * 29, 0, 0), 2)
plot(trendPrice – sma(trendPrice, 30), “Osc30”, color.rgb(255, 306 – 10.2 * 30, 0, 0), 2)
plot(cyclePrice, “Cycle Price”, c_cyan, 3)
plot(sma(cyclePrice, 5) – sma(cyclePrice, 30), “MA delta”, color.green, 3)
hline(0, “Zero”, color.white)
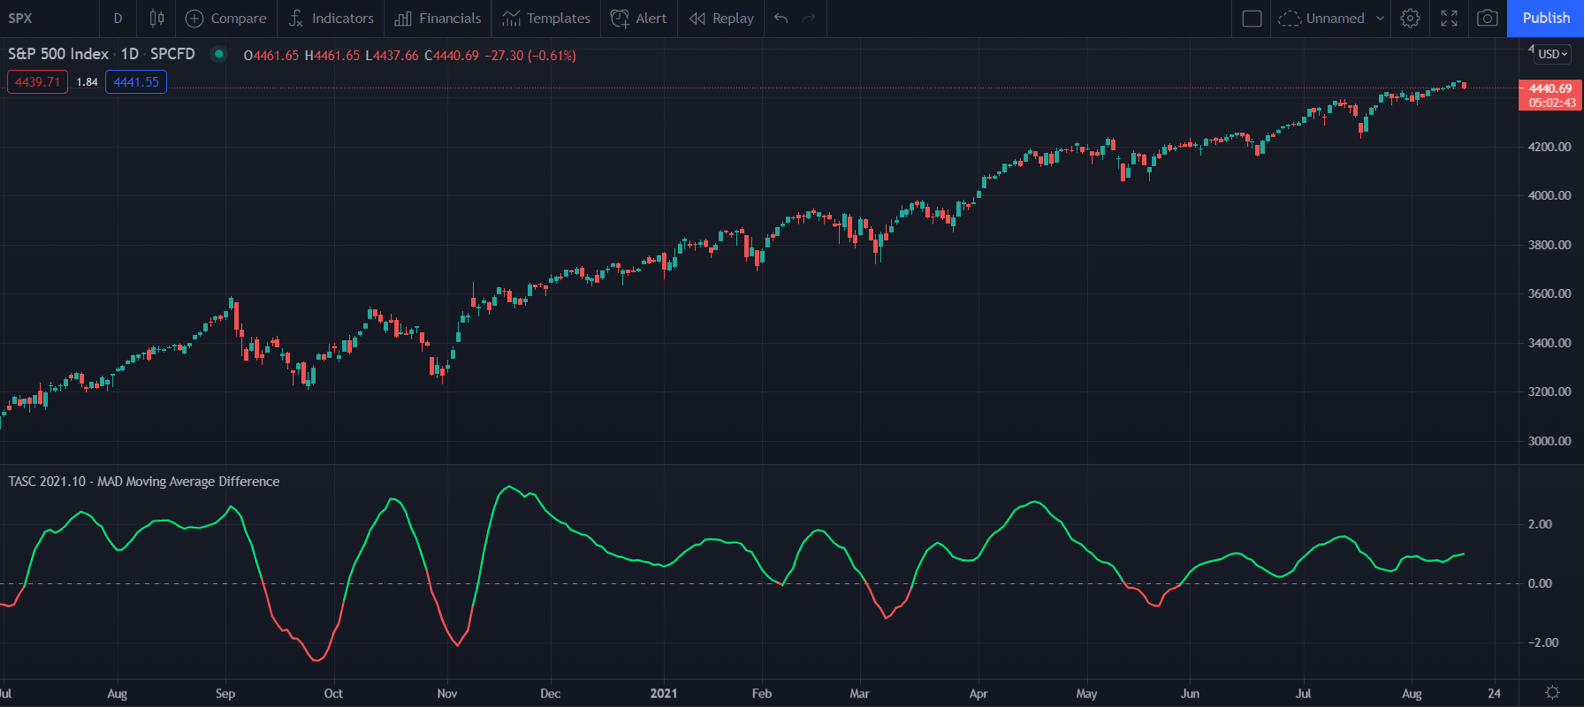
The Pine code for the MAD indicator presented by John Ehlers in his article in this issue is as follows:
//@version=4
// (C) 2021 John F. Ehlers
// Translation from EasyLanguage to TradingView’s Pine Script by Ricardo Santos, for PineCoders.
study(“TASC 2021.10 – MAD Moving Average Difference”)
int i_shortLength = input(8, “Short Length”)
int i_longLength = input(23, “Long Length”)
float shortAvg = sma(close, i_shortLength)
float longAvg = sma(close, i_longLength)
float mad = 100 * (shortAvg – longAvg) / longAvg
plot(mad, “MAD”, mad > 0 ? color.lime : color.red, 2)
hline(0, “Zero”)