Post i have open at this subject:
-https://www.prorealcode.com/topic/zigzag-bar-volume-besoin-aide-pour-correction-codage/#post-169414
-https://www.prorealcode.com/topic/weis-wave-volume-besoin-aide-pour-correction-codage/#post-169555
=> Anyone who has observed the movement of intraday prices knows that it takes place in a series of waves of buying and selling – a process of building and demolition. Prizes are not held in equal time batches.
When the natural price movement is time bound, the trend remains visible. Volume, however, is not doing as well. The subdivision of volume into time periods obscures the true strength of buying and selling. The Weis Wave plugin creates wave graphs with their corresponding wave volume.
I am sending you the link which explains how these 2 indicators work and the strategy linked to this methodology:
This is inspired by David Weis’s indicator based on the work of the famous Mr Wyckoff
David Weis official website => https://weisonwyckoff.com/weis-wave/
example of business strategy => https://atas.net/atas-possibilities/indicators/how-to-use-the-weis-waves-indicator/
Extract from David WEIS’s site on his Weis Wave plugin:
“The Weis Wave Plugin is on top of anything currently available to the trading community. I have been trading for 25 years and have been using the Weis Wave for three years. With its unique wave volume, the Weis Wave helps traders recognize turning points. —Alfred T., Austria
I have to tell you that your Weis Wave has been EXTREMELY useful!
I have been trading for a living for over 15 years now… this tool you provided has made things much clearer for me. —TK
The Weis Wave plugin is the end product of 30 years of working to find the most accurate representation of volume. The information gleaned from this plugin is a great help in anticipating trend changes to varying degrees. “
Hi, Christophe.
Your messages are a nice surprise.
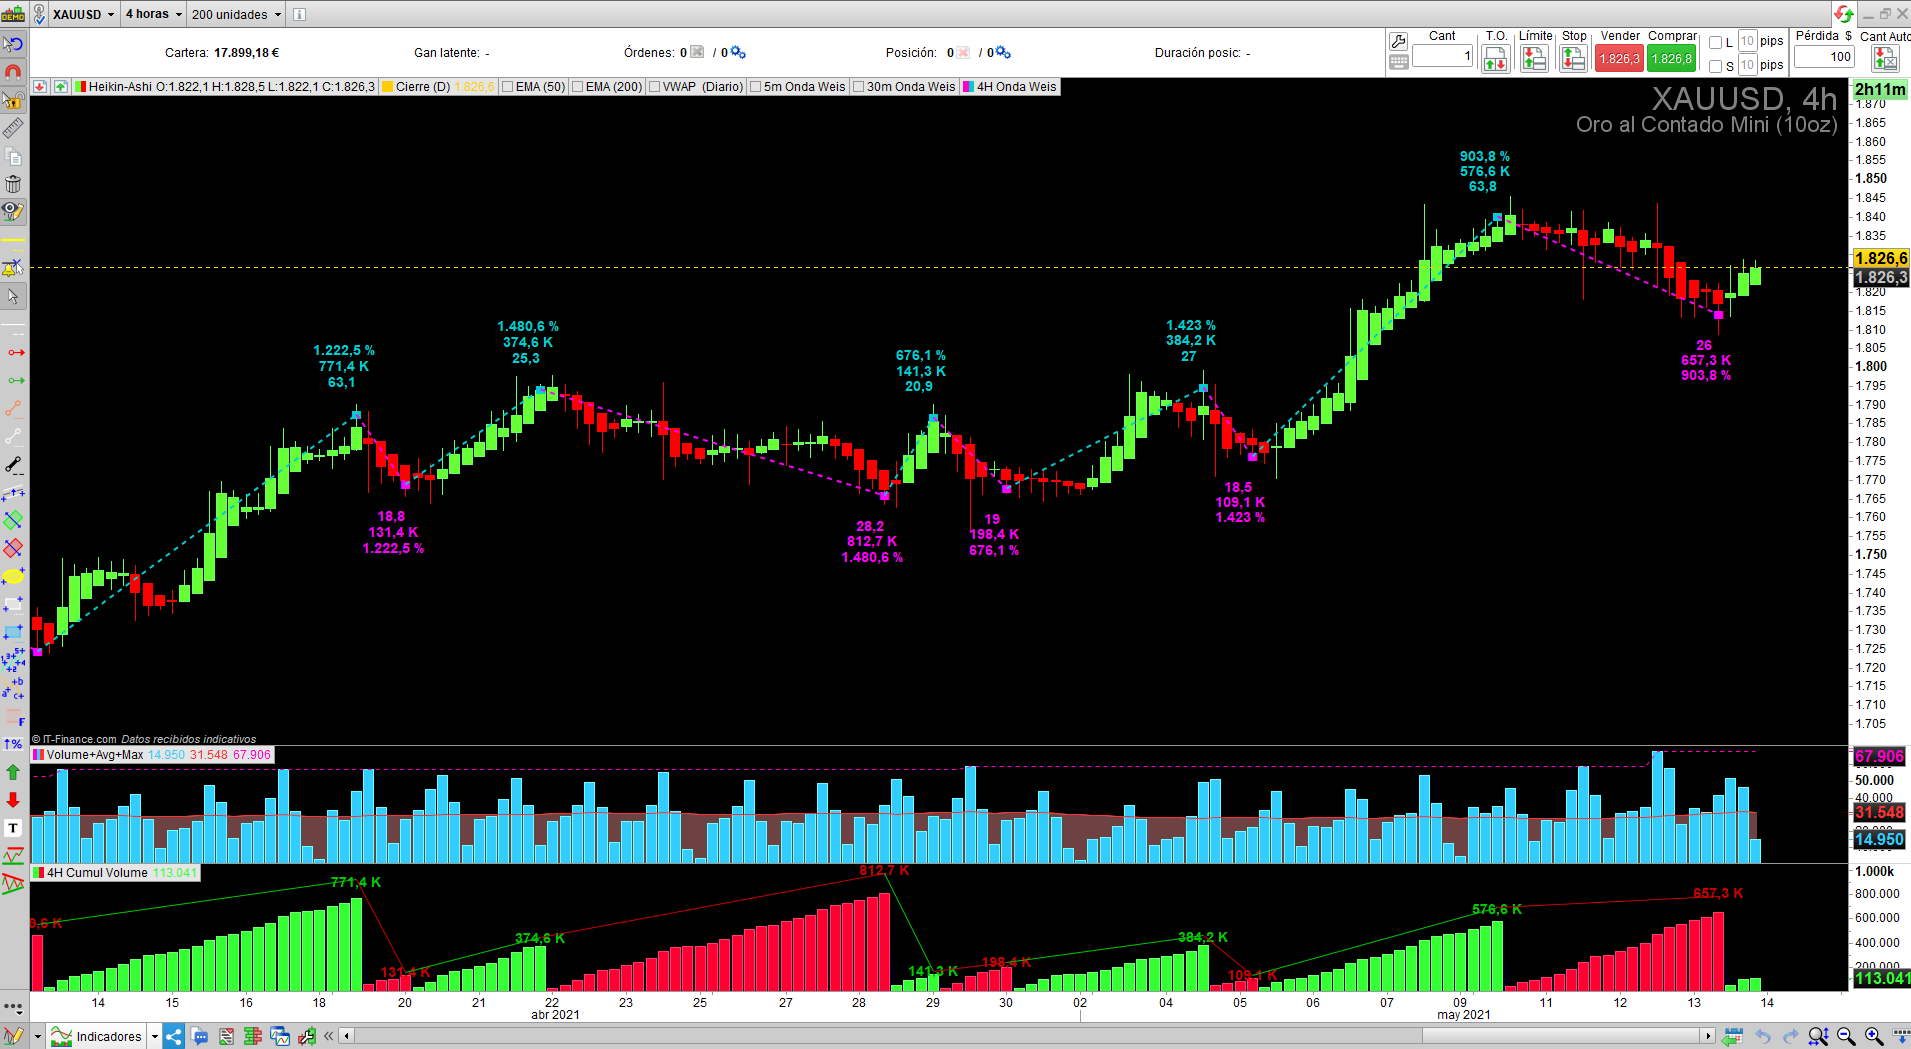
For both indicators you are trying to compile – Cumulative Weiss Wave Volume (Histogram) and Zigzag Weiss Wave Volume (Bar) – I have used the ZigZag function, which is integrated in ProRealTime by default. I presume it has pros and cons:
Pro 1: the calculations to detect and print the significant wave points (highs or peaks or tops and lows or toughs or bottoms) on the price chart are much easier through the ZigZag function.
Pro 2: the ZigZag function is applicable for both Weis indicators with just one adaptation need in both cases: the “percentVariation” parameter, which is linked with the quantity of peaks and toughs you want the ZigZag function to detect (depending on the timeframe). Let´s call it the “fractal/timeframe selection”.
Con: Even if I tested and stablished the best values for the “percentVariation” parameter on each timeframe (from 10 secs to 3 months), I was not able to compile the code in a way that the timeframe being used on the chart is automatically detected and, therefore, the “percentVariation” value is automatically assigned, so that one single version of each indicator is usable for no matter which timeframe is selected by the user.
If I am not wrong (and please, correct me if I am wrong):
* You haven’t used the ZigZag function but a different calculation to detect significant peaks and toughs.
* The “cp” parameter plays, more or less, the same role as the “percentVariation” one: to solve the “fractal/timeframe selection”.
* Same as in the indicators I have posted, in your codes the “fractal/timeframe selection” is manual (not automatic).
So, I wonder: why don’t you just try the indicators I have posted? With all my respect (I can imagine the time it took you to compile, test and debug your codes) I do not see any advantage in your codes (and, again, please correct me if I am wrong).
I have attached a screenshot, so that you can see the aspect of both indicators, for a 4H timeframe, once they have been installed. Is this what you look for? I would like to get your comments, please.
Let’s keep in touch.
Hello,
I know the zigzag application to use it but not in the case of weis waves.
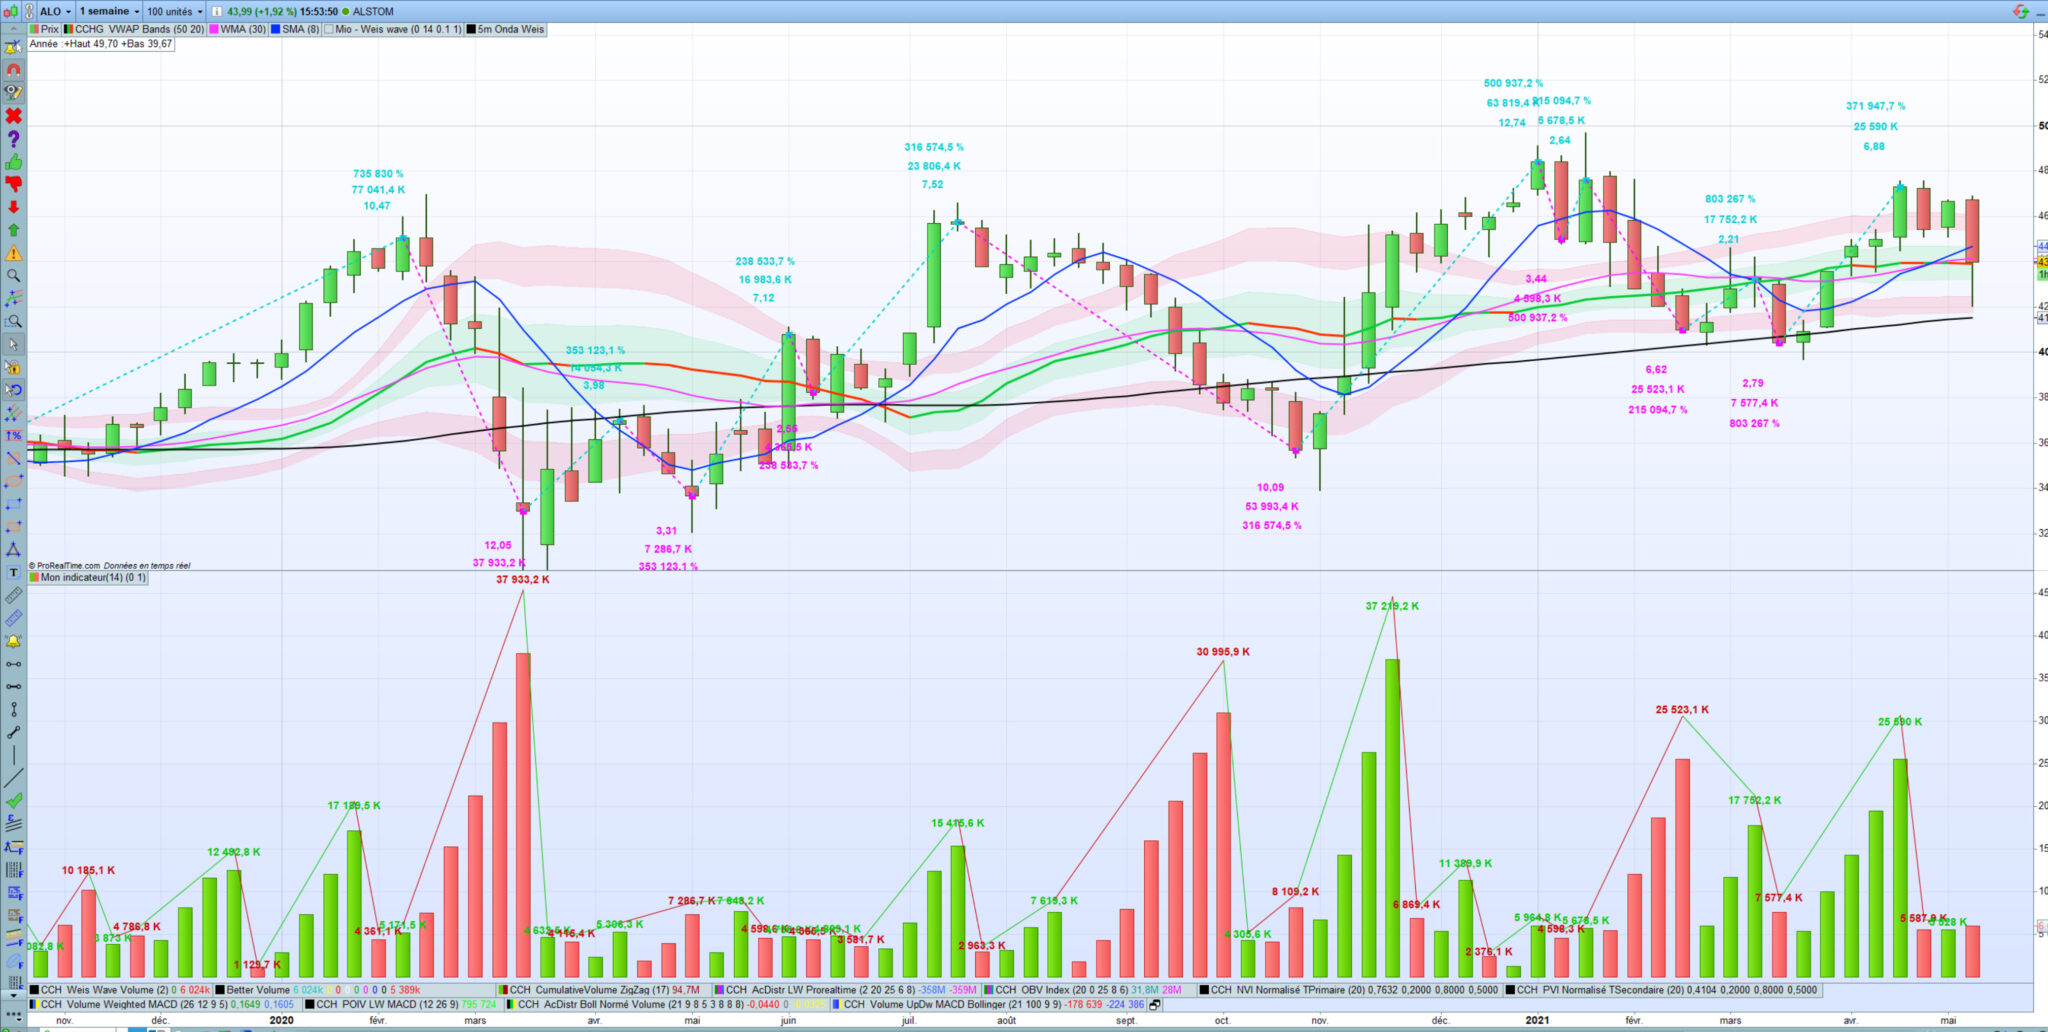
indeed, there is no correspondence between the wave and the histogram. or at the cost of countless adjustment games, particularly on the equity markets.
Moreover you will see on the photograph attached to the message this problem which I also encounter with your indicators based on zigzag with a setting of 4.8 for a TF of 1 day.
The 2 oscillators that I sent you on which I want to improve by adding the volumes do not require adjustment for the histogram some is the TF and for the wave very little either and almost synchronous with the histogram.
This is why I would like to have the opinion of Nicolas or a colleague on my code error.
Ok, understood.
I will check your codes deeply, look for the error and keep you posted.
Donne moi quelques jours, STP.
Have a nice weekend, Christophe
By the way,
The indicators I posted here just need to change one single parameter to adapt to the timeframe. This parameter is at the very beginning of the code, where it is explained how it works.
Once the parameter is adapted (the same way on both codes), they both (cumulated volume and price waves) are 100% synchronized.
Maybe this information helps.
However, I am going to take a look to your codes.
Thank you.