Bonjour,
J’ai élaboré un indicateur de suivi de tendance et je l’ai transformé en screener pour identifier des opportunités et j’ai une grosse difficulté.
En affichant mon indicateur sur le graphique sélectionné depuis le screener, je m’attendais à retrouver sur la dernière barre du graphique (même UT), la même valeur sur l’indicateur et sur le screener : mais non ! La valeur du screener ne correspond jamais à ma valeur d’indicateur sur la dernière barre !
Est-on d’accord que je devrais trouver la même valeur ? Si oui, quelle type d’erreur je pourrais commettre ?
Merci
Il peut y avoir plusieurs raisons à cela:
- compte gratuit avec données fin de journée (donc résultat de la veille uniquement dans le screener)
- calcul d’indicateurs avec une période supérieur à l’historique disponible dans ProScreener (dépend du type de compte)
- indicateurs/conditions basés sur une accumulation de données (donc sans période), si historique différent, alors résultat différent
Merci de ces retours, la situation :
- compte gratuit avec données fin de journée (donc résultat de la veille uniquement dans le screener)
- => Compte gratuit, mais j’ouvre une fenêtre graphique depuis le screener, les prix sont bien suivis de “(c)” mais ce prix est effectivement celui de la dernière bar de mon graphique : le mystère me semble entier.
- calcul d’indicateurs avec une période supérieur à l’historique disponible dans ProScreener (dépend du type de compte)
- => Le calcul de l’indicateur est effectué sans changement d’UT
- indicateurs/conditions basés sur une accumulation de données (donc sans période), si historique différent, alors résultat différent
- => Je ne suis pas sur de comprendre “Donc sans période”. .. j’utilise simplement (defparam drawonlastbaronly=true
defparam calculateonlastbars=1000)
Je suis un UT journalier; Je cherche et ne trouve toujours pas le pb.
Je simplifie le pb, je prends votre code de “zigzagAverage” publié le 30/05/2018, et je l’utilise à la fois en indicateur et en screeneur.
...
peak = ZigZag[Percentage](high)
trough = ZigZag[Percentage](low)
if peak<peak[1] and peak[1]>peak[2] then
 last=1
endif
...
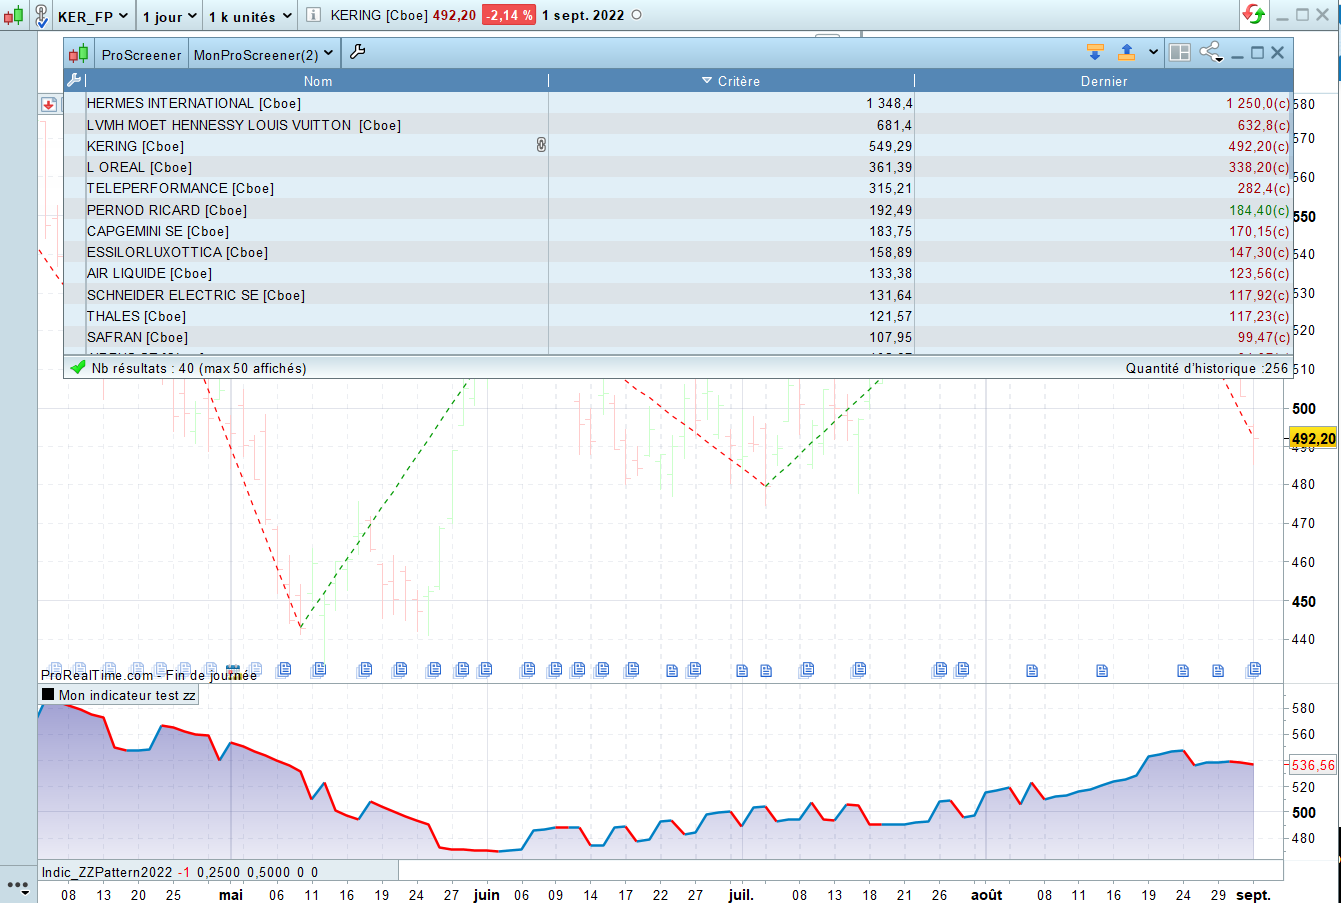
Je suis sur une UT 1 jour, en mode gratuit, je vous affiche le screener et le graphique ouvert depuis le screener de la 3ème ligne, KERING.
On voit bien que la valeur ‘dernier’ est la même sur le graphique et sur le screener (492,2) mais que la valeur ‘critère’ est différente (549,9 dans le screener, et 536,56 dans le graphique), alors qu’il s’agit du même code et de la même variable utilisée (Screener (mm) vs return mm coloured(r,g,b) style(line,2)).
Avec ce code aussi , j’ai un écart. A quoi est-il dû ? Comment y remédier ?
On tombe dans le cas n°3 évoqué plus haut. Puisqu’on calcule une variation du prix en pourcentage depuis le début de l’historique, si on commence plus tôt (graphique) que sur le screener, alors la variation ne sera pas la même, d’où la constatation d’un écart.
Exemple: si je mesure la variation du CAC40 depuis Janvier 2022, elle ne sera pas la même si je la mesure depuis Mars 2022 et c’est ce que tu fais avec ton screener.
Merci, donc pour y remédier, je dois passe en points et non en pourcentage ? Ou encore, je dois caler les débuts d’historique du screener et de l’indicateur ? Comment faire pour cette dernière solution ?
Selon ton type de compte, la quantité d’historique est la suivante:
- IG demo/complete = 255
- IG réel complete = 255
- PRT trading premium = 1024
- PRT soft complete = 255
On peut le tester avec un code comme celui-ci:
screener (barindex as "historique")
Donc mettre en corrélation le nombre d’unités affiché sur le graphique pour obtenir une meilleure correspondance.
Toujours de difficultés à résoudre mon point :
Je suis donc à 255 barres pour mon screener en mode gratuit.
Pour le calcul de mon indicateur, je limite mon nombre de barres avec calculateonlastbars = 255 et une boucle : for i= 1 to 255 do …
Mais j’ai toujours un écart entre le screener et l’indicateur
La barre courante c’est 0, donc 255+1 = 256, voir si c’est pas là où se pose le problème (je ne pense pas mais …).
Avec un exemple de code je pourrai reproduire et amener une réponse plus rapide à ton problème, merci.
Voici les codes Indicateur et screener :
// INDIC
defparam drawonlastbaronly=true
defparam calculateonlastbars=1000

// --- settings
ParamZigZag = 5 //zigzag percent
Actualy = Close
CoeffOrdreImminent =  ParamZigZag / 100 * Actualy
CoeffRetournementMini = 2
CoeffTendanceClaire = 2
CoeffPertinenceSignal = 1.5


lookback = 255 //max history lookback : for  inc= 1 to lookback do
// --- end of settings

//zz s/r
zz = ZigZag [ParamZigZag] (customclose)
p = zz<zz[1] and zz[1]>zz[2]
t = zz>zz[1] and zz[1]<zz[2]

if p then
topl = zz[1]
endif
if t then
bottoml = zz[1]
endif

y0 = Close

inc=1
for  i= 1 to lookback do
if p[i] then
if inc = 1 then
topy1 = topl [i]
topx1 = barindex [i]-1
inc = inc + 1
elsif inc = 2 then
topy2 = topl [i]
topx2 = barindex [i]-1
inc = 3
Endif
endif
next

inc = 1
for  i= 1 to lookback do
if t[i] then
if inc = 1 then
bottomy1 = bottoml [i]
bottomx1 = barindex [i]-1
inc = inc + 1
elsif inc = 2 then
bottomy2 = bottoml [i]
bottomx2 = barindex [i]-1
inc = 3
Endif
endif
next


// Achat ou Vente ?
if bottomx1<topx1 then
Direction = -1
Else
Direction = 1
Endif

Ordre=0
Ordre1=0
Ordre2=0
Ordre3=0
Ordre4=0
// Imminence d'un ordre
if Direction = 1 then
ActualGap = topy1-Actualy // >0
Else
ActualGap = Actualy-bottomy1 // >0
Endif

If (ActualGap>0) and (abs(ActualGap)< CoeffOrdreImminent) then
Ordre1 = 0.25
endif
//Ordre1 = ActualGap

// Signal significatif
if Direction = 1  then
HeightofPic = topy1 -0.5 * (bottomy1+bottomy2) // >0
Else
HeightofPic =  0.5 * (topy1+topy2) - bottomy1 // >0
Endif
//Ordre2 = HeightofPic
If  HeightofPic > (CoeffRetournementMini * ParamZigZag/100 * Actualy) then
Ordre2 = 0.5
endif

// Tendance Claire
TopGap = topy1-topy2 // >0 si direction=1
BottomGap = bottomy1-bottomy2 // >0 si direction=1
//If ((Direction=1) And(TopGap*BottomGap >0 ) And (BottomGap> CoeffTendanceClaire *TopGap) ) Or ((Direction=-1) And(TopGap*BottomGap >0 ) And (TopGap<  CoeffTendanceClaire *BottomGap) )  then
If ((Direction=1) And(TopGap*BottomGap >0 ) And (TopGap>0)) Or ((Direction=-1) And(TopGap*BottomGap >0) And (TopGap<0))  then
Ordre3 = 0.75
endif

// Signal toujours pertinent
If ((direction =1 ) AND ((barindex[0] - bottomx1) <  CoeffPertinenceSignal* (bottomx1-bottomx2))) then
ordre4 = 0.2
elsif ((direction= -1) AND ((barindex[0] - topx1) < CoeffPertinenceSignal* (topx1-topx2))) then
ordre4=0.2
endif

//Endif
//Endif
//Endif

//Return Direction As "Direction",
//Return bottomx1 As "bx1", bottomx2 As "bx2", topx1 As "tx1", topx2 As "tx2"
//Return barindex[0]-Bottomx1 as "bx1",  CoeffPertinenceSignal* (bottomx1-bottomx2) as "compare"
//Return Direction As "Direction", Ordre1 As "ActualGap", Ordre2 As "HeightofPic", Ordre3 As "Tendance claire", Ordre4 As " Tjrs pertinent"
Ordre = Ordre1+Ordre2+Ordre3+Ordre4
Return Ordre
// SCREENER
//defparam drawonlastbaronly=true
//defparam calculateonlastbars=255

// --- settings
ParamZigZag = 5 //zigzag percent
Actualy = Close
CoeffOrdreImminent =  ParamZigZag / 100 * Actualy
CoeffRetournementMini = 2
//CoeffTendanceClaire = 2
CoeffPertinenceSignal = 1.5


lookback = 255 //max history lookback : for  inc= 1 to lookback do
// --- end of settings

//zz s/r
zz = ZigZag [ParamZigZag] (customclose)
p = zz<zz[1] and zz[1]>zz[2]
t = zz>zz[1] and zz[1]<zz[2]

if p then
topl = zz[1]
endif
if t then
bottoml = zz[1]
endif

//y0 = Close

inc=1
for  i= 1 to lookback do
if p[i] then
if inc = 1 then
topy1 = topl [i]
topx1 = barindex [i]-1
inc = inc + 1
elsif inc = 2 then
topy2 = topl [i]
topx2 = barindex [i]-1
inc = 3
Endif
endif
next

inc = 1
for  i= 1 to lookback do
if t[i] then
if inc = 1 then
bottomy1 = bottoml [i]
bottomx1 = barindex [i]-1
inc = inc + 1
elsif inc = 2 then
bottomy2 = bottoml [i]
bottomx2 = barindex [i]-1
inc = 3
Endif
endif
next


// Achat ou Vente ?
if bottomx1<topx1 then
Direction = -1
Else
Direction = 1
Endif

Ordre=0
Ordre1=0
Ordre2=0
Ordre3=0
Ordre4=0
// Imminence d'un ordre
if Direction = 1 then
ActualGap = topy1-Actualy // >0
Else
ActualGap = Actualy-bottomy1 // >0
Endif

If (ActualGap>0) and (abs(ActualGap)< CoeffOrdreImminent) then
Ordre1 = 0.25
endif
//Ordre1 = ActualGap

// Signal significatif
if Direction = 1  then
HeightofPic = topy1 -0.5 * (bottomy1+bottomy2) // >0
Else
HeightofPic =  0.5 * (topy1+topy2) - bottomy1 // >0
Endif
//Ordre2 = HeightofPic
If  HeightofPic > (CoeffRetournementMini * ParamZigZag/100 * Actualy) then
Ordre2 = 0.5
endif

// Tendance Claire
TopGap = topy1-topy2 // >0 si direction=1
BottomGap = bottomy1-bottomy2 // >0 si direction=1
//If ((Direction=1) And(TopGap*BottomGap >0 ) And (BottomGap> CoeffTendanceClaire *TopGap) ) Or ((Direction=-1) And(TopGap*BottomGap >0 ) And (TopGap<  CoeffTendanceClaire *BottomGap) )  then
If ((Direction=1) And(TopGap*BottomGap >0 ) And (TopGap>0)) Or ((Direction=-1) And(TopGap*BottomGap >0) And (TopGap<0))  then
Ordre3 = 0.75
endif

// Signal toujours pertinent
If ((direction =1 ) AND ((barindex[0] - bottomx1) <  CoeffPertinenceSignal* (bottomx1-bottomx2))) then
ordre4 = 0.2
elsif ((direction= -1) AND ((barindex[0] - topx1) < CoeffPertinenceSignal* (topx1-topx2))) then
ordre4=0.2
endif

//Endif
//Endif
//Endif
Ordre= Ordre1+Ordre2+Ordre3+Ordre4
//Ordre = Ordre3
Screener (Ordre As "Zone d'Achat/Vente")
//Return Direction As "Direction", Ordre1 As "ActualGap", Ordre2 As "HeightofPic", Ordre3 As "Tendance claire", Ordre4 As " Tjrs pertinent"
Bonjour, faut-il que je vous présente un code plus simple ?
Pourquoi pas ? 🙂 J’ai essayé et constaté des différences, mais entre les boucles et le zigzag qui repeint, confronté à l’historique qui est différent … j’ai des doutes sur la même restitution des résultats.
Bonjour , voici une version courte : indicateur et screener sont à “1” lorsque les 2 derniers sommets vont dans le même sens (vers le haut ou vers le bas) que les 2 derniers creux/
// SCREENER

// --- settings
ParamZigZag = 5 //zigzag percent

lookback = 255 //max history lookback : for  inc= 1 to lookback do


zz = ZigZag [ParamZigZag] (customclose)
p = zz<zz[1] and zz[1]>zz[2]
t = zz>zz[1] and zz[1]<zz[2]

if p then
topl = zz[1]
endif
if t then
bottoml = zz[1]
endif


inc=1
for  i= 1 to lookback do
if p[i] then
if inc = 1 then
topy1 = topl [i]
topx1 = barindex [i]-1
inc = inc + 1
elsif inc = 2 then
topy2 = topl [i]
inc = 3
Endif
endif
next

inc = 1
for  i= 1 to lookback do
if t[i] then
if inc = 1 then
bottomy1 = bottoml [i]
bottomx1 = barindex [i]-1
inc = inc + 1
elsif inc = 2 then
bottomy2 = bottoml [i]
inc = 3
Endif
endif
next


// Achat ou Vente ?
if bottomx1<topx1 then
Direction = -1
Else
Direction = 1
Endif

Ordre=0
// Tendance Claire
TopGap = topy1-topy2 // >0 si direction=1
BottomGap = bottomy1-bottomy2 // >0 si direction=1

If ((Direction=1) And(TopGap*BottomGap >0 ) And (TopGap>0)) Or ((Direction=-1) And(TopGap*BottomGap >0) And (TopGap<0))  then
Ordre = 1
endif

Screener( Ordre)
// INDIC
defparam drawonlastbaronly=true
defparam calculateonlastbars=256

// --- settings
ParamZigZag = 5 //zigzag percent

lookback = 255 //max history lookback : for  inc= 1 to lookback do


zz = ZigZag [ParamZigZag] (customclose)
p = zz<zz[1] and zz[1]>zz[2]
t = zz>zz[1] and zz[1]<zz[2]

if p then
topl = zz[1]
endif
if t then
bottoml = zz[1]
endif

inc=1
for  i= 1 to lookback do
if p[i] then
if inc = 1 then
topy1 = topl [i]
topx1 = barindex [i]-1
inc = inc + 1
elsif inc = 2 then
topy2 = topl [i]
inc = 3
Endif
endif
next

inc = 1
for  i= 1 to lookback do
if t[i] then
if inc = 1 then
bottomy1 = bottoml [i]
bottomx1 = barindex [i]-1
inc = inc + 1
elsif inc = 2 then
bottomy2 = bottoml [i]
inc = 3
Endif
endif
next


// Achat ou Vente ?
if bottomx1<topx1 then
Direction = -1
Else
Direction = 1
Endif

Ordre=0
// Tendance Claire
TopGap = topy1-topy2 // >0 si direction=1
BottomGap = bottomy1-bottomy2 // >0 si direction=1

If ((Direction=1) And(TopGap*BottomGap >0 ) And (TopGap>0)) Or ((Direction=-1) And(TopGap*BottomGap >0) And (TopGap<0))  then
Ordre = 1
endif

Return Ordre