Compression Range breakout

Viewing 1 post (of 1 total)
  • Author
    Posts
  • #48880 quote
    lglmrc
    Participant
    New

    Hello,

    I’m wondering how to build a screener for identifying range breaks.

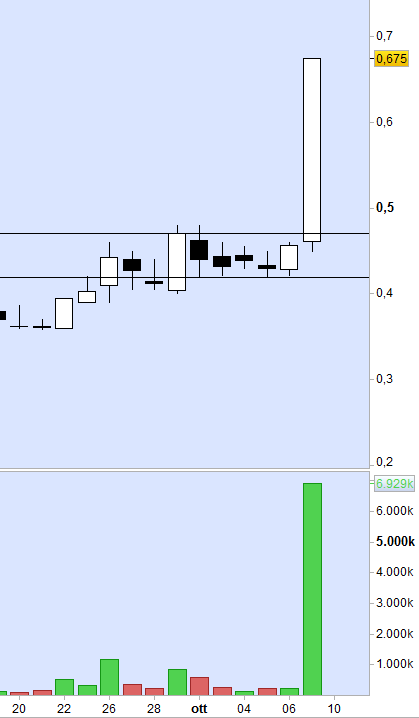
    I’d like to screen for compression ranges breakouts with expanded volume.

    The screener should try to find charts’ setups with narrow ranges (also known as consolidation ranges) with above average volume.

    I was thinking to use some sort of summation function to identify such consolidation ranges and relative volume for aexpanded volume.

    Any help would be much appreciated.

    Thanks in advance,

    Marco L.

    Dr Manhattan thanked this post
    range_break.png range_break.png
Viewing 1 post (of 1 total)
  • You must be logged in to reply to this topic.

Compression Range breakout


ProScreener: Market Scanners & Detection

New Reply
Author
author-avatar
lglmrc @lglmrc Participant
Summary

This topic contains 1 voice and has 0 replies.

Topic Details
Forum: ProScreener: Market Scanners & Detection
Language: English
Started: 10/10/2017
Status: Active
Attachments: 1 files
Logo Logo
Loading...