Bard
BardParticipant
Master
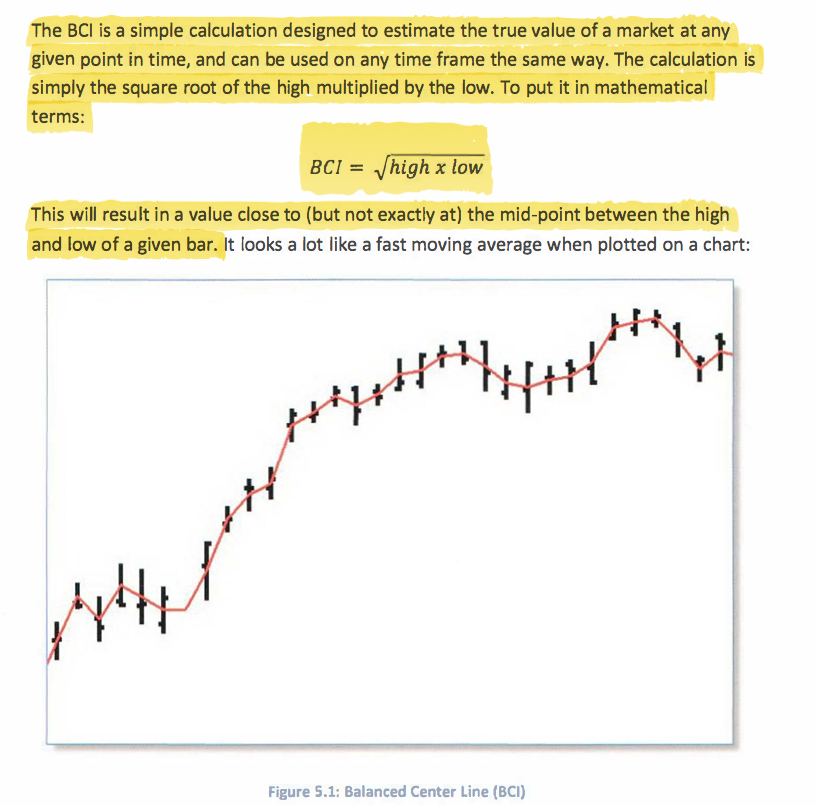
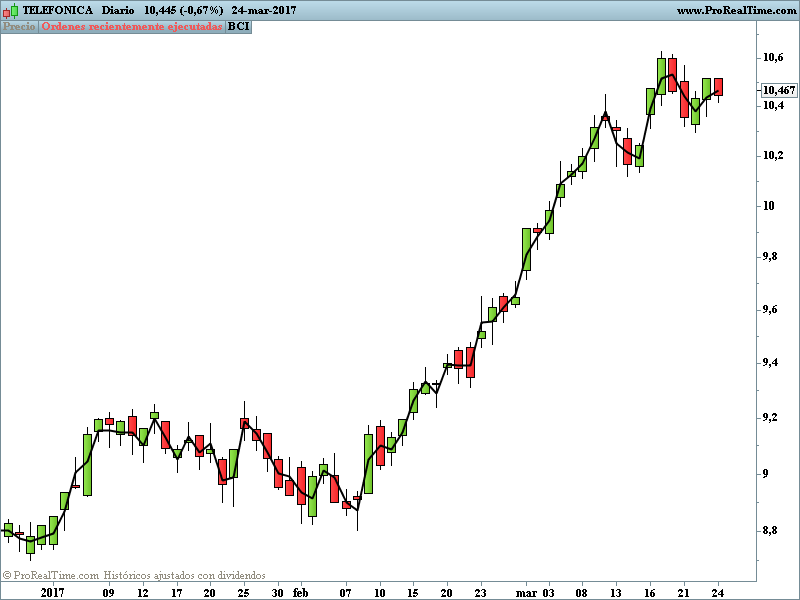
This Balanced Centreline Indicator (BCI) when placed on a chart resembles a tight short moving average or a (John Ehlers) Kalman Filter and is designed to calculate the true market price at any given time and for any timeframe.
The indicator will give a near mid point value between the high and low of a market and represents the estimated point where the market wants to trade at.
The formula is: BCI = the Square Root of the (High x Low): Pls see calculation image.
The rules are:
If Tomorrows Open is below the BCI line, then go Long.
and
If Tomorrows Open is above the BCI line, then go Short.
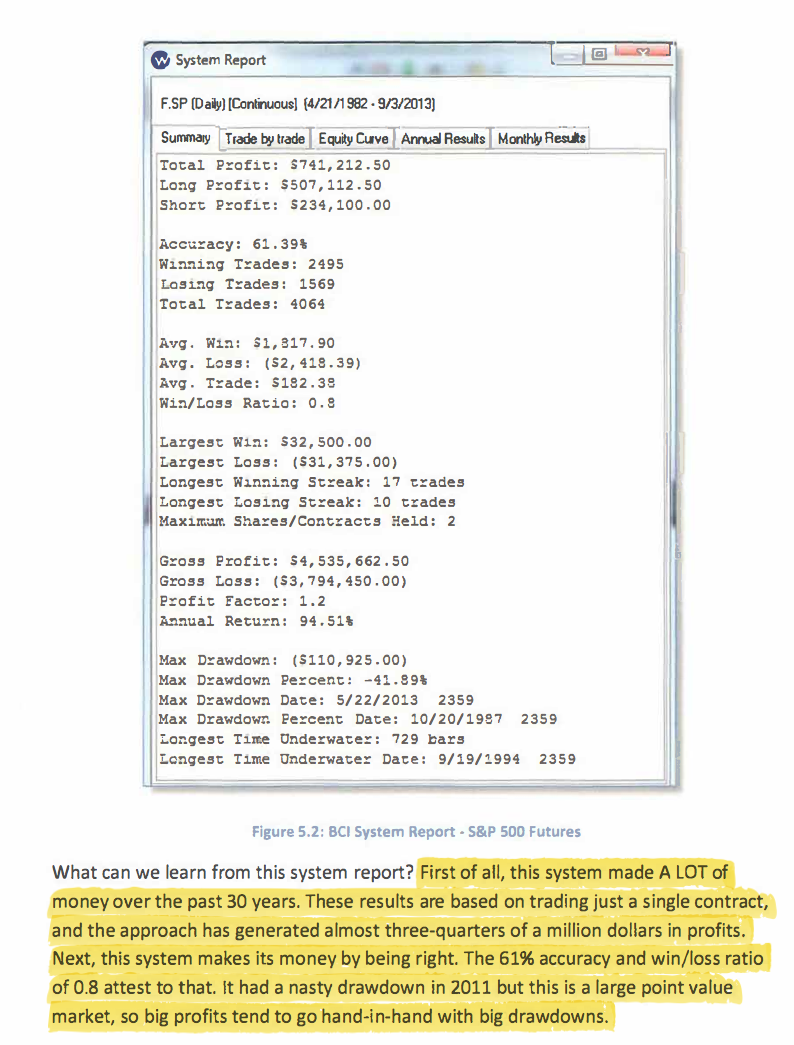
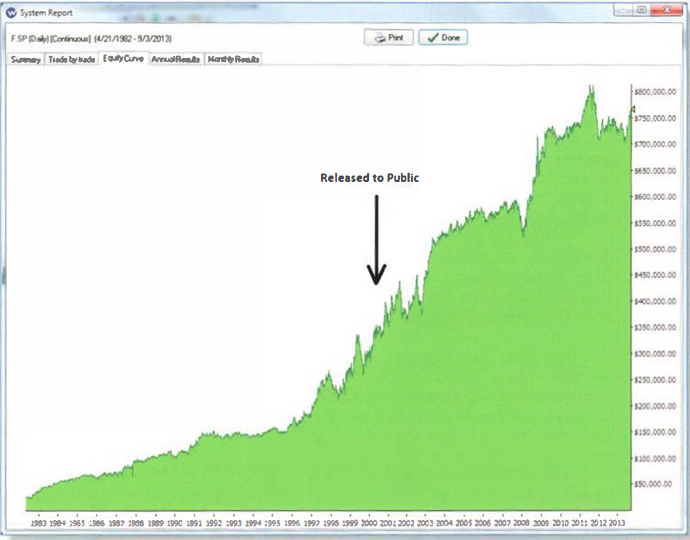
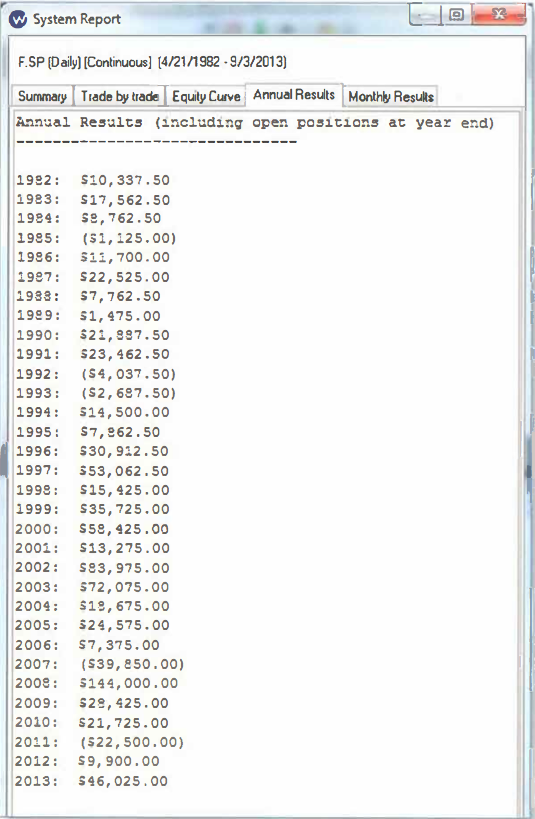
It’s very profitable results were derived using $250 a point on the S&P – pls see the screenshots:
I’m wondering if anyone can program this for PRT?
Imagine getting out in 2007…
Thanks.
Hi, I think this is a very interesting idea. I think the code for Prorealtime would be this one.
Can anyone check it?
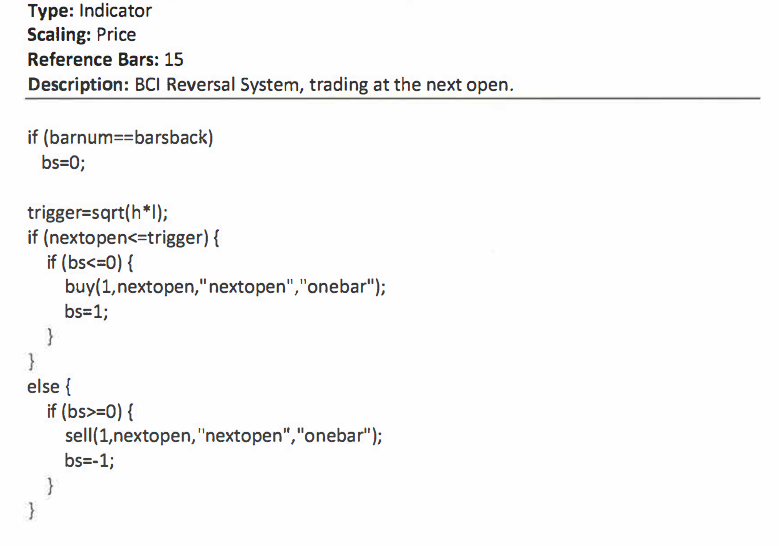
REM BCI MEAN REVERSION

BCI=0
for i = 0 to BarIndex
BCI= SQRT(high*low)
next

return BCI
BardParticipant
Master
Hi Bolsatrilera,
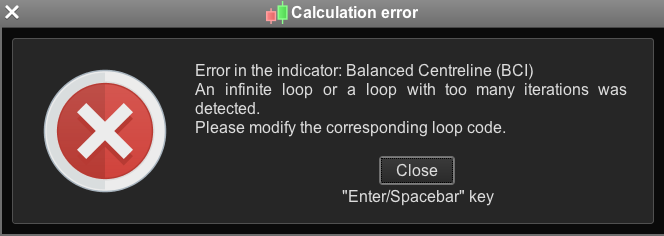
Thanks for the code. I got this warning when I loaded it on a Dow chart with 10,000 units: How many units were on your chart?
Cheers
Always interesting how some people do new things with old things …
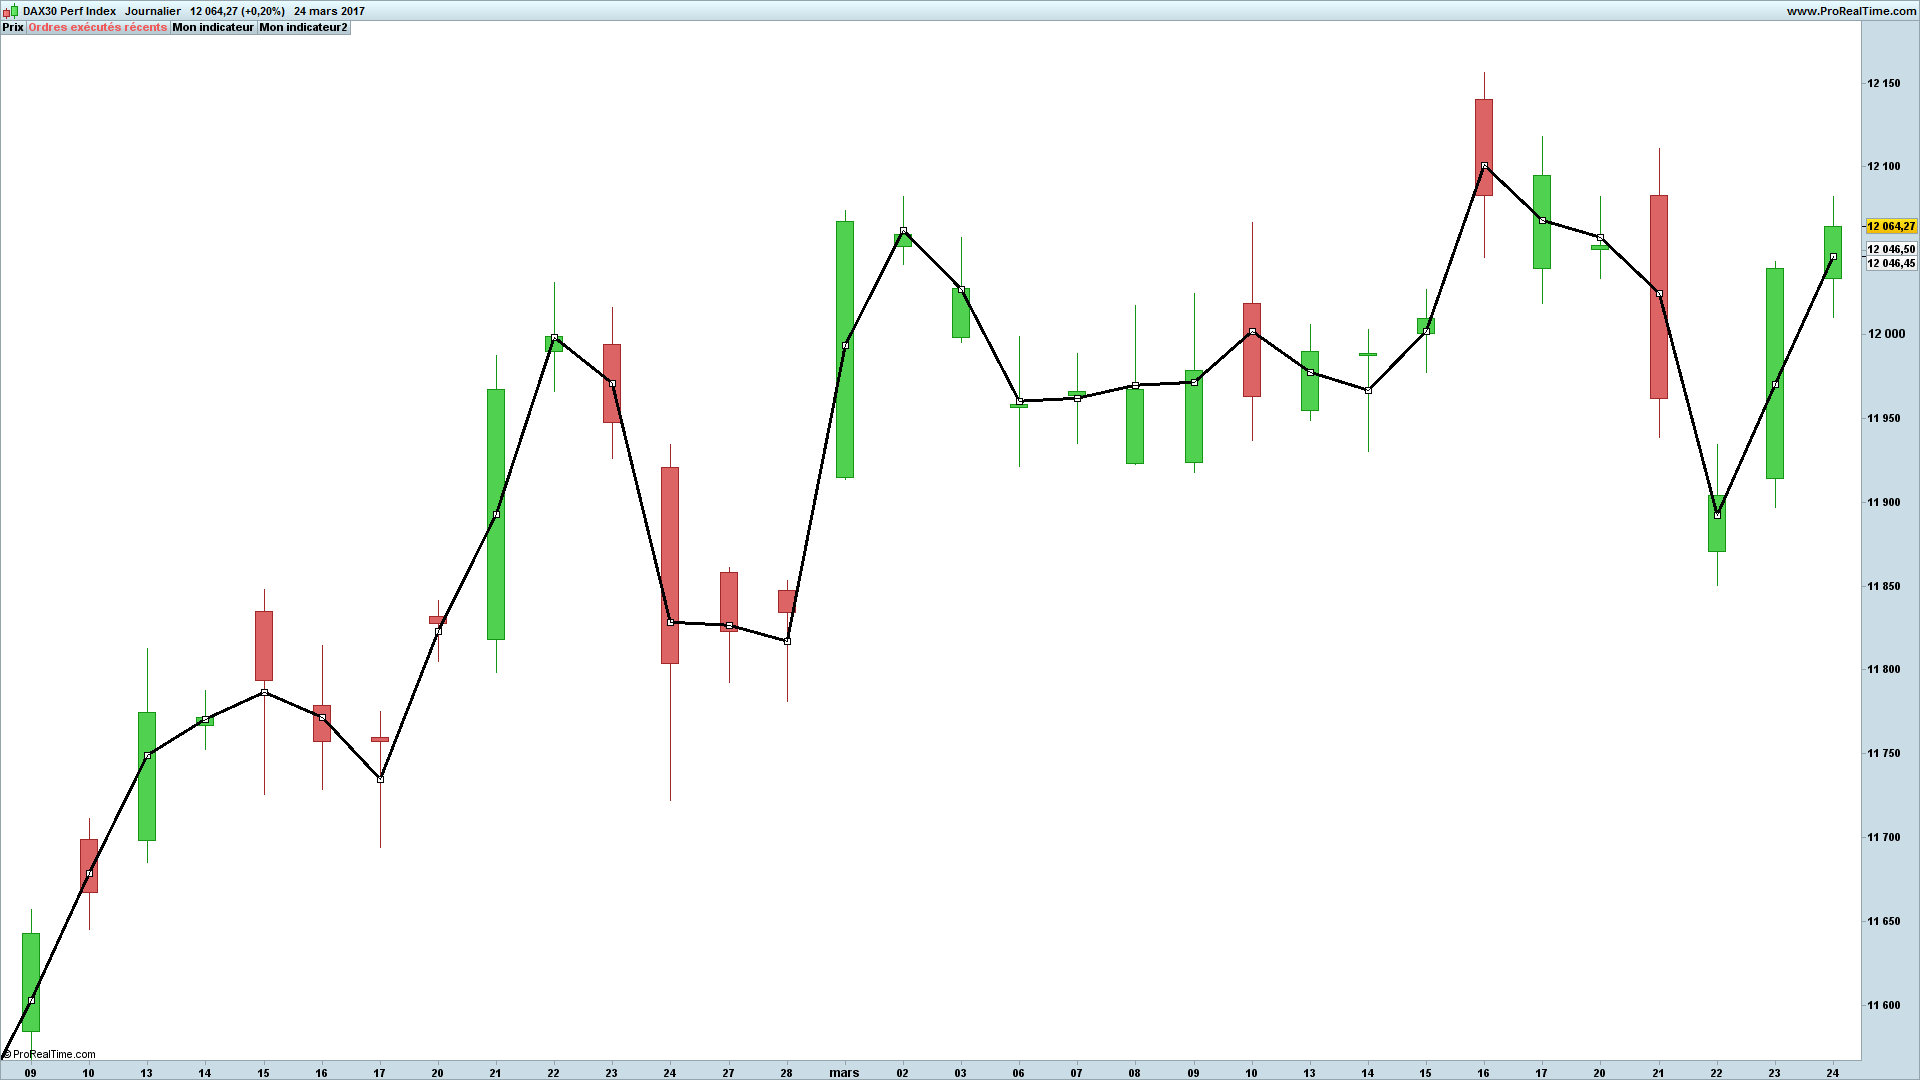
BCI is just equivalent to the median price as you see on the picture = exact the same curve
Go directly in the trash…
Thanks Bard
ind=SQRT(high*low)

return ind,medianprice
@zilliq
Again an impolitic and disrespectful useless intervention and I will be forced to moderate your remarks. Please respect the comments and ideas of each one. This forum is a place of exchange, discussion and assistance, open to all and all questions and ideas are welcome.
BardParticipant
Master
@zilliq: The next time you refer to me as “some people” Nicolas might need to moderate my comments, lol.
Best take it up with Earik Beann – the guy that owns the successful Wave59 platform, built winning trading systems and who’s S&P results I posted above.
Sorry bard there is misunderstanding, it wasn’t against you… You just give an information
It was against all People on the net, who rename something who already exist for different reasons (money, popularity…)
I quit mt4 notably for this reason. And it exist since many many years for example the stochastic is the same thing as the %r of Williams and so on
Have a nice day
Zilliq
I’m used to say that everything has already been discovered. Funny things is that sometimes when I do research and coding ideas, I recode without realizing the indicators that already exist under a different name.
@zilliq, This kind of misunderstanding can be easily avoided with a simple smiley 🙂 that’s why I use them very often, the messages always go much better with a smile!
Have a nice Sunday everyone.
 Pere
PereParticipant
Veteran
Hi. Thanks to all of you for sharing your knowledge again.
It seems a nice indicator to study.
I want to test it with Probacktest, but the one that I built doesn’t give me any result. I wrote it without the for-next condition, because I don’t understand the need of it (sorry). Shall I write it here (as I do), or better in the Probacktest-Proorder forum?
// Definición de los parámetros del código
DEFPARAM CumulateOrders = False // Acumulación de posiciones desactivada

REM BCI MEAN REVERSION

BCI= SQRT(high*low)

sl=50
// Condiciones para entrada de posiciones largas
IF Time=080000 AND open<BCI THEN
BUY 1 CONTRACT AT MARKET
ENDIF

// Condiciones de salida de posiciones largas
IF Time=210000 THEN
SELL  AT MARKET
ENDIF

// Condiciones de entrada de posiciones cortas
IF Time=080000 AND open>BCI THEN
SELLSHORT 1 CONTRACT AT MARKET
ENDIF

// Condiciones de salida de posiciones cortas
IF Time=210000 THEN
EXITSHORT  AT MARKET
ENDIF

// Stops y objetivos
SET STOP pLOSS sl
The BCI is calculated from daily timeframe OHLC if I’m right. So for the schedules to be met in your strategy you must launch it in an intraday timeframe and use Dhigh*Dlow instead for the BCI formula.
I changed the code provided by Petrus and trie to be as nearest possible to the rules Bard has posted, but the results are bad. Are there any other rules Bard?
DEFPARAM CumulateOrders = False

REM BCI MEAN REVERSION
BCI= SQRT(dhigh(0)*dlow(0))

IF dopen(0)<BCI THEN
BUY 1 CONTRACT AT MARKET
ENDIF

IF dopen(0)>BCI THEN
SELLSHORT 1 CONTRACT AT MARKET
ENDIF

graph dopen(0)
graph bci
Also looks like LinearRegression line period 1.
BardParticipant
Master
Hi Nicolas,
Actually, no. Earik Beann quotes: “And that’s the entire system!” It’s on p86 of the book I sent you, you did finally get it, right? The code is in this screenshot below from the appendix on p272. The code is effectively a linear regression as @robdav pointed out.
@Zilliq, No worries, have a great day.
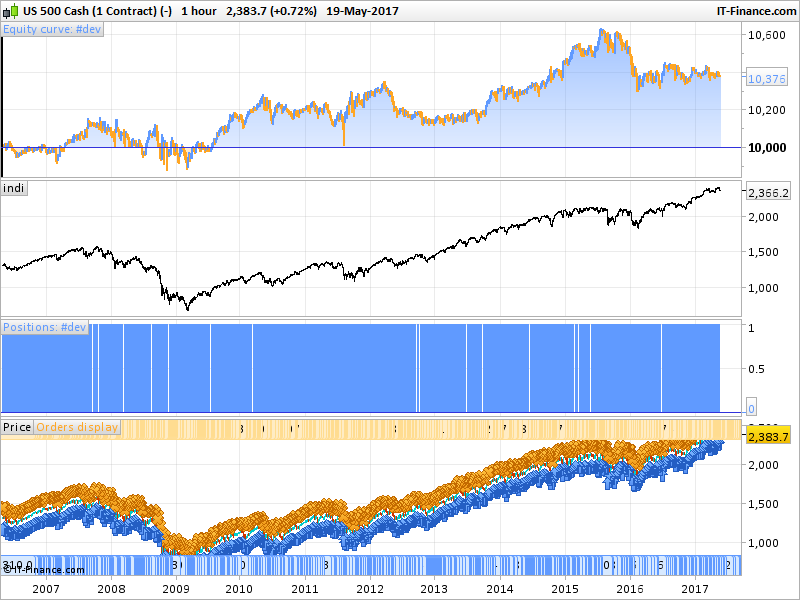
This version is a modified one that respect the rules. Because the code is only read once per bar at Close, the strategy has been adapted to an intraday timeframe where a trade could be initiated next after the daily open. So please test it on 5 minutes bars or a 1 hour one like in the attached example.
DEFPARAM CumulateOrders = False

REM BCI MEAN REVERSION
BCI= SQRT(dhigh(0)*dlow(0))

if intradaybarindex=0 then
indi=bci
endif

IF dopen(0)<indi THEN
BUY 1 CONTRACT AT MARKET
ENDIF

IF dopen(0)>indi THEN
SELL AT MARKET
ENDIF

graph indi
BardParticipant
Master
Appreciated Nicolas,
I am not sure how Beann got these results in the screenshots above. I also set it to the same date range and tried (x) 23 Hour timeframe with little similarity to the high accuracy and gain/loss ratios he achieved.
It immediately occurred to me that instead of fading the buy/sell signals (reversing), the logical thing to do is use a longer period for the high and low.
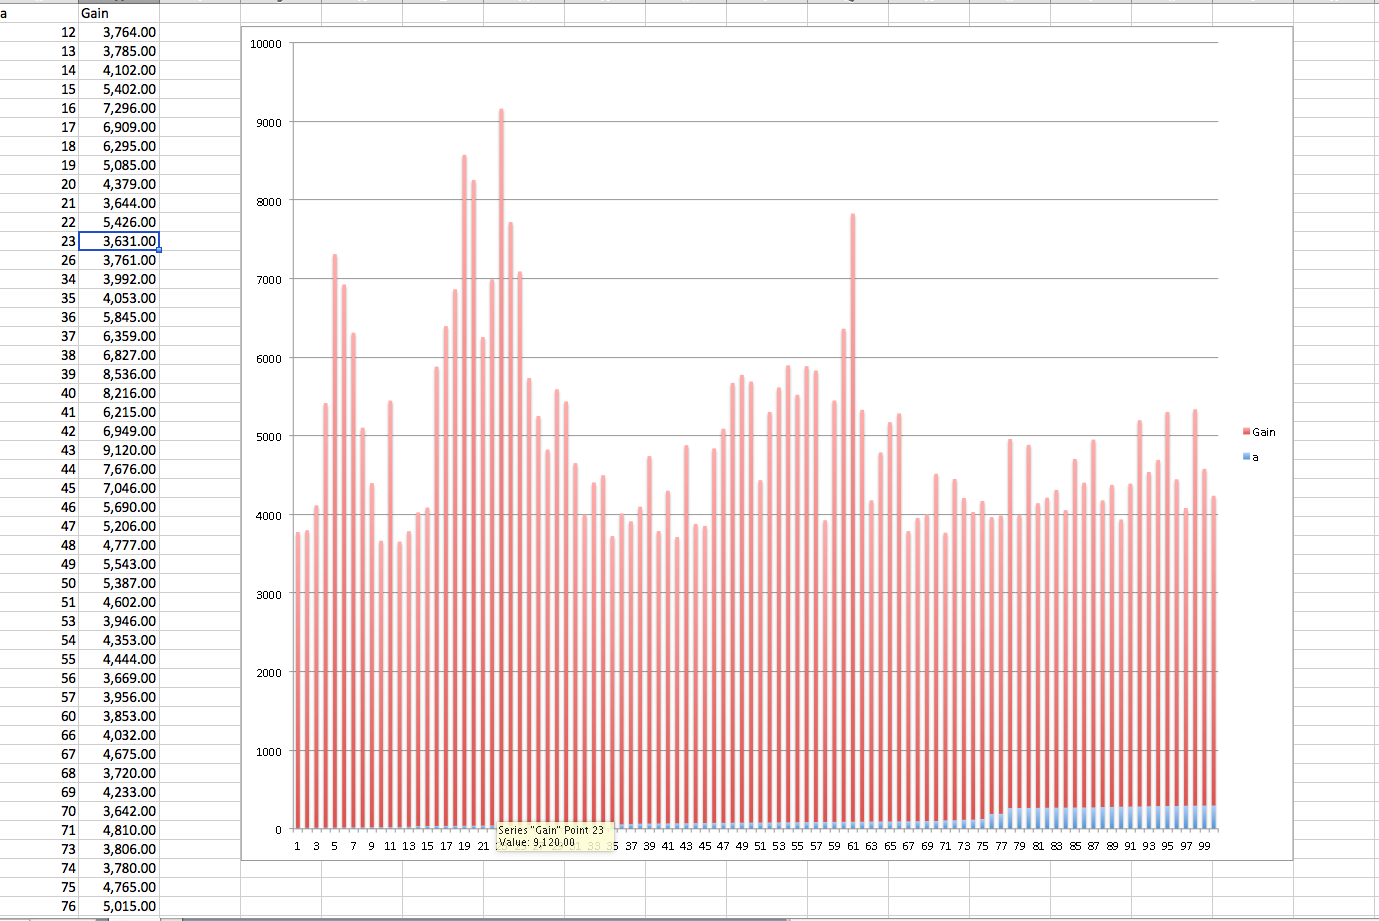
Excel question for anyone experienced with charts:
Optimising the gain versus the period of the high/low in PRT produces a fairly stable range results (albeit with a few gain spikes) “according” to the Excel chart (I’m looking forward to PRT incorporating a Fitness Function feature into the platform) yet the chart doesn’t seem to reflect the reality of what has happened with the period optimisation versus the gain. E.g I noticed (see screenshot) the 23 period shows a £3.631 gain and yet the graph does not – ditto with the £9,120 at 43 days. I ordered the “a” column (optimised period for high/low) from high to low (like usual with no problems before when doing this) and then highlighted it and also the gain column and then went to (Excel) charts and used “Clustered Column.”
Any ideas?
Cheers
Bard