Codifica “Super Indicator v1” da TradingView

Viewing 8 posts - 1 through 8 (of 8 total)
  • Author
    Posts
  • #147146 quote
    Edisone
    Participant
    Average

    Buongiorno, come da titolo ho necessità di convertire se possibile l’indicatore “Super Indicator v1” di RafaelZioni dal codice di TradingView.
    Segue il codice TradingView.
    Grazie per l’aiuto.

    //@version=4
    
    study("Super Indicator v1",overlay=true)
    
    hilow = ((high - low)*100)
    openclose = ((close - open)*100)
    vol1 = (volume / hilow)
    spreadvol = (openclose * vol1)
    VPT = spreadvol + cum(spreadvol)
    window_len = 28
    
    v_len = 14
    price_spread = stdev(high-low, window_len)
    
    vp = spreadvol + cum(spreadvol)
    smooth = sma(vp, v_len)
    v_spread = stdev(vp - smooth, window_len)
    shadow = (vp - smooth) / v_spread * price_spread
    
    out1 = shadow > 0 ? high + shadow : low + shadow
    
    //plot(out, style=line,linewidth=3, color=color)
    len=5
    vpt=ema(out1,len)
    
    // INPUTS //
    st_mult =1
    st_period = 10
    
    // CALCULATIONS //
    up_lev = vpt - (st_mult * atr(st_period))
    dn_lev = vpt + (st_mult * atr(st_period))
    
    up_trend = 0.0
    up_trend := close[1] > up_trend[1] ? max(up_lev, up_trend[1]) : up_lev
    
    down_trend = 0.0
    down_trend := close[1] < down_trend[1] ? min(dn_lev, down_trend[1]) : dn_lev
    
    // Calculate trend var
    trend10 = 0
    trend10 := close > down_trend[1] ? 1: close < up_trend[1] ? -1 : nz(trend10[1], 1)
    
    // Calculate SuperTrend Line
    st_line = trend10 ==1 ? up_trend : down_trend
    
    //
    src = input(close, title="Source")
    //sma
    sma20 = sma(src, 20)
    smapoint = 0
    smapoint := src > sma20 ? smapoint + 3 : smapoint - 3
    
    //AO
    ao = sma(hl2,5) - sma(hl2,34)
    aopoint = ao > 0 ? 3 : ao < 0 ? -3 : 0
    //momentum
    mom = src - src[14]
    mompoint = mom > 0 ? 3 : mom < 0 ? -3 : 0
    //MACD
    fast_ma = ema(src, 12)
    slow_ma = ema(src, 26)
    macd = fast_ma - slow_ma
    signal = ema(macd, 9)
    hist = macd - signal
    histpoint = hist > hist[1] ? 3 : -3
    
    //Bull bear
    Length = 30
    r1=iff(close[1]<open,max(open-close[1],high-low),high-low)
    r2=iff(close[1]>open,max(close[1]-open,high-low),high-low)
    bull=iff(close==open,iff(high-close==close-low,iff(close[1]>open,max(high-open,close-low),r1),iff(high-close>close-low,iff(close[1]<open, max(high-close[1],close-low), high-open),r1)),iff(close<open,iff(close[1]<open,max(high-close[1],close-low), max(high-open,close-low)),r1))
    bear=iff(close==open,iff(high-close==close-low,iff(close[1]<open,max(open-low,high-close),r2),iff(high-close>close-low,r2,iff(close[1]>open,max(close[1]-low,high-close), open-low))),iff(close<open,r2,iff(close[1]>open,max(close[1]-low,high-close),max(open-low,high-close))))
    colors=iff(sma(bull-bear,Length)>0, color.green, color.red)
    // barcolor(colors)
    bbpoint = sma(bull-bear,Length)>0 ? 3 : -3
    //UO
    length7 = 7,
    length14 = 14,
    length28 = 28
    average(bp, tr_, length) => sum(bp, length) / sum(tr_, length)
    high_ = max(high, src[1])
    low_ = min(low, src[1])
    bp = src - low_
    tr_ = high_ - low_
    avg7 = average(bp, tr_, length7)
    avg14 = average(bp, tr_, length14)
    avg28 = average(bp, tr_, length28)
    uoout = 100 * (4*avg7 + 2*avg14 + avg28)/7
    uopoint = uoout > 70 ? 3 : uoout < 30 ? -3 : 0
    //IC
    conversionPeriods = 9
    basePeriods = 26
    laggingSpan2Periods = 52
    displacement = 26
    donchian(len) => avg(lowest(len), highest(len))
    baseLine = donchian(basePeriods)
    icpoint = src > baseLine ? 3 : -3
    
    //HMA
    hullma = wma(2*wma(src, 9/2)-wma(src, 21), round(sqrt(21)))
    hmapoint = src > hullma ? 3 : -3
    //
    //
    trendDetectionLength =4
    float trend = na
    float wave = na
    float vol = na
    mov = close>close[1] ? 1 : close<close[1] ? -1 : 0
    trend := (mov != 0) and (mov != mov[1]) ? mov : nz(trend[1])
    isTrending = rising(close, trendDetectionLength) or falling(close, trendDetectionLength)
    wave := (trend != nz(wave[1])) and isTrending ? trend : nz(wave[1])
    vol := wave == wave[1] ? (nz(vol[1])+volume) : volume
    up1 = wave == 1 ? vol : 0
    dn1 = wave == 1 ? 0 : vol
    Weis= up1 > dn1 ? 3 : -3
    
    //
    
    roclen =20
    ccilen =21
    dilen = 5
    dirmov(len) =>
    up = change(high)
    down = -change(low)
    truerange = rma(tr, len)
    plus = fixnan(100 * rma(up > down and up > 0 ? up : 0, len) / truerange)
    minus = fixnan(100 * rma(down > up and down > 0 ? down : 0, len) / truerange)
    [plus, minus]
    
    TD = 0
    TS = 0
    TD := close > close[4] ? nz(TD[1]) + 1 : 0
    TS := close < close[4] ? nz(TS[1]) + 1 : 0
    TDUp = TD - valuewhen(TD < TD[1], TD , 1 )
    TDDn = TS - valuewhen(TS < TS[1], TS , 1 )
    td = TDUp > 0 ? 3 : TDDn > 0 ? -3 : 0
    roc = roc(close, roclen)
    Roc=roc > 0 ? 3 : -3
    cci = cci(close, ccilen)
    CCI=cci > 0? 3 : -3
    [plus, minus] = dirmov(dilen)
    dmi = plus - minus
    DMI= dmi >= 0? 3 : -3
    //
    STT=trend10 == 1 ? 3 : -3
    //
    periods = 2
    smooth1 = 14
    price = close
    fn(src, length) =>
    MA_s= 0.0
    MA_s:=(src + nz(MA_s[1] * (length-1)))/length
    MA_s
    r11 = ema( price, periods )
    r22 = iff( price > r11, price - r11, 0 )
    r3 = iff( price < r11, r11 - price, 0 )
    r4 = fn( r22, smooth1 )
    r5 = fn( r3, smooth1 )
    rr = iff( r5 == 0, 100, 100 - ( 100 / ( 1 + ( r4 / r5 ) ) ) )
    
    length = 20,fast = 7,slow = 13
    //
    src10 = rr
    er = abs(change(src,length))/sum(abs(change(src10)),length)
    dev = er*stdev(src10*2,fast) + (1-er)*stdev(src10*2,slow)
    a = 0.
    a := bar_index < 9 ? src10 : src10 > a[1] + dev ? src10 : src10 < a[1] - dev ? src10 : a[1]
    //
    
    rsi=fixnan(a > a[1] ? 3 : a < a[1] ?-3 : na)
    //
    totalpoints =rsi+td+STT+Roc+DMI+ CCI+Weis+smapoint + aopoint + mompoint + histpoint + bbpoint + icpoint + hmapoint
    //
    min =input(120,title = 'candle time')
    len10 = timeframe.isintraday and timeframe.multiplier >= 1 ?
    min / timeframe.multiplier * 7 :
    timeframe.isintraday and timeframe.multiplier < 60 ?
    60 / timeframe.multiplier * 24 * 7 : 7
    piz=1
    tt=sma(totalpoints,len10)
    p=ema(tt,piz)
    //
    f=(tt[1]+p[1])
    
    len100 = timeframe.isintraday and timeframe.multiplier >= 1 ?
    min / timeframe.multiplier * 7 :
    timeframe.isintraday and timeframe.multiplier < 60 ?
    60 / timeframe.multiplier * 24 * 7 : 7
    x=ema(f,len100)
    signalen=9
    signal2 = ema(x,signalen)
    // Plotting:
    barColor =x >= 0 and x > signal2 ? color.teal : x > 0 and x < signal2 ? color.lime : x < 0 and x < signal2 ? color.red : color.orange
    
    bgcolor(barColor == color.teal or barColor == color.lime ? color.green : color.red)
    
    // vrsi
    
    leng = 14
    overSold =35
    overBought = 65
    
    vrsi = rsi(close, leng)
    
    var bool long = na
    var bool short = na
    
    long :=crossover(vrsi,overSold)
    short := crossunder(vrsi,overBought)
    
    var float last_open_long = na
    var float last_open_short = na
    
    last_open_long := long ? close : nz(last_open_long[1])
    last_open_short := short ? close : nz(last_open_short[1])
    
    entry_value =last_open_long
    entry_value1=last_open_short
    
    plot(entry_value,color=color.red,linewidth=2)
    plot(entry_value1,color=color.blue,linewidth=2)
    
    buy=x>0 and crossover(x,0)
    //
    
    sell= crossunder(x,0)
    
    plotshape(buy, title="buy", text="Buy", color=color.green, style=shape.labelup, location=location.belowbar, size=size.small, textcolor=color.white, transp=0) //plot for buy icon
    plotshape(sell, title="sell", text="Sell", color=color.red, style=shape.labeldown, location=location.abovebar, size=size.small, textcolor=color.white, transp=0) //plot for sell icon
    /////// Alerts /////
    alertcondition(buy,title="buy")
    alertcondition(sell,title="sell")
    #147149 quote
    robertogozzi
    Moderator
    Master

    Usa sempre il pulsante “Insert PRT code” quando inserisci il codice nei tuoi post per facilitare la lettura degli altri.

    Grazie 🙂

    #147151 quote
    Nicolas
    Keymaster
    Master

    Descrivi l'indicatore e aggiungi immagini.

    #147186 quote
    Edisone
    Participant
    Average

    Questo indicatore si basa su 14 diversi indicatori, tutti ben noti ..
    ogni indicatore ha il suo valore, per macd e rsi ho impostato un valore leggermente superiore rispetto agli altri
    la combinazione dei valori crea questo indicatore o super indicatore
    Ho messo un’opzione liscia = piz in modo da poter trovare la lunghezza più adatta alle tue esigenze
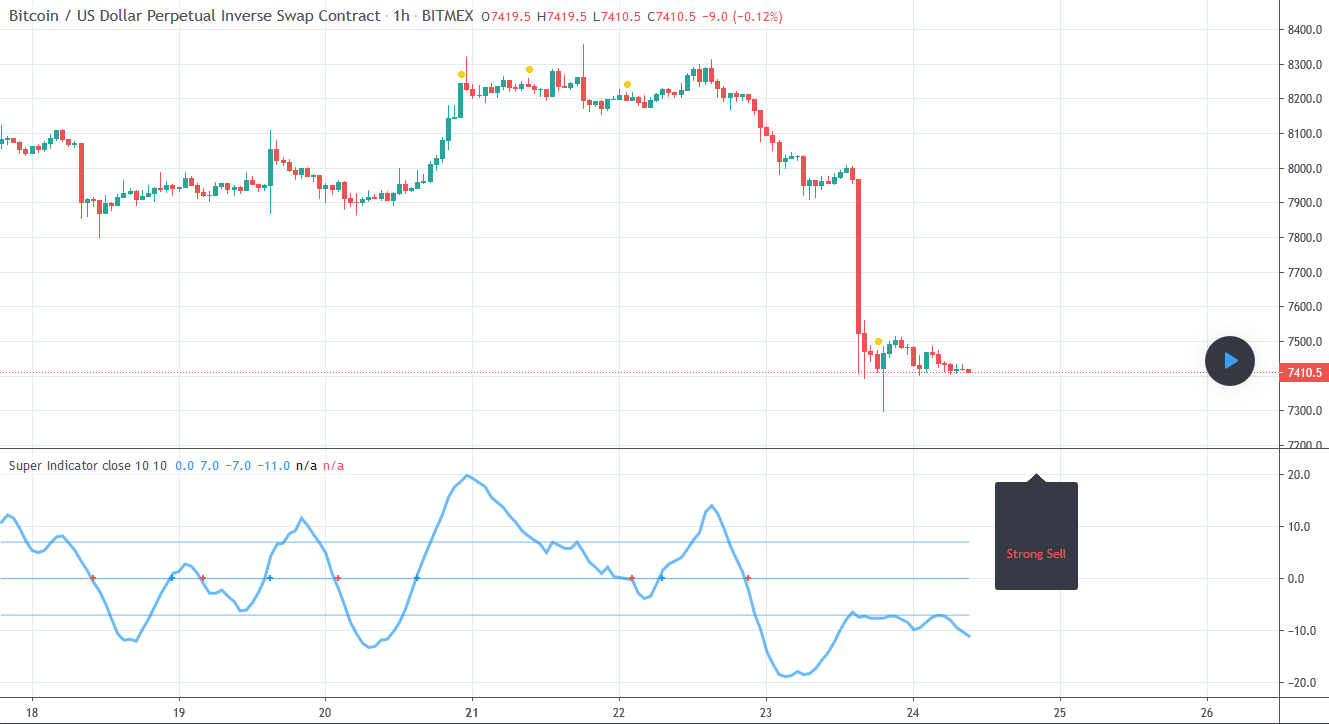
    Nel pannello informativo: sopra 0 = acquisto, sopra 7 = acquisto forte, sotto 0 = vendita, sotto 7 = forte vendita
    L’incrocio dello zero è mostrato nel grafico con una croce blu per Buy, cerchio rosso per Sell
    quindi è un sistema di alimentazione basato su 14 indicatori indipendenti. ciascuno calcola un andamento diverso e con una velocità diversa. Combinati otteniamo la media di essi perché possiamo dare più potere a quelli più importanti su cui possiamo aggiustare il sistema in modi diversi
    Non ho messo avviso ma è facile da configurare
    Ho impostato piz a 1, nell’esempio è impostato a 10, quindi puoi inserire la lunghezza che ritieni sia la migliore per questo sistema per funzionare.
    Aggiunto avvisi per incrociare lo zero = acquista
    crossdown zero = vendere
    incrociare 7 = acquisto forte
    crossdown -7 = forte vendita
    si può anche aggiungere alert per cross down e up di 7 o -7 in direzione opposta

    //@version=4
    
    study("Super Indicator",overlay=false)
    
    
    hilow = ((high - low)*100)
    openclose = ((close - open)*100)
    vol1 = (volume / hilow)
    spreadvol = (openclose * vol1)
    VPT = spreadvol + cum(spreadvol)
    window_len = 28
    
    v_len = 14
    price_spread = stdev(high-low, window_len)
    
    vp =  spreadvol + cum(spreadvol)
    smooth = sma(vp, v_len)
    v_spread = stdev(vp - smooth, window_len)
    shadow = (vp - smooth) / v_spread * price_spread
    
    out1 = shadow > 0 ? high + shadow : low + shadow
    
    //plot(out, style=line,linewidth=3, color=color)
    len=5
    vpt=ema(out1,len)
    
    
    // INPUTS //
    st_mult   =3
    st_period = 7
    
    // CALCULATIONS //
    up_lev = vpt - (st_mult * atr(st_period))
    dn_lev = vpt + (st_mult * atr(st_period))
    
    up_trend   = 0.0
    up_trend   := close[1] > up_trend[1]   ? max(up_lev, up_trend[1])   : up_lev
    
    down_trend = 0.0
    down_trend := close[1] < down_trend[1] ? min(dn_lev, down_trend[1]) : dn_lev
    
    // Calculate trend var
    trend10 = 0
    trend10 := close > down_trend[1] ? 1: close < up_trend[1] ? -1 : nz(trend10[1], 1)
    
    // Calculate SuperTrend Line
    st_line = trend10 ==1 ? up_trend : down_trend
    
    //
    src = input(close, title="Source")
    //sma
    sma20 = sma(src, 20)
    smapoint = 0
    smapoint := src > sma20 ? smapoint + 1 : smapoint - 1
    
    
    //AO
    ao = sma(hl2,5) - sma(hl2,34)
    aopoint = ao > 0 ? 1 : ao < 0 ? -1 : 0
    //momentum
    mom = src - src[14]
    mompoint = mom > 0 ? 1 : mom < 0 ? -1 : 0
    //MACD
    fast_ma = ema(src, 12)
    slow_ma = ema(src, 26)
    macd = fast_ma - slow_ma
    signal = ema(macd, 9)
    hist = macd - signal
    histpoint = hist > hist[1] ? 3 : -3
    
    //Bull bear
    Length = 30
    r1=iff(close[1]<open,max(open-close[1],high-low),high-low)
    r2=iff(close[1]>open,max(close[1]-open,high-low),high-low)
    bull=iff(close==open,iff(high-close==close-low,iff(close[1]>open,max(high-open,close-low),r1),iff(high-close>close-low,iff(close[1]<open, max(high-close[1],close-low), high-open),r1)),iff(close<open,iff(close[1]<open,max(high-close[1],close-low), max(high-open,close-low)),r1))
    bear=iff(close==open,iff(high-close==close-low,iff(close[1]<open,max(open-low,high-close),r2),iff(high-close>close-low,r2,iff(close[1]>open,max(close[1]-low,high-close), open-low))),iff(close<open,r2,iff(close[1]>open,max(close[1]-low,high-close),max(open-low,high-close))))
    colors=iff(sma(bull-bear,Length)>0, color.green, color.red)
    // barcolor(colors)
    bbpoint = sma(bull-bear,Length)>0 ? 1 : -1
    //UO
    length7 = 7,
    length14 = 14,
    length28 = 28
    average(bp, tr_, length) => sum(bp, length) / sum(tr_, length)
    high_ = max(high, src[1])
    low_ = min(low, src[1])
    bp = src - low_
    tr_ = high_ - low_
    avg7 = average(bp, tr_, length7)
    avg14 = average(bp, tr_, length14)
    avg28 = average(bp, tr_, length28)
    uoout = 100 * (4*avg7 + 2*avg14 + avg28)/7
    uopoint = uoout > 70 ? 1 : uoout < 30 ? -1 : 0
    //IC
    conversionPeriods = 9
    basePeriods = 26
    laggingSpan2Periods = 52
    displacement = 26
    donchian(len) => avg(lowest(len), highest(len))
    baseLine = donchian(basePeriods)
    icpoint = src > baseLine ? 1 : -1
    
    //HMA
    hullma = wma(2*wma(src, 9/2)-wma(src, 21), round(sqrt(21)))
    hmapoint = src > hullma ? 2 : -2
    //
    //
    trendDetectionLength =4
    float trend = na
    float wave = na
    float vol = na
    mov = close>close[1] ? 1 : close<close[1] ? -1 : 0
    trend := (mov != 0) and (mov != mov[1]) ? mov : nz(trend[1])
    isTrending = rising(close, trendDetectionLength) or falling(close, trendDetectionLength)
    wave := (trend != nz(wave[1])) and isTrending ? trend : nz(wave[1])
    vol := wave == wave[1] ? (nz(vol[1])+volume) : volume
    up1 = wave == 1 ? vol : 0
    dn1 = wave == 1 ? 0 : vol
    Weis= up1 > dn1 ? 2 : -2
    
    
    //
    
    roclen =20
    ccilen =21
    dilen = 5
    dirmov(len) =>
    	up = change(high)
    	down = -change(low)
    	truerange = rma(tr, len)
    	plus = fixnan(100 * rma(up > down and up > 0 ? up : 0, len) / truerange)
    	minus = fixnan(100 * rma(down > up and down > 0 ? down : 0, len) / truerange)
    	[plus, minus]
    
    f_draw_infopanel(_x, _y, _line, _text, _color)=>
        _rep_text = ""
        for _l = 0 to _line
            _rep_text := _rep_text + "\n"
        _rep_text := _rep_text + _text
        var label _la = na
        label.delete(_la)
        _la := label.new(
             x=_x, y=_y, 
             text=_rep_text, xloc=xloc.bar_time, yloc=yloc.price, 
             color=color.black, style=label.style_labelup, textcolor=_color, size=size.normal)
    
    TD = 0
    TS = 0
    TD := close > close[4] ? nz(TD[1]) + 1 : 0
    TS := close < close[4] ? nz(TS[1]) + 1 : 0
    TDUp = TD - valuewhen(TD < TD[1], TD , 1 )
    TDDn = TS - valuewhen(TS < TS[1], TS , 1 )
    td = TDUp > 0 ? 2 : TDDn > 0 ? -2 : 0
    roc = roc(close, roclen)
    Roc=roc > 0 ? 1 : -1
    cci = cci(close, ccilen)
    CCI=cci > 0? 2 : -2
    [plus, minus] = dirmov(dilen)
    dmi = plus - minus
    DMI= dmi >= 0? 2 : -2
    //
    STT=trend10 == 1 ? 1 : -1
    //
    periods = 2
    smooth1 =  14
    price = close
    fn(src, length) => 
        MA_s= 0.0
        MA_s:=(src + nz(MA_s[1] * (length-1)))/length
        MA_s
    r11 = ema( price, periods ) 
    r22 = iff( price > r11, price - r11, 0 ) 
    r3 = iff( price < r11, r11 - price, 0 ) 
    r4 = fn( r22, smooth1 ) 
    r5 = fn( r3, smooth1 ) 
    rr = iff( r5 == 0, 100, 100 - ( 100 / ( 1 + ( r4 / r5 ) ) ) ) 
    
    length = 20,fast = 7,slow = 13
    //
    src10 = rr
    er = abs(change(src,length))/sum(abs(change(src10)),length)
    dev = er*stdev(src10*2,fast) + (1-er)*stdev(src10*2,slow)
    a = 0.
    a := bar_index < 9 ? src10 : src10 > a[1] + dev ? src10 : src10 < a[1] - dev ? src10 : a[1]
    //
    
    rsi=fixnan(a > a[1] ? 3 : a < a[1] ?-3 : na)
    //
    totalpoints =rsi+td+STT+Roc+DMI+ CCI+Weis+smapoint  + aopoint + mompoint + histpoint  + bbpoint  + icpoint  + hmapoint
    //
    piz=input(1)
    tt=sma(totalpoints,piz)
    plot(0)
    plot(7)
    plot(-7)
    plot(tt,linewidth=3)
    //
    
    zero=0
    down = crossunder(tt, 0) 
    up = crossover(tt, -0) 
    plot(up  ?zero :na, style=plot.style_cross, color=color.blue, linewidth=2, transp=0)
    plot(down ?zero :na, style=plot.style_cross, color=color.red, linewidth=2, transp=0)
    
    //Alerts
    /////// Alerts /////
    alertcondition(down,title="sell")
    alertcondition(up,title="buy")
    alertcondition(crossover(tt, 7),title="Strong Buy")
    alertcondition(crossunder(tt, -7),title="strong sell")
    
    //disp_panels = input(true, title="Display info panels?")
    //h=high
    //info_label_off1 = input(70, title="Info panel offset")
    //info_label_size = input(size.normal, options=[size.tiny, size.small, size.normal, size.large, size.huge], title="Info panel label size")
    //info_panel_x = timenow + round(change(time)*info_label_off1)
    //info_panel_y = h
    
    //info_title= "-=-=-=-=- Info Panel -=-=-=-=-"
    //info_div = "\n\n------------------------------"
    //info_current_close = "\n\Total points : " + tostring(totalpoints)
    
    //info_text =info_title+info_current_close
    //info_panel = disp_panels ? label.new(x=info_panel_x, y=info_panel_y, text=info_text, xloc=xloc.bar_time, yloc=yloc.price, color=color.yellow, style=label.style_labelup, textcolor=color.black, size=info_label_size) : na
    //label.delete(info_panel[1])
    
    //
    //
    info_label_off = input(10, title="Info panel offset")
    posx = timenow + round(change(time)*info_label_off)
    posy = 20
    
    
    f_draw_infopanel(posx, posy, 6, " Strong Buy",tt>7 ? color.green : color.black)
    f_draw_infopanel(posx, posy, 4, "Strong Sell", tt < -7 ? color.red : color.black)
    f_draw_infopanel(posx, posy, 2, "Buy",tt>=1 and tt<=7? color.lime : color.black)
    f_draw_infopanel(posx, posy, 0, "Sell", tt <= -1 and tt>=-7? color.orange : color.black)


    Screenshot_2020-10-12-Super-Indicator-by-RafaelZioni.png Screenshot_2020-10-12-Super-Indicator-by-RafaelZioni.png
    #147547 quote
    Edisone
    Participant
    Average

    E’ fattibile ?

    #147932 quote
    Edisone
    Participant
    Average

    Nessuno che mi aiuta nella codifica ?

    #147937 quote
    Nicolas
    Keymaster
    Master

    Sì, è possibile, lo aggiungo al mio elenco di conversione del codice. Per favore sii paziente.

    #147941 quote
    Edisone
    Participant
    Average

    Grazie mille

Viewing 8 posts - 1 through 8 (of 8 total)
  • You must be logged in to reply to this topic.

Codifica “Super Indicator v1” da TradingView


ProBuilder: Indicatori & Strumenti Personalizzati

New Reply
Author
author-avatar
Edisone @edisone Participant
Summary

This topic contains 7 replies,
has 3 voices, and was last updated by Edisone
5 years, 5 months ago.

Topic Details
Forum: ProBuilder: Indicatori & Strumenti Personalizzati
Language: Italian
Started: 10/12/2020
Status: Active
Attachments: 1 files
Logo Logo
Loading...