rama
ramaParticipant
Senior
I want to use this code for trading, the problem with this I need to monitor screen to see when the signal is generated
https://www.prorealcode.com/prorealtime-indicators/scalping-with-parabolic-sar-and-fibonacci/
I tried to added
on line 42 as k1=1
online 57 as k1=-1
online 74 return sarfast coloured(r,g,0) style(point,5),sarslow coloured(0,195,255) style(point,5),k1
I am not getting error or on the other hand I am not getting any signal either
This logic has excellent success ratio
It will just be drawing a line between -1 and 1 right at the bottom of the chart window so that is why you probably can’t see it. Remove all the graphical instructions and change the last line to RETURN k1 and then apply it as a separate indicator window and you will see it.
You may want to add a k1 = 0 at the start of the code unless you just want it to be 1 or -1.
ramaParticipant
Senior
removed the graphs but it not giving the signal as expected
//PRC_Scalping with Parabolic SAR and Fibonacci | indicator
//03.09.2019
//Nicolas @ www.prorealcode.com
//Sharing ProRealTime knowledge

// --- settings

// --- end of settings

sarfast=SAR[0.02,0.02,0.2]
sarslow=SAR[0.005,0.005,0.05]


//highs and lows
if close<sarfast then
ll=min(ll,low)
else
hh=max(hh,high)
endif

if close>sarfast and close[1]<sarfast[1]  then //new bullish signal

ll=sarslow //reset ll
if close>sarslow then
k1=-1
endif
endif
if close<sarfast and close[1]>sarfast[1] then //new bearish signal

hh=0 //reset hh
if  close<sarslow then
k1=1
endif
endif


return k1
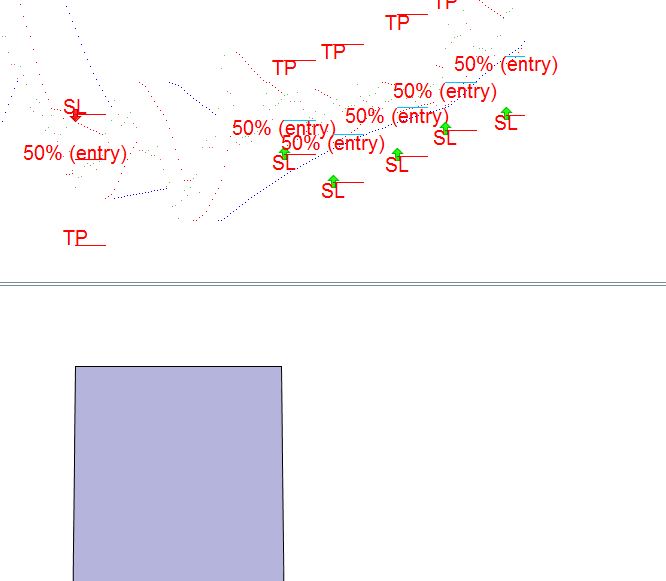
You haven’t really clearly explained what you expect it to do. Plus your image tells us nothing because most of the charts with the actual values is missing completely.
If you just want the return to be a spike at +1 or -1 then you have to set the k1 back to zero at the start of the code.
ramaParticipant
Senior
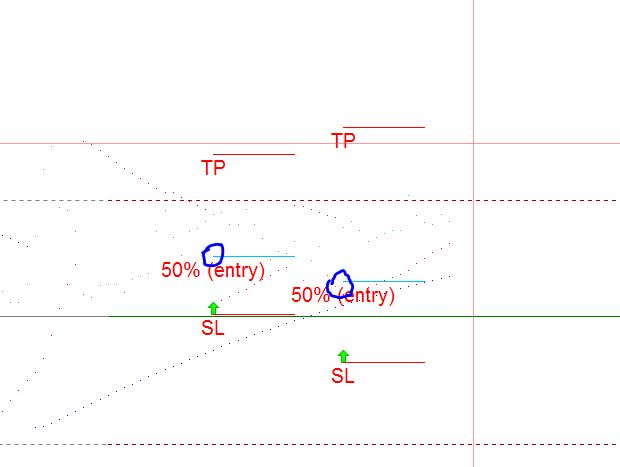
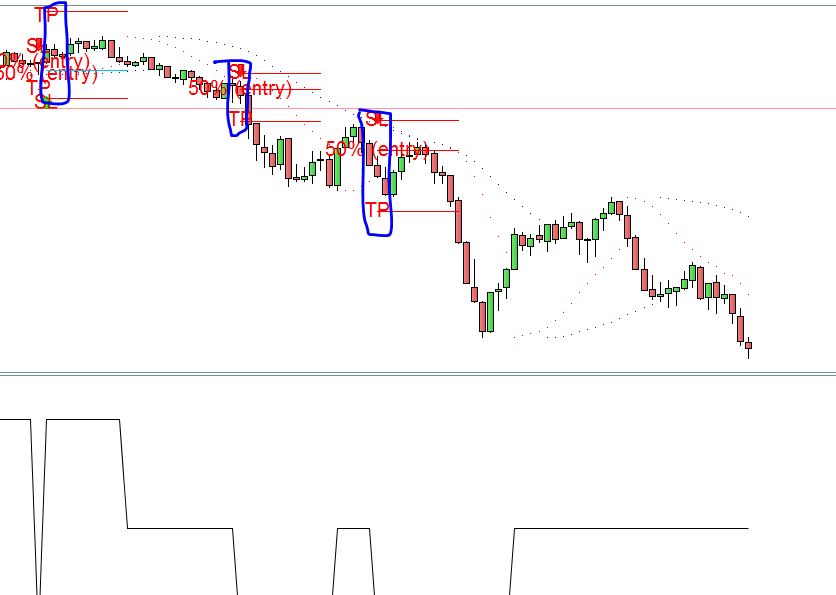
please find attached the screen shot marked in blue. original code gives the signal at the time of blue marks.
that signal is valid for some time may be 10 or 2o min
I want a spike at the time of signal generated . I will place an order by looking at alert.
if I can get entry , target and stop loss also i will good . I can write program
as
call the indicator and when k=1
buy at entry+x limit
sell at stop-x stop
sell at target-x limit
x= 1
You will need to have in your strategy keep placing pending orders at every bar anyway because they only last one bar – so you will need it to remain at +1 or -1 unless you are on market. To be honest you are best to code the indicator into your strategy. It will make it easier because you will need to switch the value to zero if a trade opens.
My platform is closed at the moment and I’m a bit busy with other stuff otherwise I would just write it for you!
I think that this should do what you want as a strategy. I kept the ‘plotbar’ setting in the code so it only places pending BUY or SELLSHORT orders on the market for this number of bars after a set up has been identified.
//PRC_Scalping with Parabolic SAR and Fibonacci strategy

// --- settings
plotbar=10 //bars duration for placing orders
// --- end of settings

sarfast=SAR[0.02,0.02,0.2]
sarslow=SAR[0.005,0.005,0.05]

//highs and lows
if close<sarfast then
ll=min(ll,low)
else
hh=max(hh,high)
endif

if close>sarfast and close[1]<sarfast[1]  then //new bullish signal
fibo0=ll
ll=sarslow //reset ll
if close>sarslow then
startbar=barindex
irange=high-fibo0
entry = fibo0+(irange/2)
itarget = fibo0+irange*1.618
istop = fibo0-2*pointsize
signal = 1
endif
endif
if close<sarfast and close[1]>sarfast[1] then //new bearish signal
fibo0=hh
hh=0 //reset hh
if  close<sarslow then
startbar=barindex
irange=fibo0-low
entry = fibo0-(irange/2)
itarget = fibo0-irange*1.618
istop = fibo0+2*pointsize
signal = -1
endif
endif

if barindex-startbar<=plotbar then
if not onmarket and close>sarslow and signal = 1 then //bullish trend
buy 1 contract at entry limit
sell at istop stop
sell at itarget limit
endif

if not onmarket and close<sarslow and signal = -1 then //bearish trend
sellshort 1 contract at entry limit
exitshort at istop stop
exitshort at itarget limit
endif
endif

if longonmarket then
signal = 0
sell at istop stop
sell at itarget limit
endif

if shortonmarket then
signal = 0
exitshort at istop stop
exitshort at itarget limit
endif

graph signal