Hi
I have two questions related to timeframes.
Thanks again.
Rob
TIMEFRAME statement is only available for ProScreener program. It should be used also for ProOrder, but in a future update.
About code to detect which timeframe is the current chart, you can use this one:
once NbBar = 1

//if BarIndex < NbBar+2 then
MyDay=openday
dayminutes = 1440*(MyDay-MyDay[1])
MyHour=openhour
hourminutes = 60*(MyHour-MyHour[1])
MyMin=openminute
barminutes = MyMin - MyMin[1] + hourminutes + dayminutes
barminutes=abs(barminutes)
Mybarminutes = lowest[NbBar](barminutes)[1]
//endif

return Mybarminutes as "Timeframe"
Hi Nicolas,
Thanks for this but I’m experiencing a problem with it. Is there a workaround you can think of? I have tried calling it using CALL but I still get the error when trying to create the Donchain channel.
Thanks again, Rob
once NbBar = 1

//if BarIndex < NbBar+2 then
MyDay=openday
dayminutes = 1440*(MyDay-MyDay[1])
MyHour=openhour
hourminutes = 60*(MyHour-MyHour[1])
MyMin=openminute
barminutes = MyMin - MyMin[1] + hourminutes + dayminutes
barminutes=abs(barminutes)
Mybarminutes = lowest[NbBar](barminutes)[1]
//endif

lower = lowest[Mybarminutes](low)
upper = highest[Mybarminutes](high)
middle = (upper + lower) / 2

return lower as "lower", upper as "upper", middle as "middle"
Sorry but I don’t understand what you are trying to do with this code?
Example: in an 1 hour timeframe, the code I gave you will return “60”. “240” in a 4 hours timeframe, etc.
I agree it’s a bit odd so I’ll try and explain.
If I add this indicator to a twenty minute chart, I was hoping it would detect that it’s a twenty minute chart and simply create a 20 period Donchian channel rather than having to set the period manually.
Try adding it and you’ll see the problem.
This code should work ok:
once NbBar = 2
MyDay=openday
dayminutes = 1440*(MyDay-MyDay[1])
MyHour=openhour
hourminutes = 60*(MyHour-MyHour[1])
MyMin=openminute
barminutes = MyMin - MyMin[1] + hourminutes + dayminutes
barminutes=abs(barminutes)
Mybarminutes = lowest[max(1,NbBar)](barminutes)[1]

if barindex>MyBarminutes then
lower = lowest[Mybarminutes](low)
upper = highest[Mybarminutes](high)
middle = (upper + lower) / 2
endif

return lower as "lower", upper as "upper", middle as "middle", mybarminutes
Still don’t have understood the relationship between how much minutes in a single bar and the period of the donchian channel ❓
Works perfectly, thanks again.
Hi Nicolas (I write in English since this topic belongs to the englishspeaking forum)
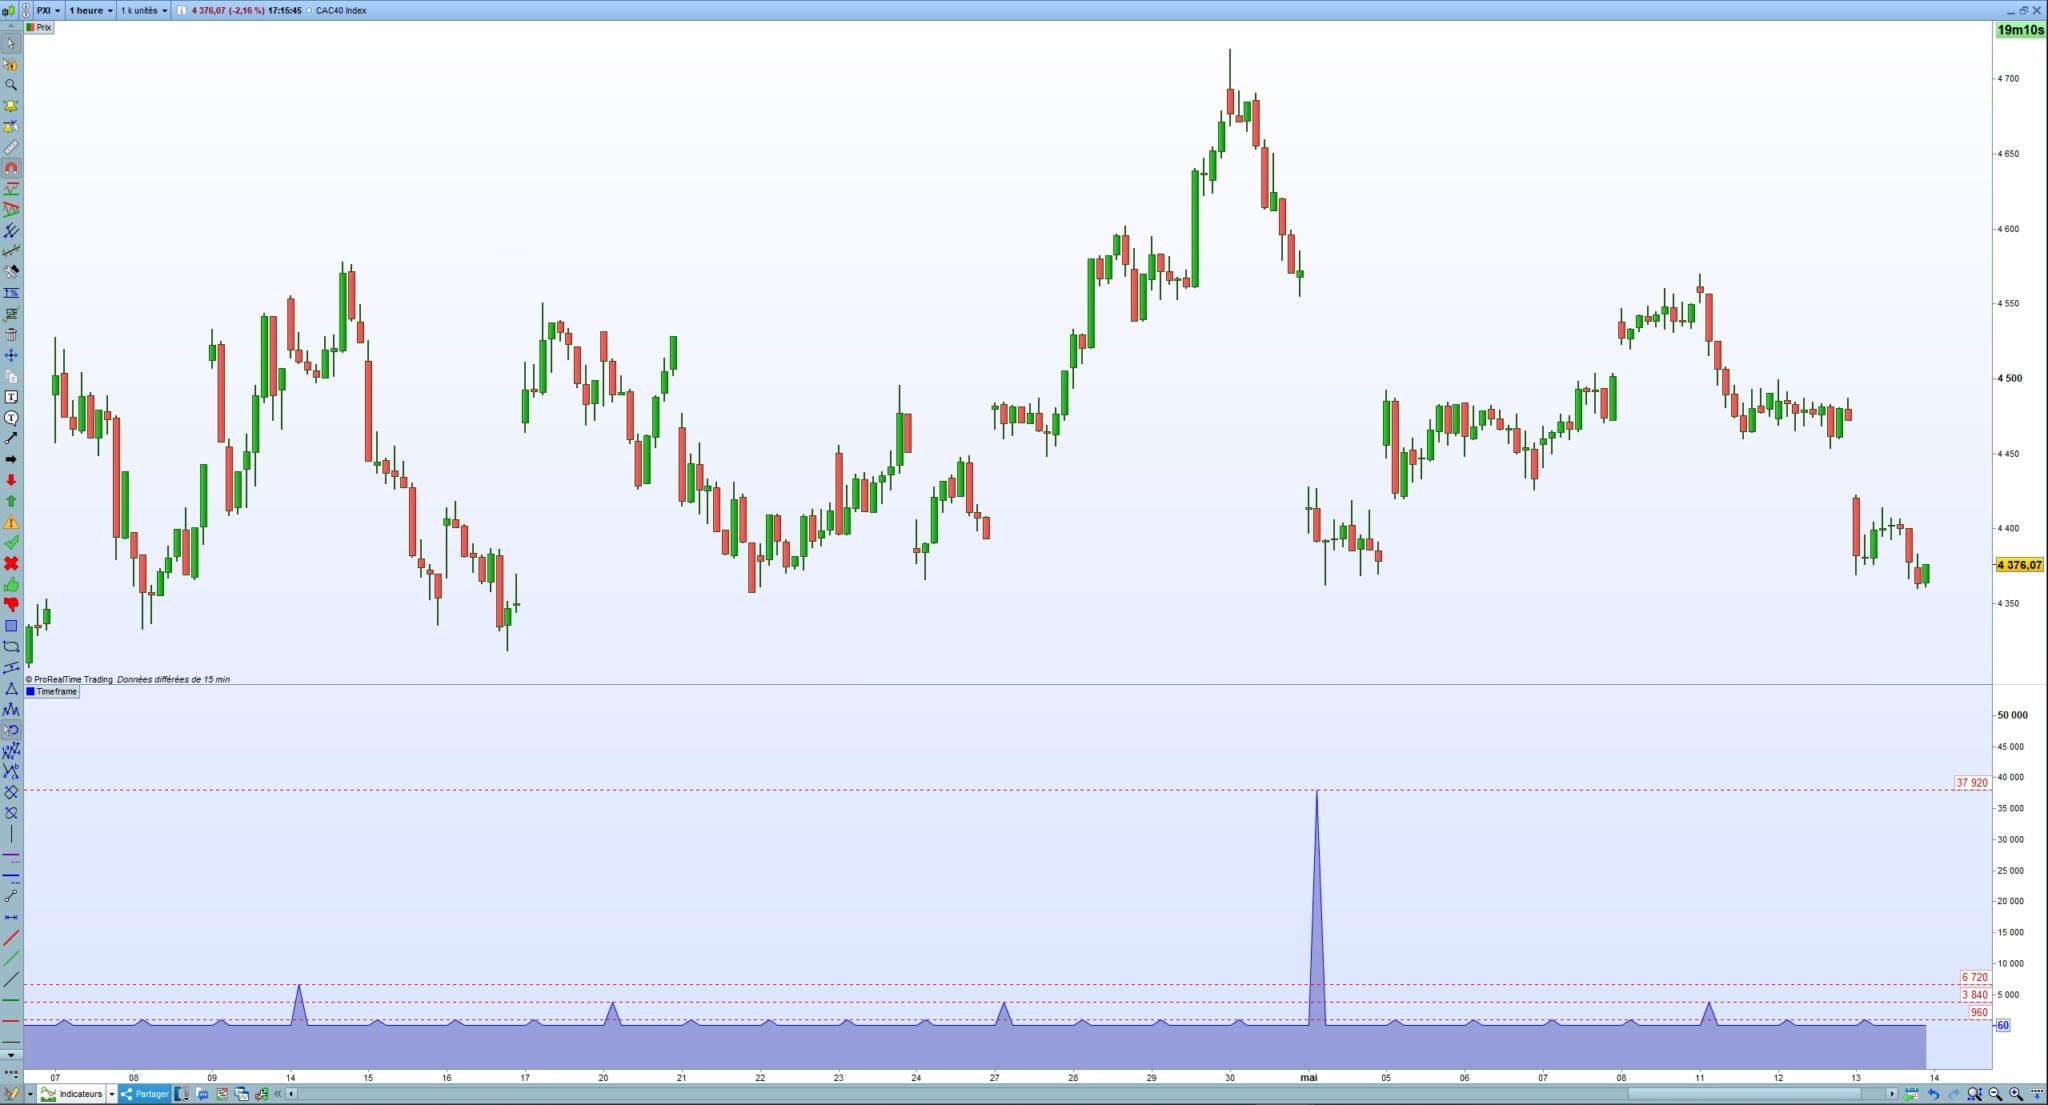
Wondering how I could detect the timeframe to change automatically some parameters in an indicator, I began to test the code you posted on this page (I just made a copy/paste of the above code, without changing anything).
But I get some very strange results, rather regularly(see the attached file) :for example, for the CAC40 index in 1 hr, I get 60 min (normally), but with a very regular periodicity, on the same graph, the result becomes 960, or 3840, or even 6720 and 37920 (see the attached file). There must be some bug by there !…
Could you give a look ? Thanks in advance.
Patrick
Hi Patrick
I came across an issue with this code and managed to mess it about to get it to be constant. However, I can’t see your code so I don’t know if it will help you.
Cheers
Rob
PS my changes make little sense but it worked for me, I was getting blips.
// Some hacky code to work out what the chart timeframe is in minutes up to 1597

MyDay=OpenDay
DayMinutes = 1440*(MyDay-MyDay[1])
MyHour=OpenHour
HourMinutes = 60*(MyHour-MyHour[1])
MyMin=OpenMinute
BarMinutes = MyMin - MyMin[1] + HourMinutes + DayMinutes
BarMinutes = ABS(BarMinutes)

IF BarMinutes = 5 THEN
ChartTimeframe = 5
ELSIF BarMinutes = 15 THEN
ChartTimeframe = 15
ELSIF BarMinutes = 30 THEN
ChartTimeframe = 30
ELSIF BarMinutes = 60 THEN
ChartTimeframe = 60
ENDIF

RETURN ChartTimeframe as "Chart timeframe"