Target Indicator.
Target Indicator aims to deliver one or more well-founded and visible targets.
Example:
RSI crossing above 30 for a long position or an RSI crossing below 70 for a short position.
CCI above 100 or CCI below -100Ø
Crossing of the signal line with the MACD line
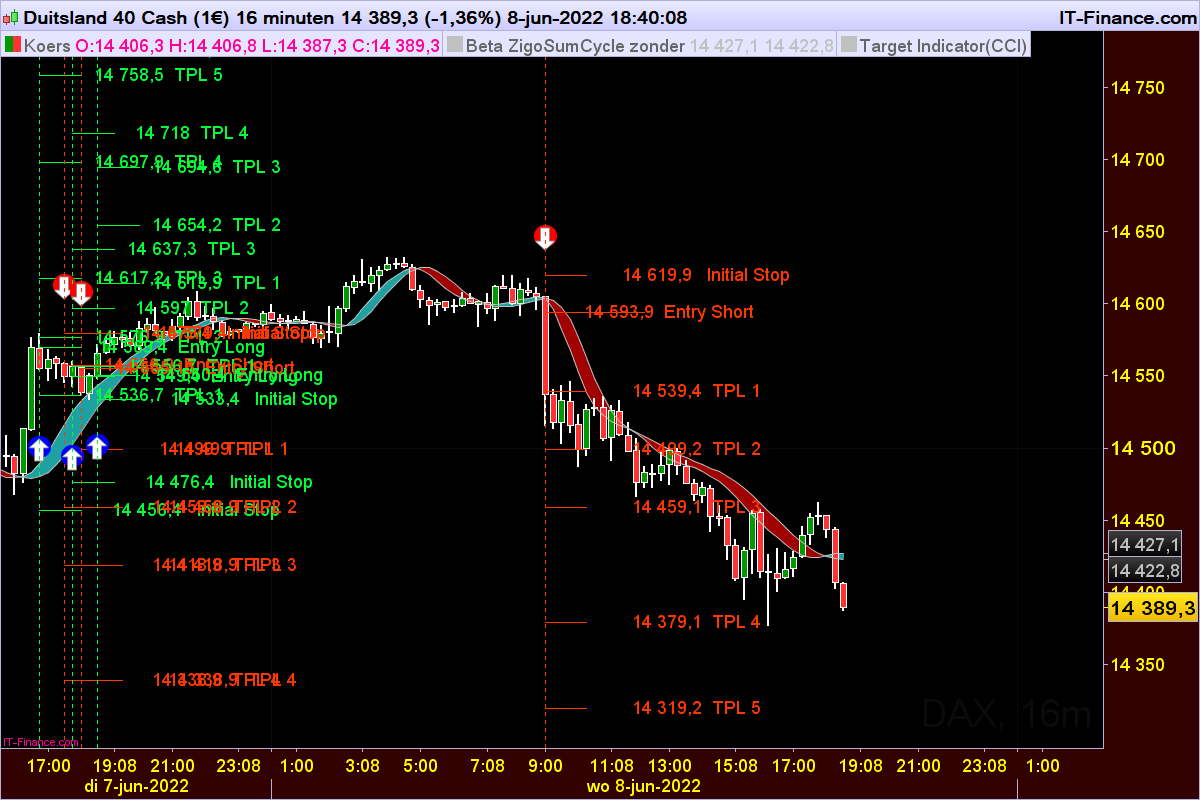
Any classic indicator or a self-developed indicator, or a combination of the two is able to be linked to the TargetIndicator, with each signal of those indicators or combinations the TargetIndicator will generate price targets.
These price targets are calculated from the moment a signal of purchase or a signal of sale is given.
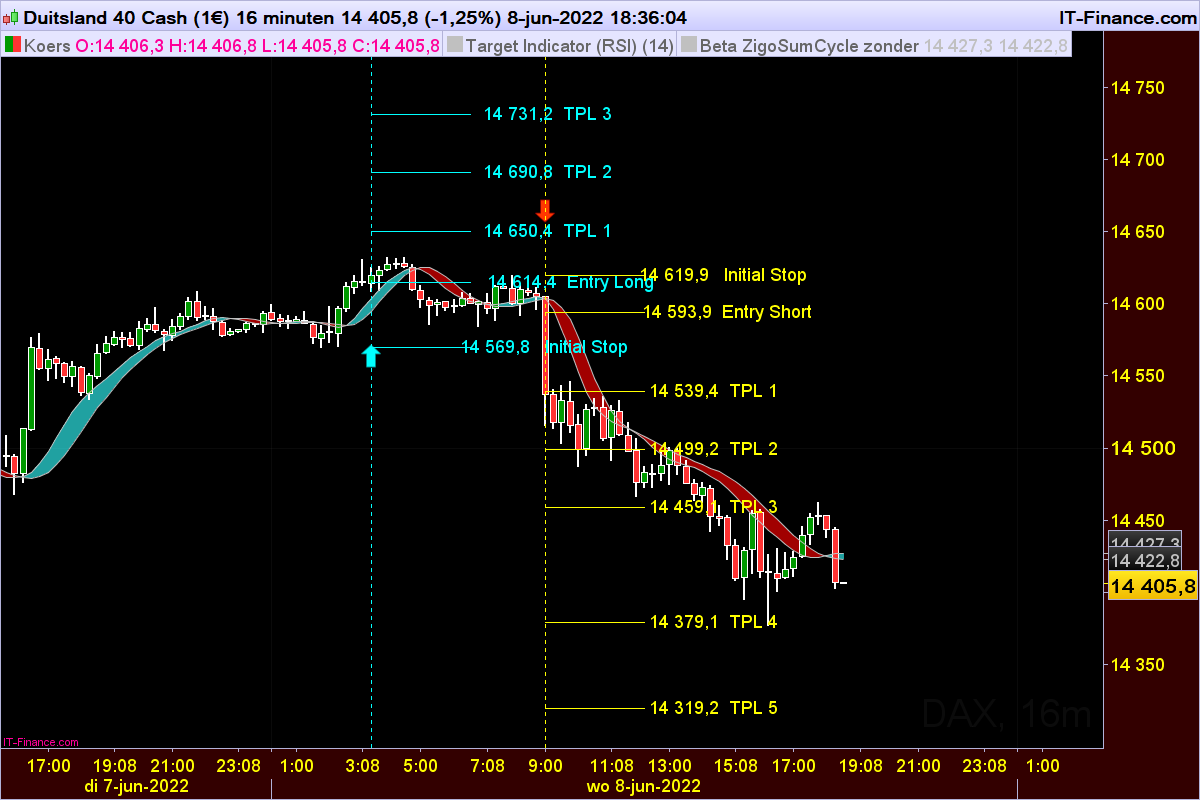
The TargetIndicator immediately indicates the “entry” the “stoploss” and 5 price targets. These values are sometimes already visible when forming the candle.
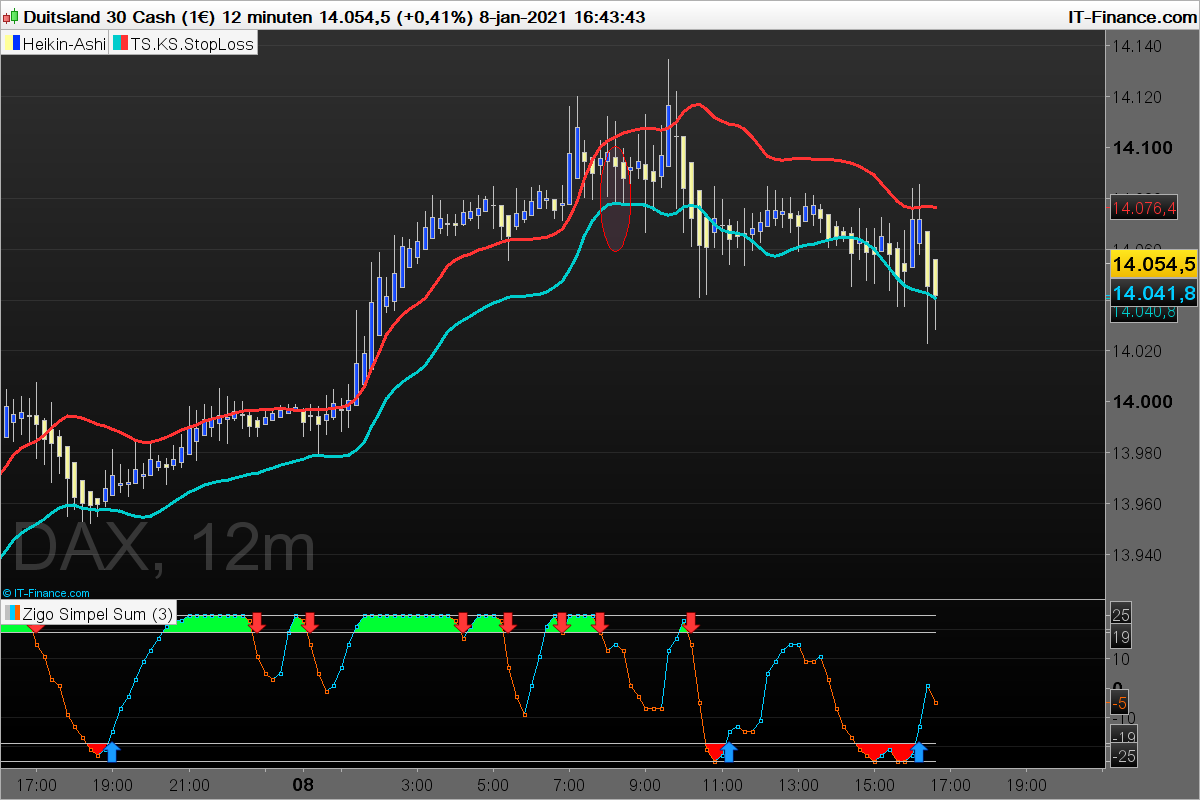
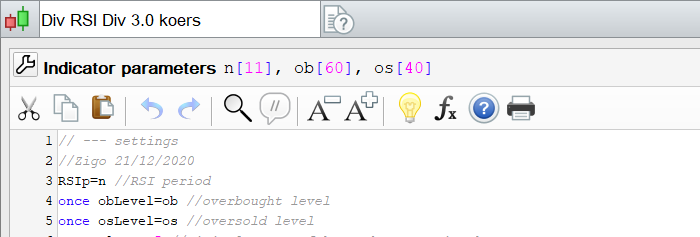
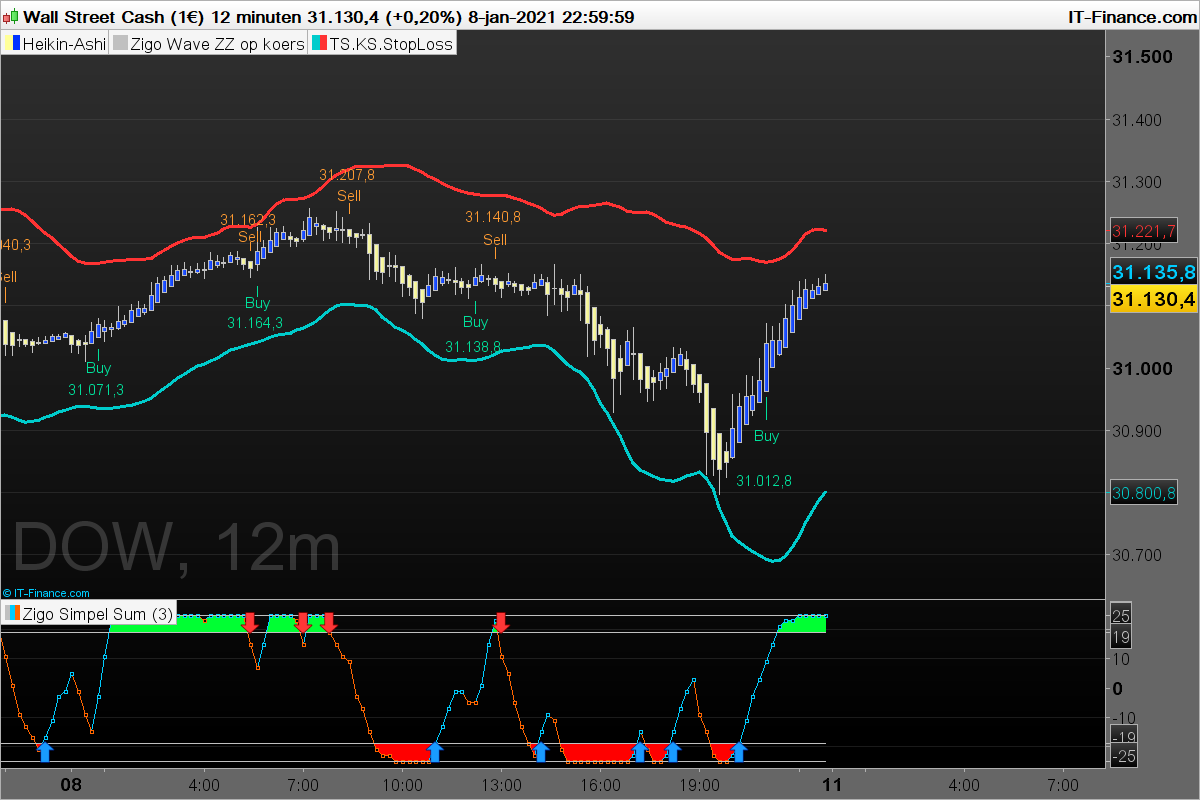
On the basis of some practical examples, it is explained how it works. In addition to these examples, the TargetIndicator can be used on most of the classic trend indicators as well as on various oscillator indicators. TargetIndicator can also be used for combinations of conditions. Three classic indicators are each linked separately to the TargetIndicator, the RSI, CCI and the MACD.
All three classic Indicators show alternating signals. After a signal up, a signal comes down. The different linked indicators are shown below.
Not all signals are usable as will become clear later.
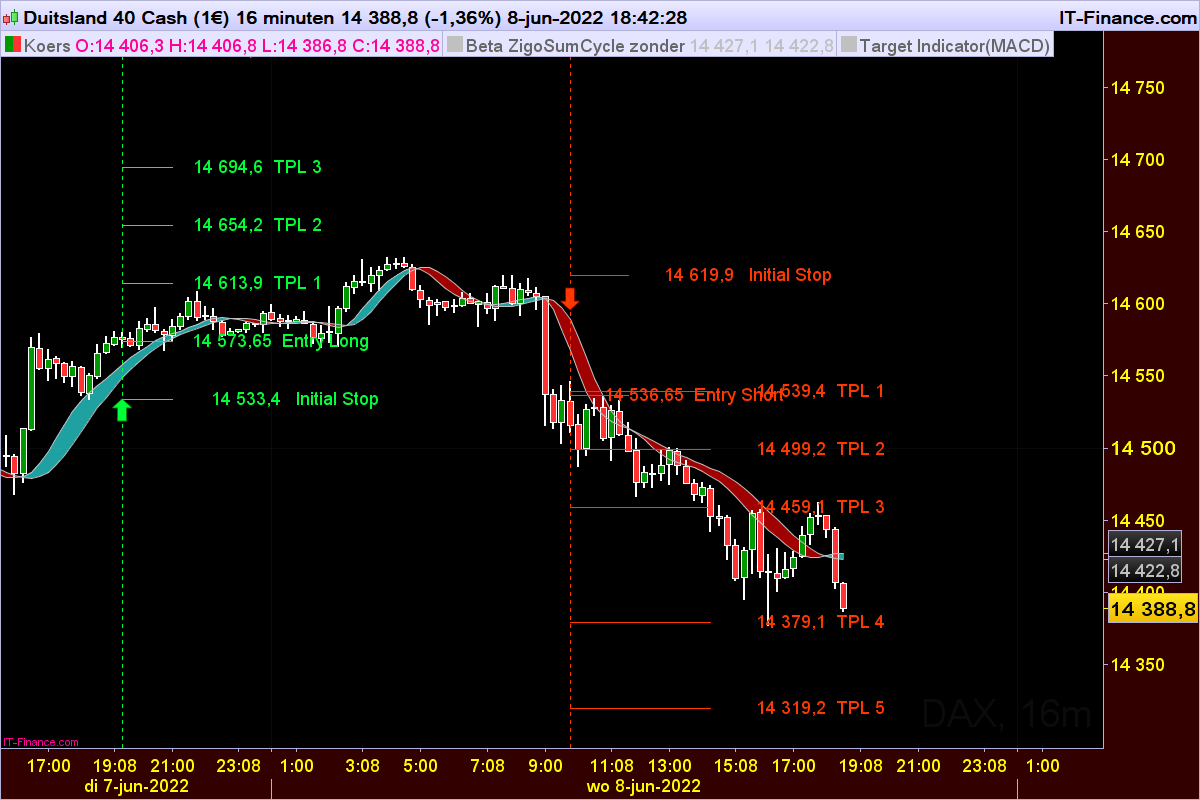
[attachment file=”DAX-16-minuten(MACD).png”]
Target Indicator.
Target Indicator aims to deliver one or more well-founded and visible targets.
Example:
Ø RSI crossing above 30 for a long position or an RSI crossing below 70 for a short position.
Ø CCI above 100 or CCI below -100
Ø Crossing of the signal line with the MACD line
Any classic indicator or a self-developed indicator, or a combination of the two is able to be linked to the TargetIndicator, with each signal of those indicators or combinations the TargetIndicator will generate price targets.
These price targets are calculated from the moment a signal of purchase or a signal of sale is given.
The TargetIndicator immediately indicates the “entry” the “stoploss” and 5 price targets. These values are sometimes already visible when forming the candle.
On the basis of some practical examples, it is explained how it works. In addition to these examples, the TargetIndicator can be used on most of the classic trend indicators as well as on various oscillator indicators. TargetIndicator can also be used for combinations of conditions. Three classic indicators are each linked separately to the TargetIndicator, the RSI, CCI and the MACD.
All three classic Indicators show alternating signals. After a signal up, a signal comes down. The different linked indicators are shown below.
Not all signals are usable as will become clear later.
[attachment file=”194933″]
Target Indicator.
Target Indicator aims to deliver one or more well-founded and visible targets.
Example:
Ø RSI crossing above 30 for a long position or an RSI crossing below 70 for a short position.
Ø CCI above 100 or CCI below -100
Ø Crossing of the signal line with the MACD line
Any classic indicator or a self-developed indicator, or a combination of the two is able to be linked to the TargetIndicator, with each signal of those indicators or combinations the TargetIndicator will generate price targets.
These price targets are calculated from the moment a signal of purchase or a signal of sale is given.
The TargetIndicator immediately indicates the “entry” the “stoploss” and 5 price targets. These values are sometimes already visible when forming the candle.
On the basis of some practical examples, it is explained how it works. In addition to these examples, the TargetIndicator can be used on most of the classic trend indicators as well as on various oscillator indicators. TargetIndicator can also be used for combinations of conditions. Three classic indicators are each linked separately to the TargetIndicator, the RSI, CCI and the MACD.
All three classic Indicators show alternating signals. After a signal up, a signal comes down. The different linked indicators are shown below.
Not all signals are usable as will become clear later.