

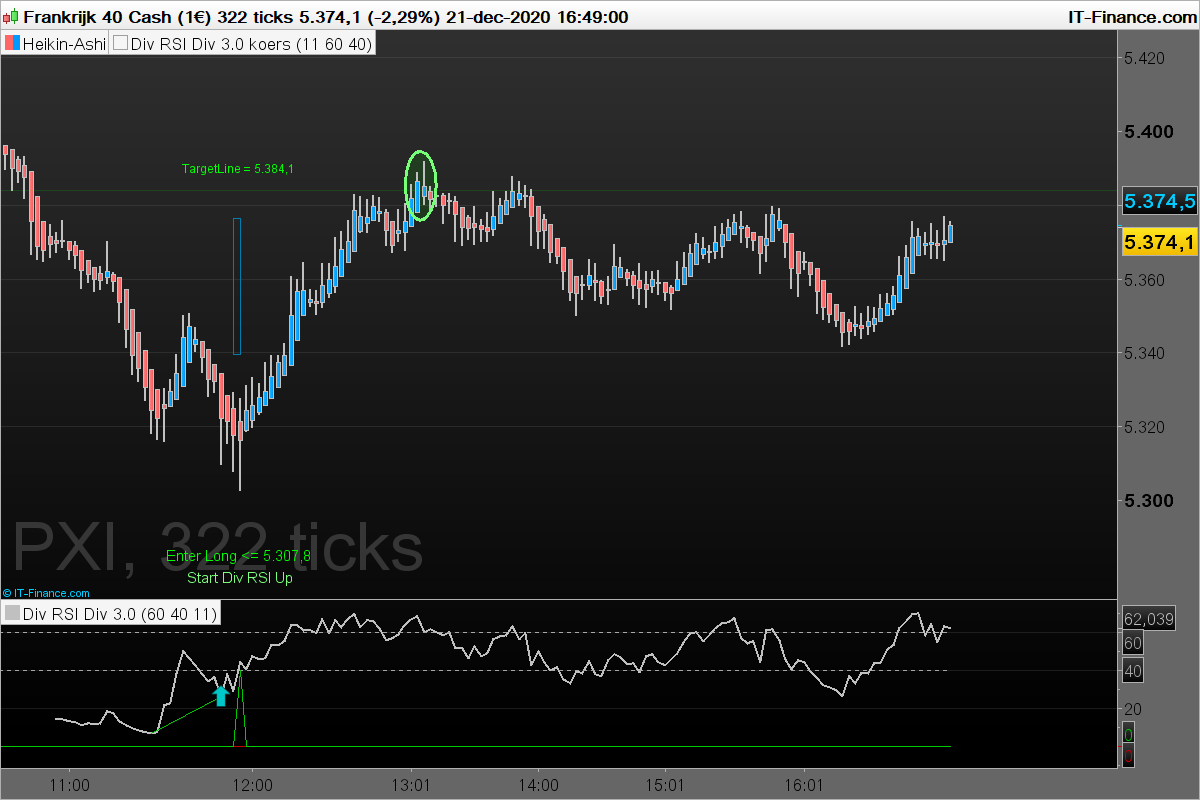
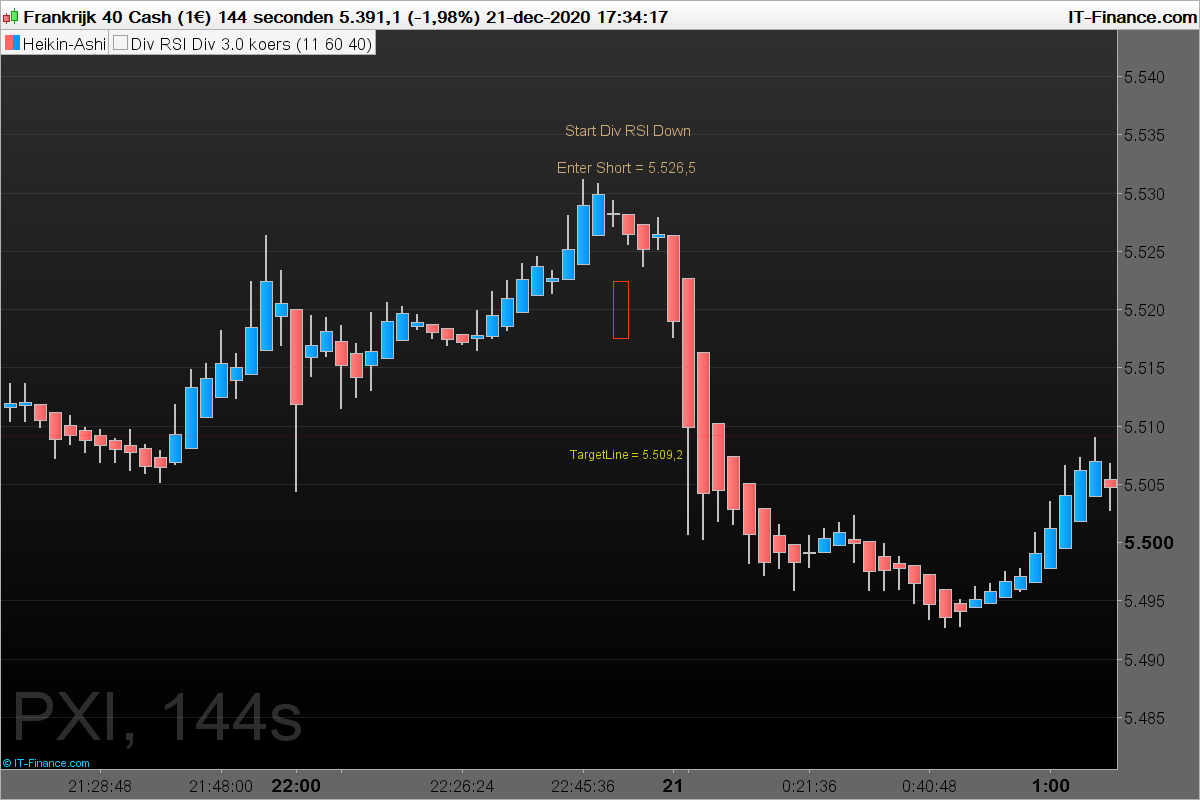
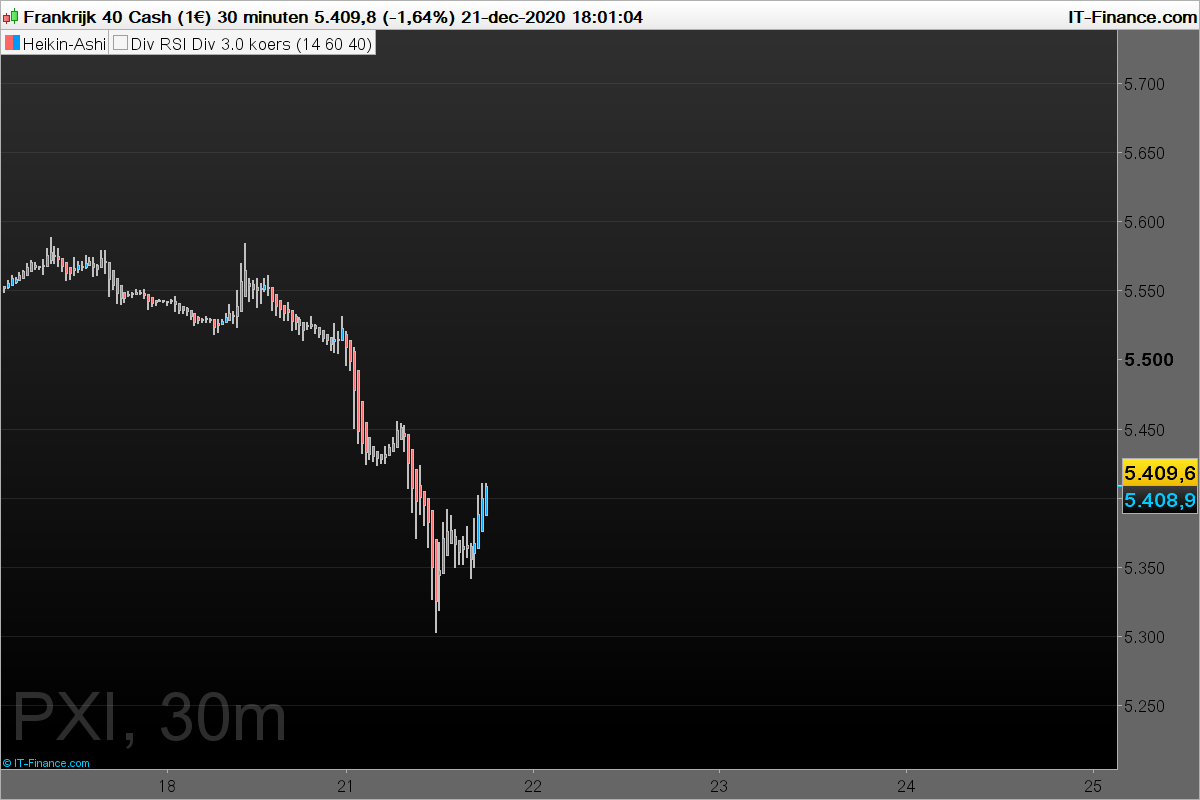
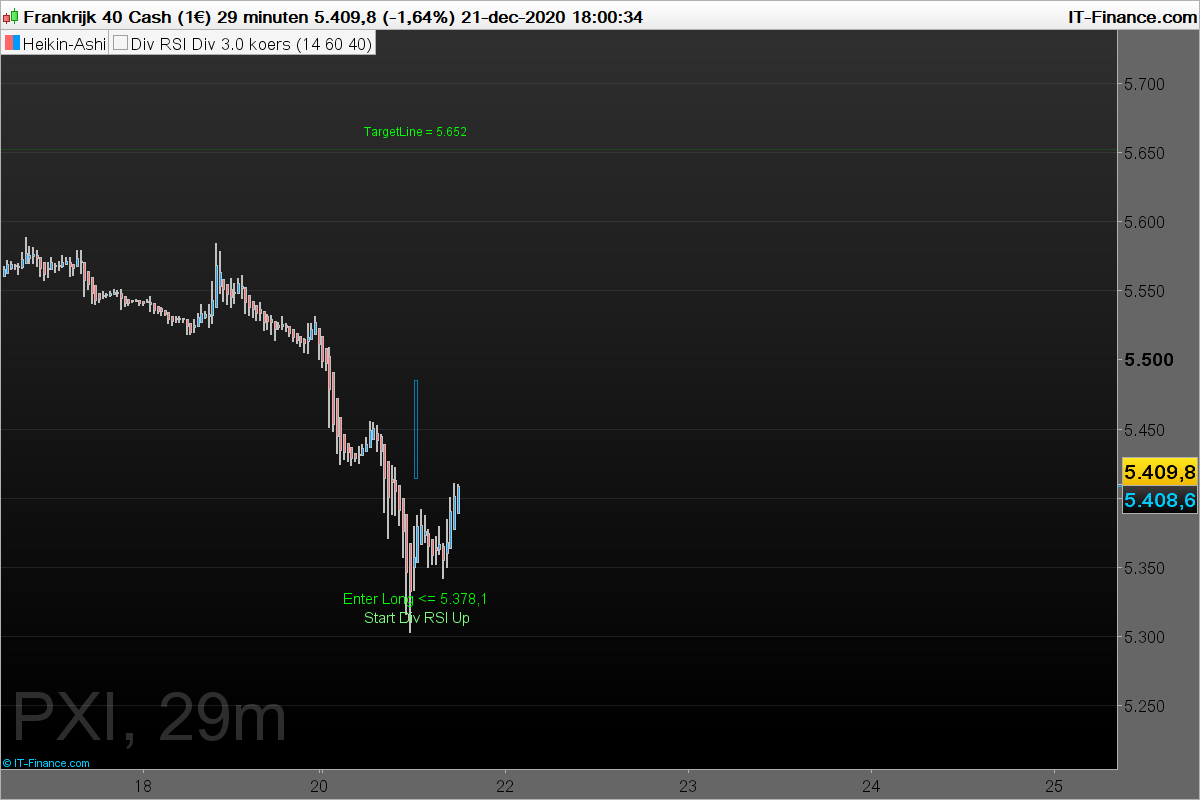
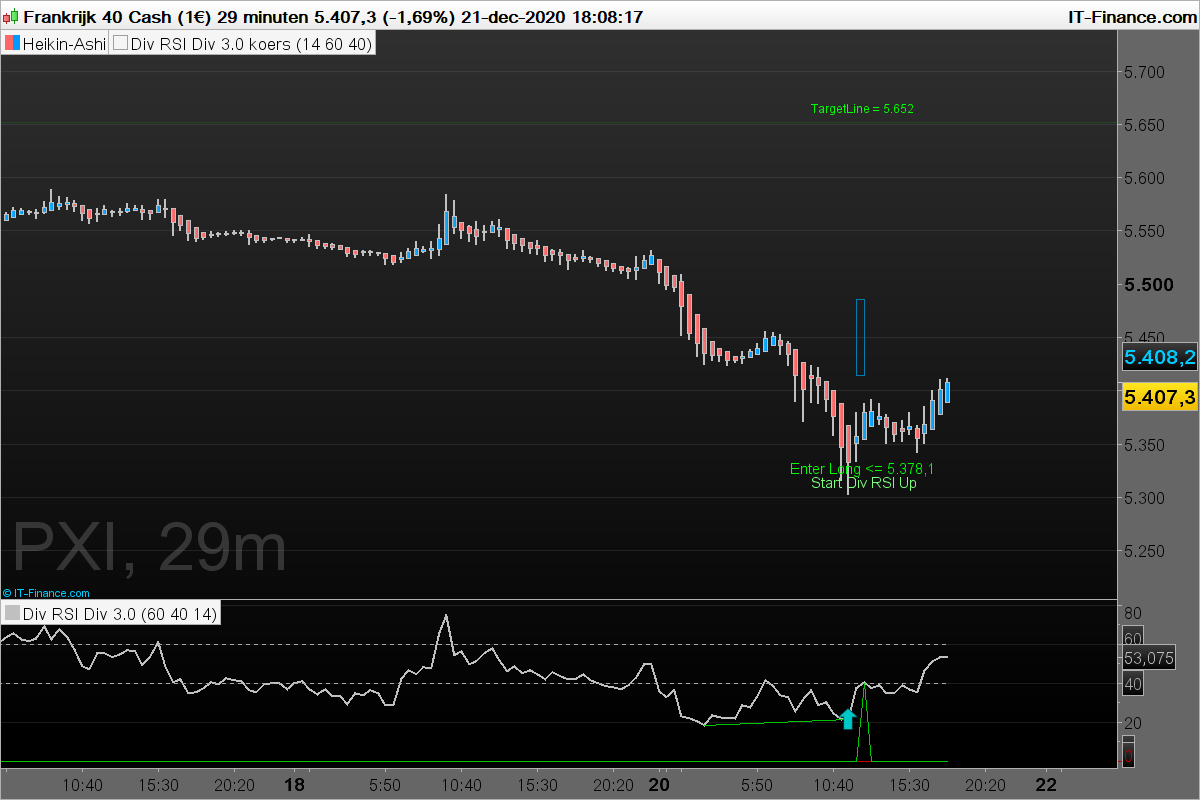
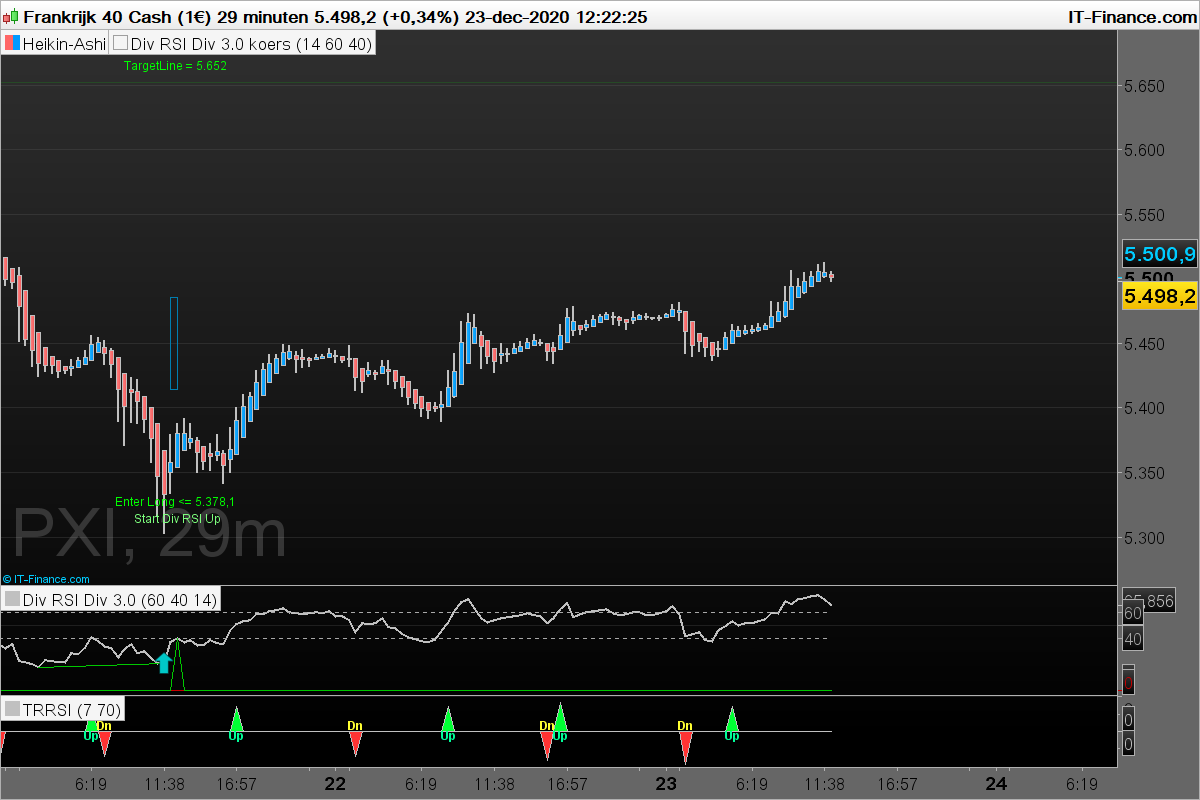
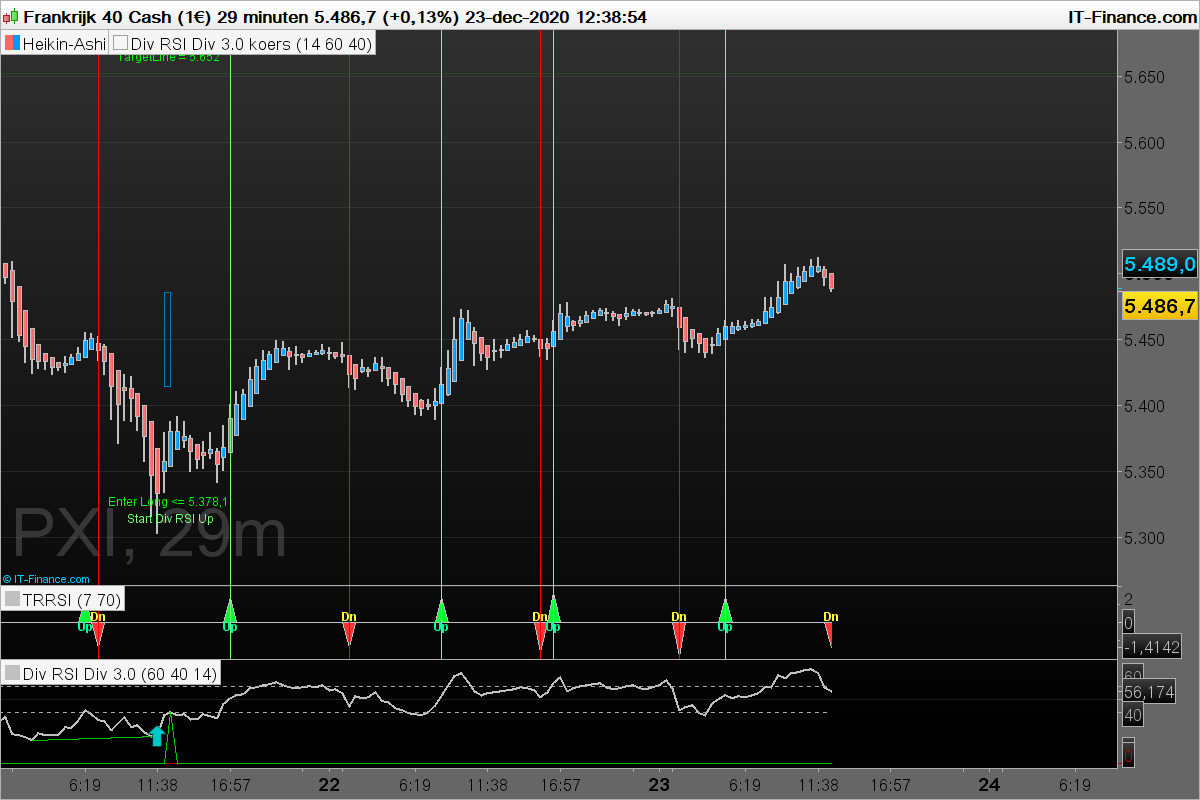
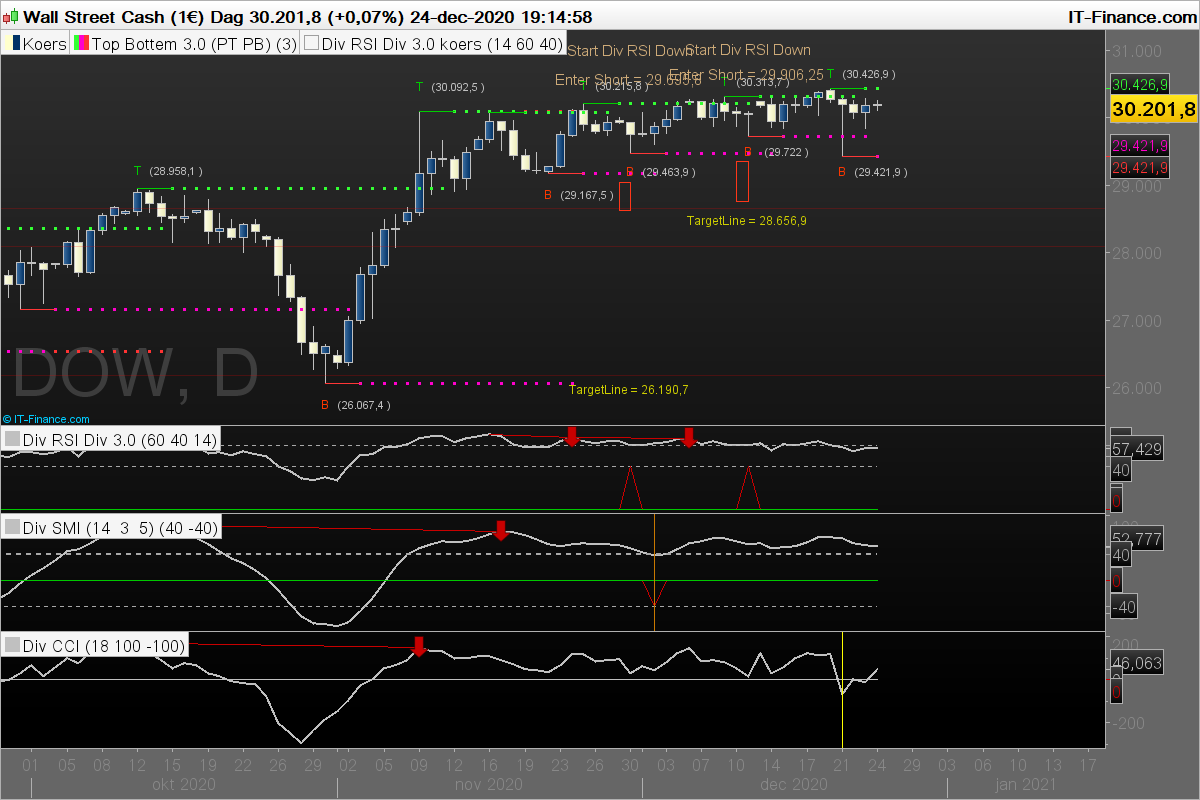
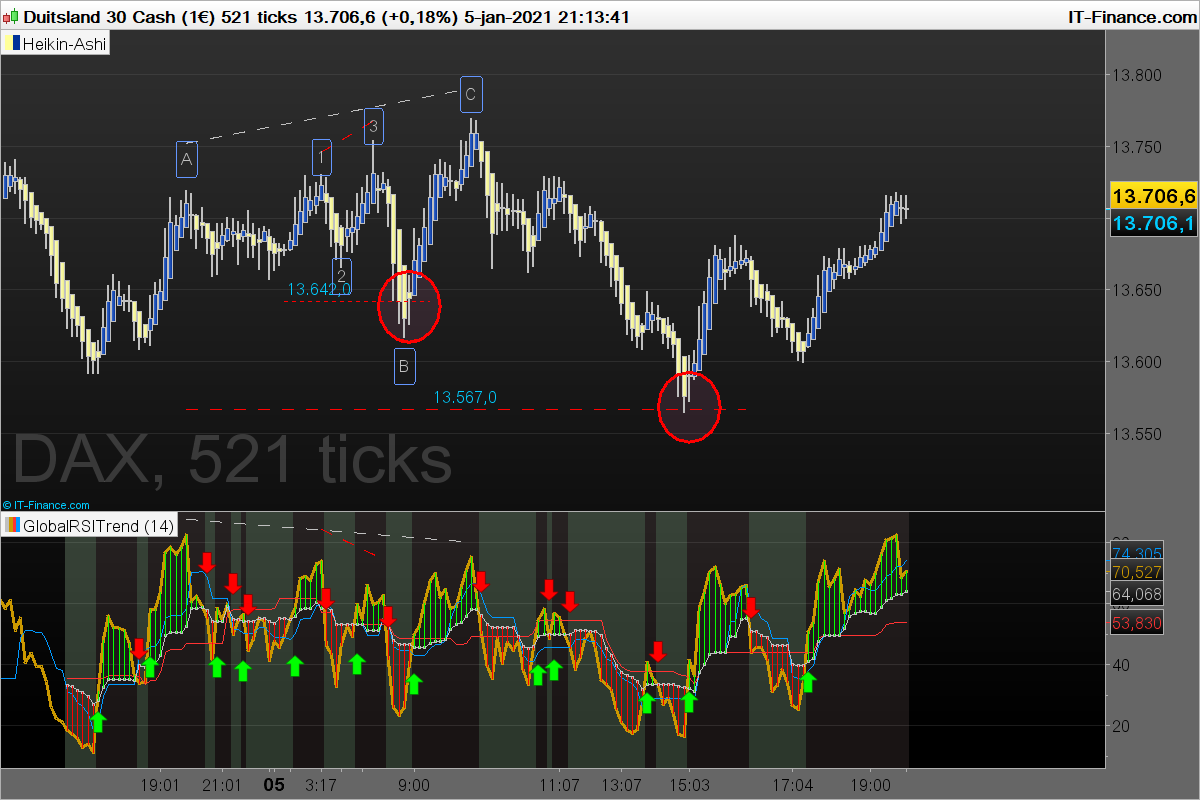
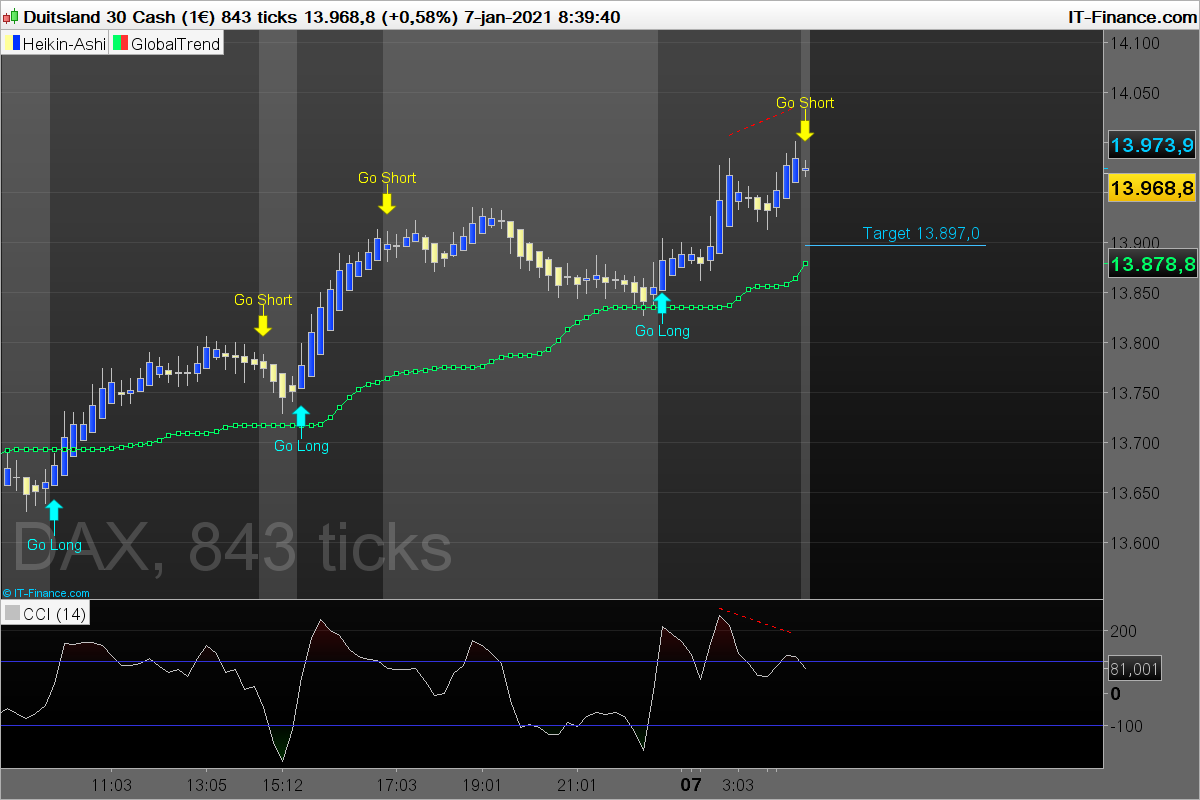
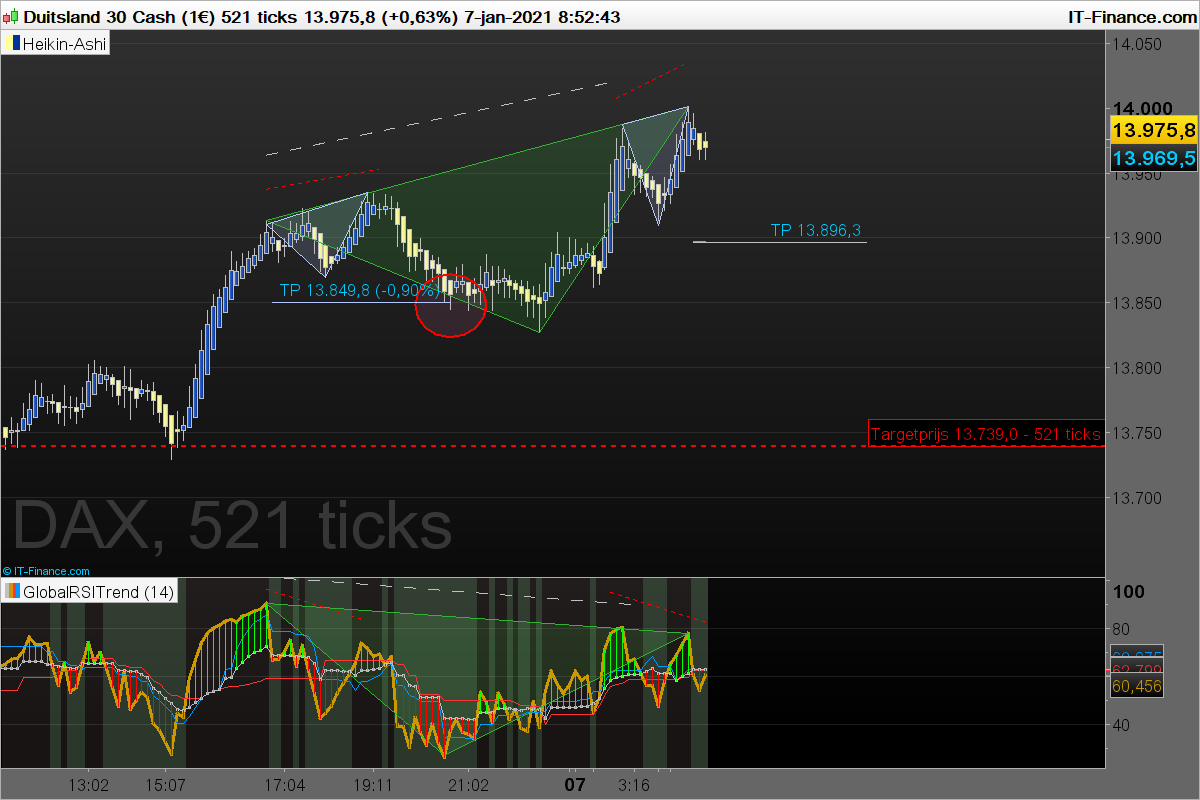
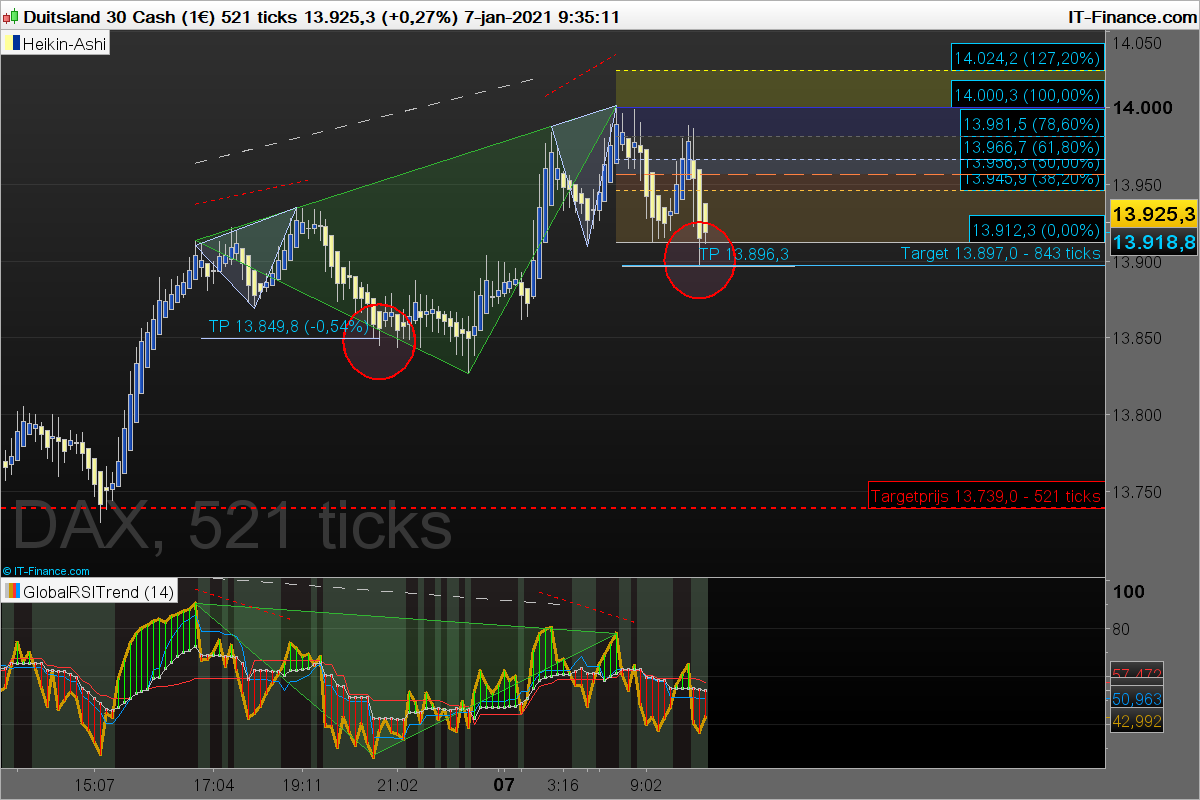
Calculation of a TP trough RSI Divergence
- You must be logged in to reply to this topic.
New Reply
Summary
This topic contains 26 replies,
has 2 voices, and was last updated by ![]()
3 years, 10 months ago.
Topic Details
| Forum: | General Trading: Market Analysis & Manual Trading |
| Language: | English |
| Started: | 12/21/2020 |
| Status: | Active |
| Attachments: | 18 files |
Loading...