A certain someone kindly shared a link with me and asked me if I would test it out and post my thoughts here. Below is my initial testing which along with the strategy I post here for further discussion.
The link sent to me:
http://jonathankinlay.com/2018/06/simple-momentum-strategy/
and the strategy details are here:
http://www.quantifiedstrategies.com/buy-when-sp-500-makes-new-intraday-high/
Thank you to the original authors for publishing this idea.
Basically it is an SP500 daily long only strategy that buys if the bars high is higher than the last five bars highest highs and the bars close is within the bottom 15% of the bars range. There is also some time criteria based on Chicago hours but for my initial test I chose to ignore this. That is something for when MTF is released I think!
So the very simple strategy that I coded was this:
defparam cumulateorders = false

p = 5
x = 0.15

c1 = High > highest[p-1](high[1])
c2 = (close - low) / (high - low) < x

IF c1 and c2 then
BUY 5 contract at market
endif

if onmarket and close > high[1] then
sell at market
endif
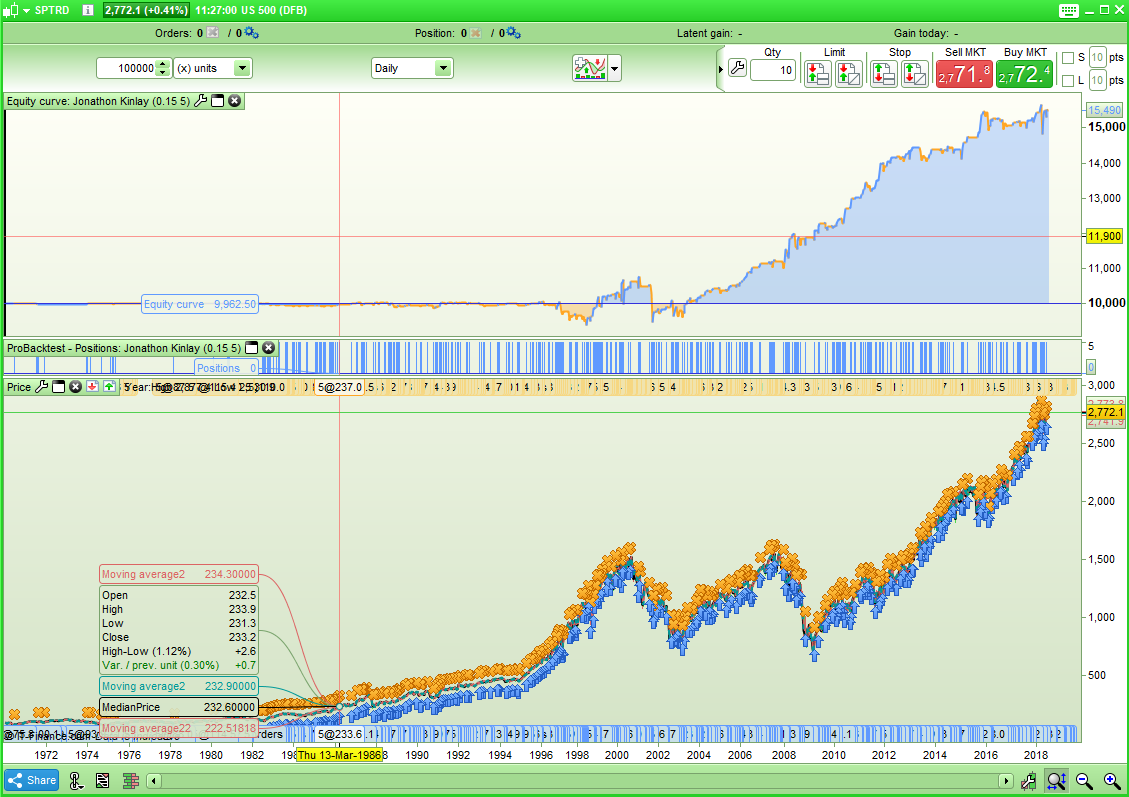
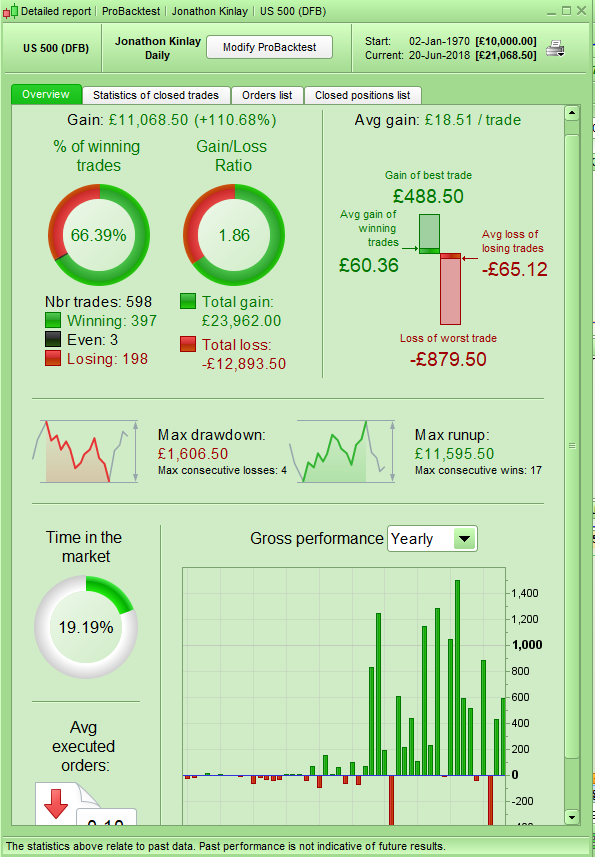
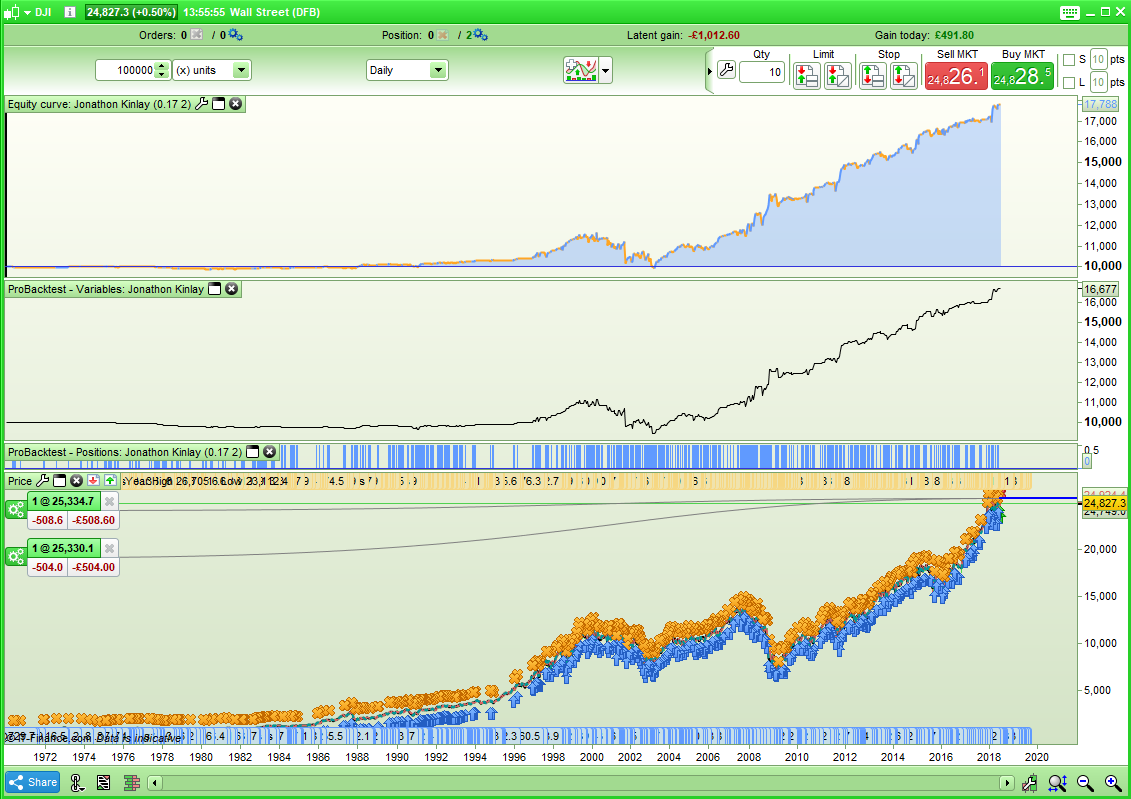
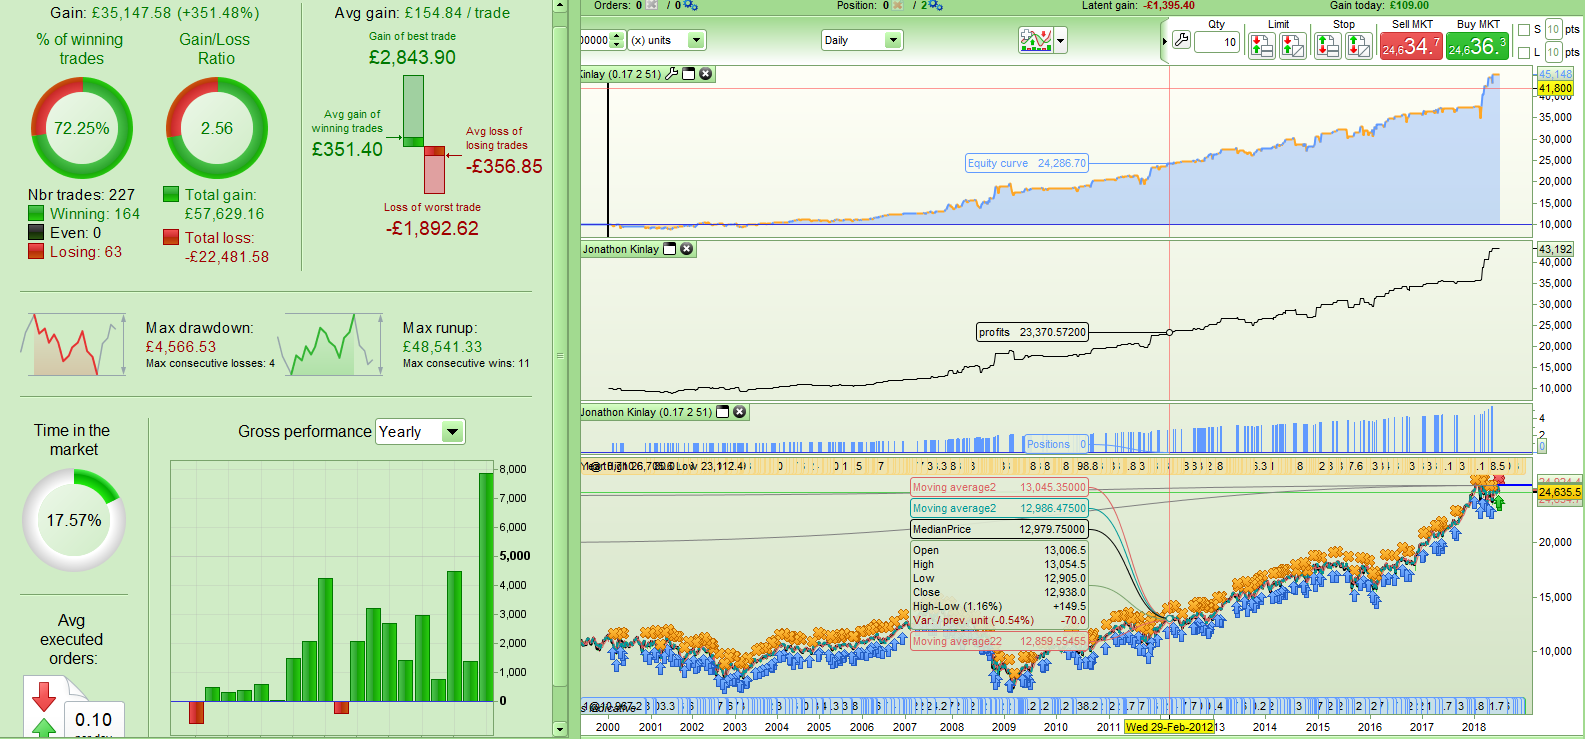
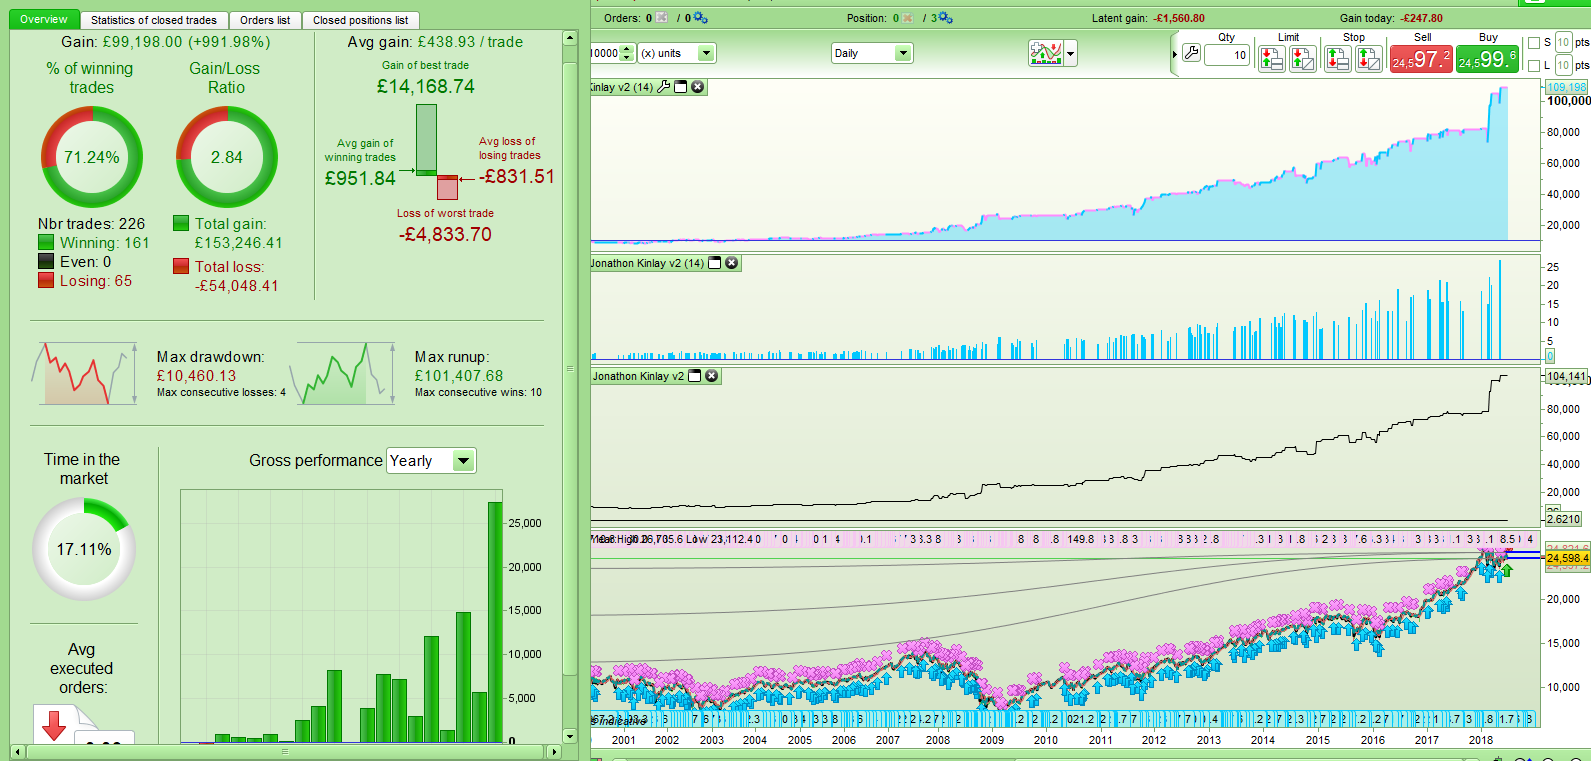
[attachment file=73757]
Not too bad, although there hasn’t really been any profit since the end of 2015 and performance was terrible prior to 2001. Sometimes you should expect to see this in a strategy as computer based trading only really started to take off around then.
So as it is such a simple strategy analysis of the two main variables is very easy to do so next thing I thought that I would play with the entry level for the inner bar strength.
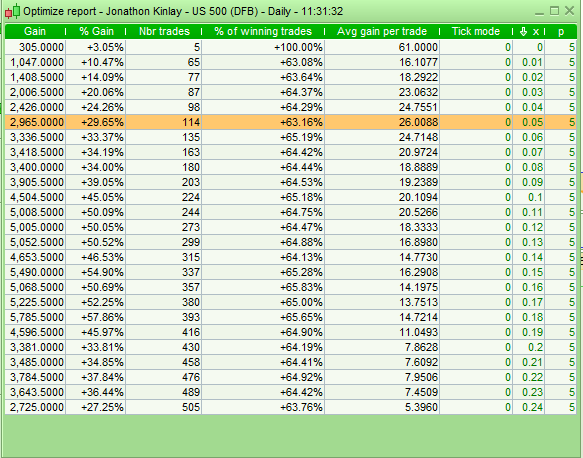
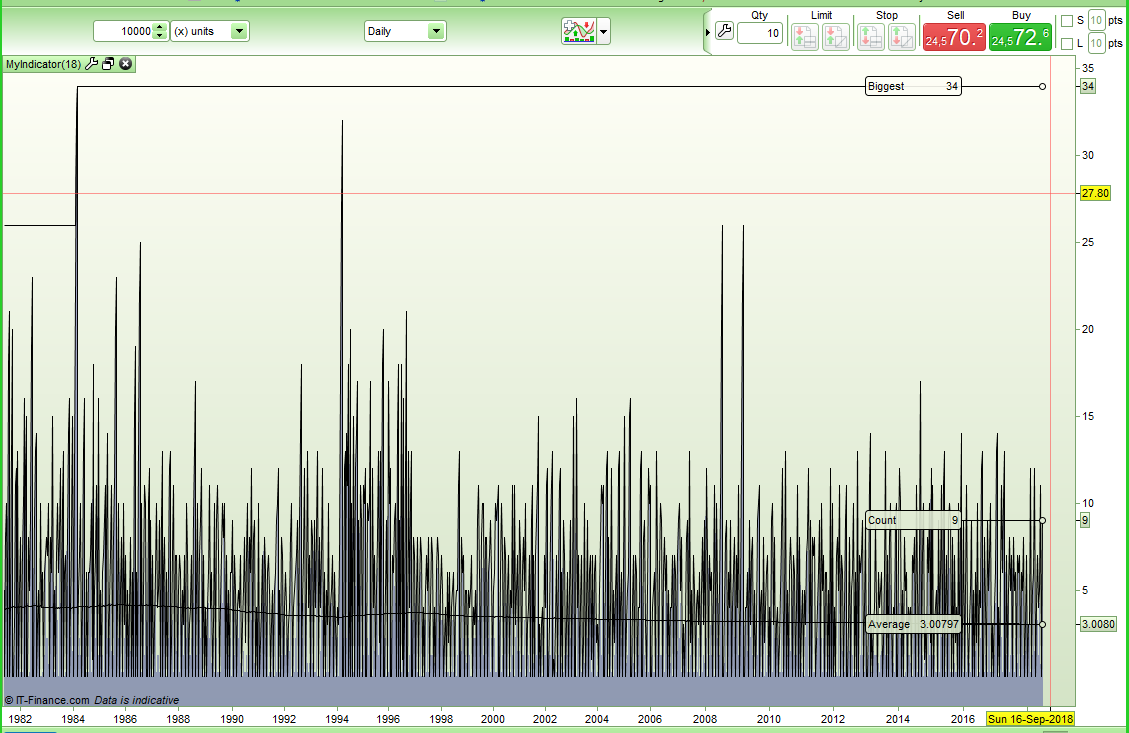
[attachment file=73758]
Ignoring the very low values below 0.04 (4% of the bars range) as there is not much data so it can get a bit skewed – it is nice to see that by making our entry criteria tighter we reduce trade quantity but increase our return per trade. This proves that the inner bar strength as a condition is working as it should in this strategy.
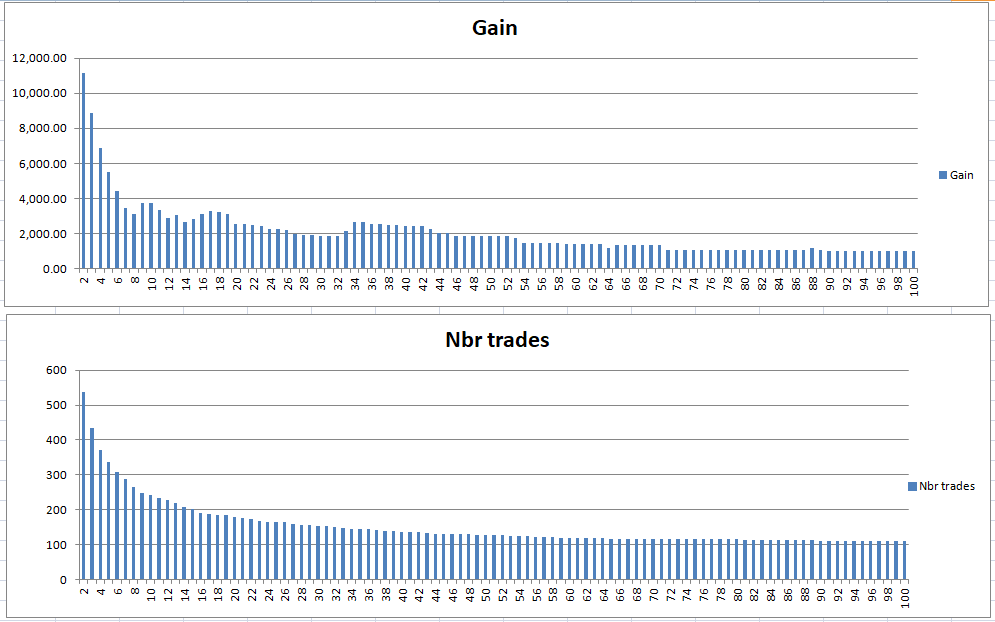
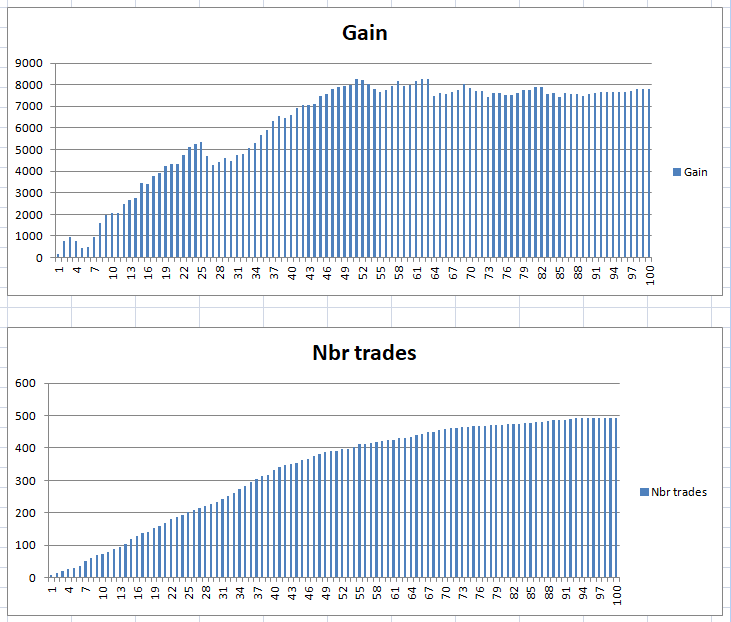
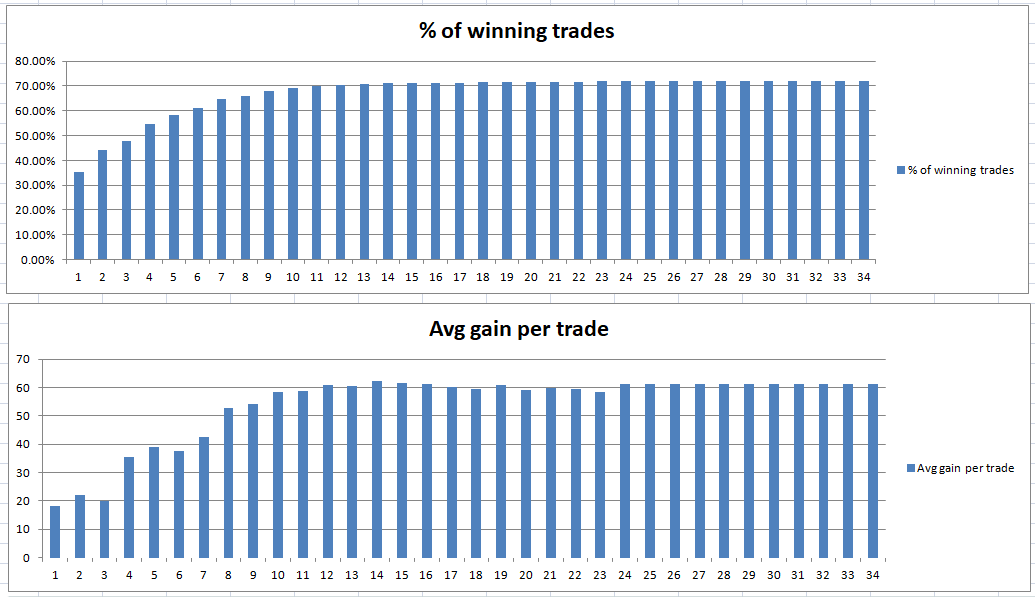
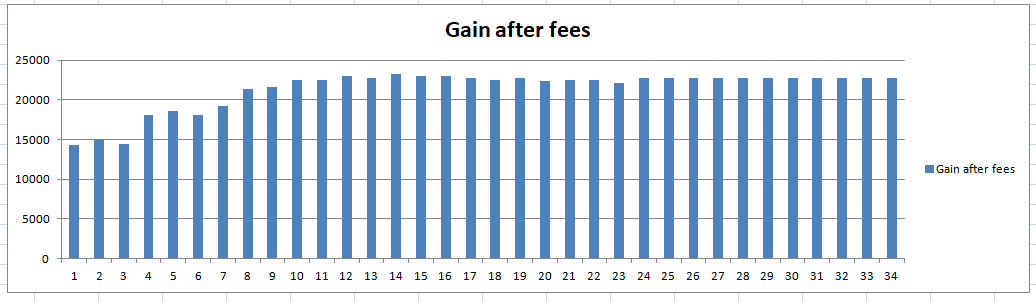
Next was to fix inner bar strength level at the authors original 0.15 (15%) and see what happens if you change the look back period for the high higher than p bars highs.
I tested values from 2 (just looking at the last bar) through to 100. It seemed a good idea to graph the results in Excel to more easily visualise them.
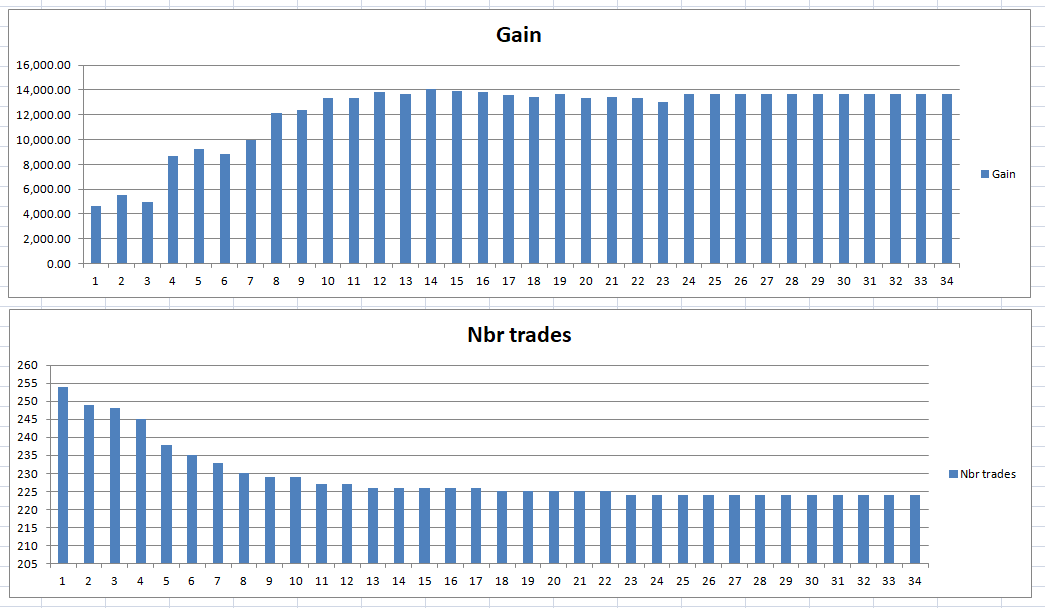
[attachment file=73759]
[attachment file=73760]
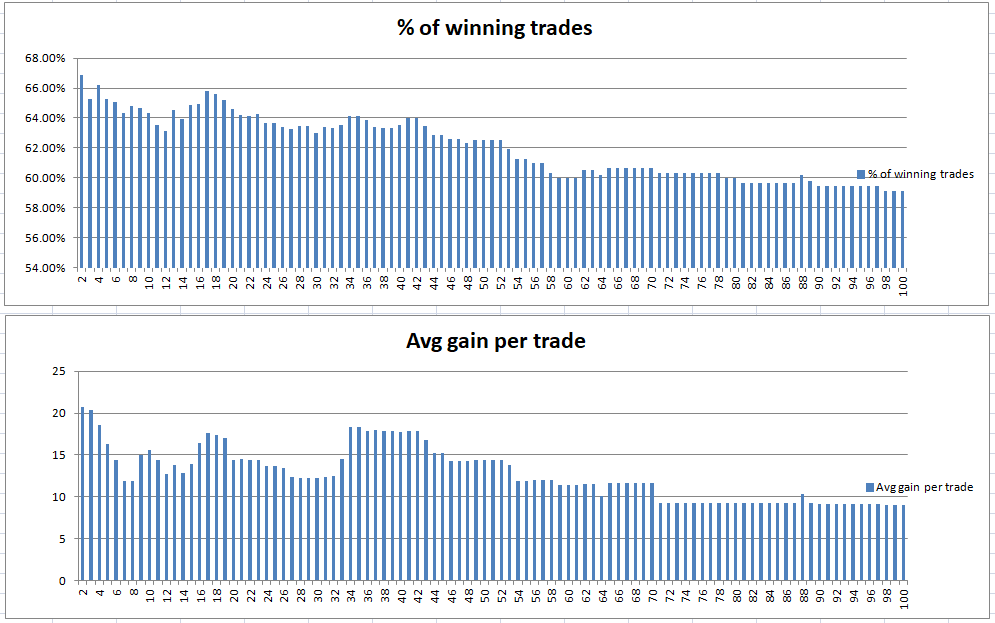
The percentage of wins and average gain per trade charts are a little bit lumpy and bumpy but not too bad. It seems that five is not a bad value but there may be some merit in reducing this to increase the number of trades and the overall total gain.
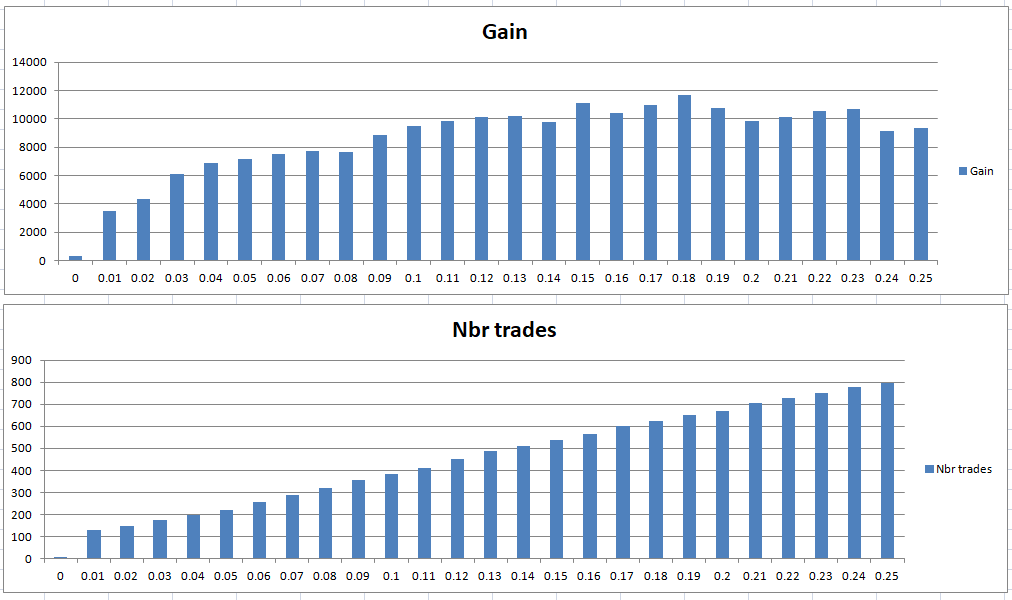
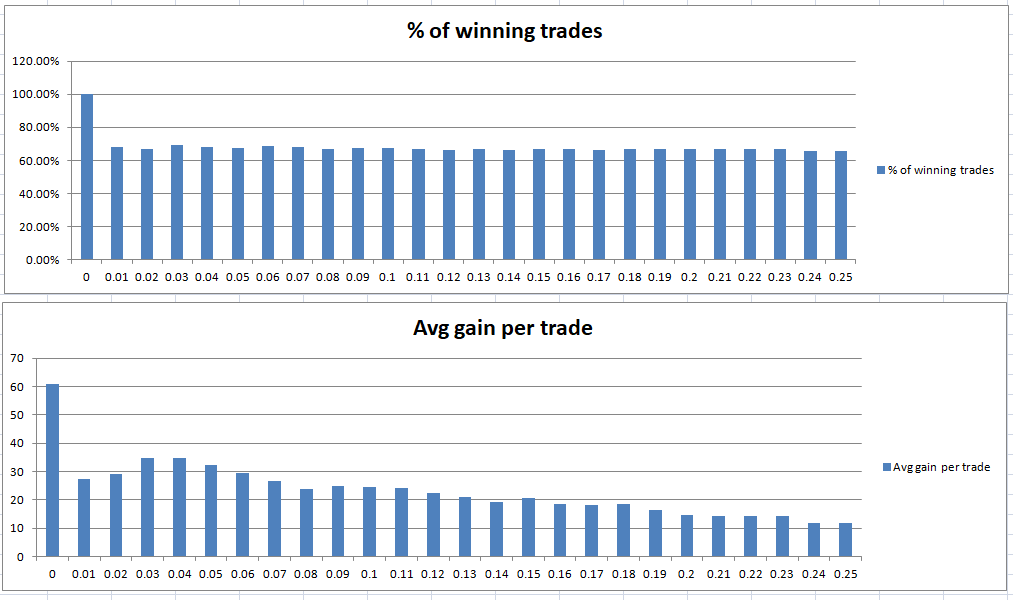
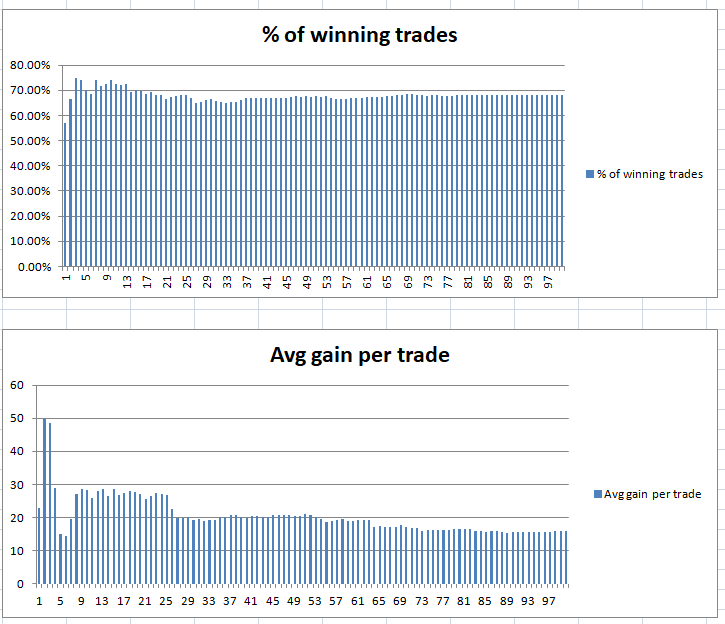
So I decided to settle on the value with the most trades 2 and then see how changing the inner bar strength level looked in charts.
[attachment file=73761]
[attachment file=73762]
Interestingly the win rate is pretty level across the range. Obviously the lower the IBS level the fewer the trades. There seems to be a good average gain per trade the lower the IBS level is set but once again under 5% has too little data to be useful for analysis. Between 15% and 19% has the largest overall gain so if we settle for 17% what do the results look like.
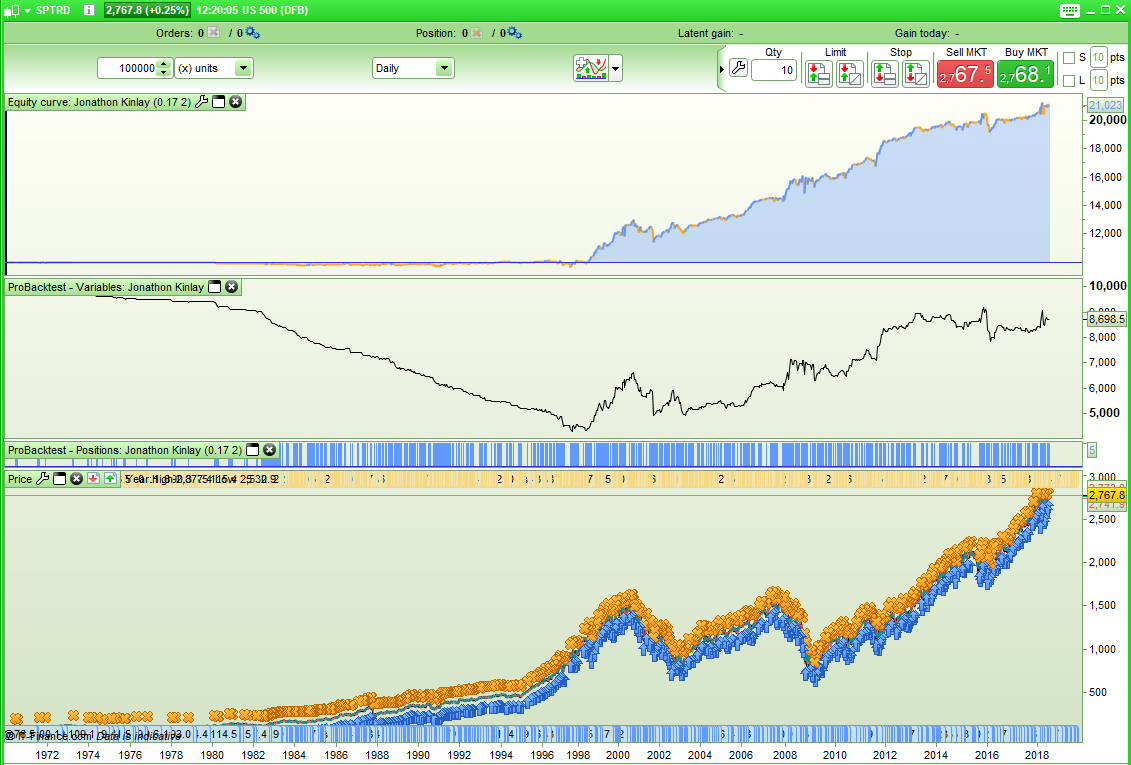
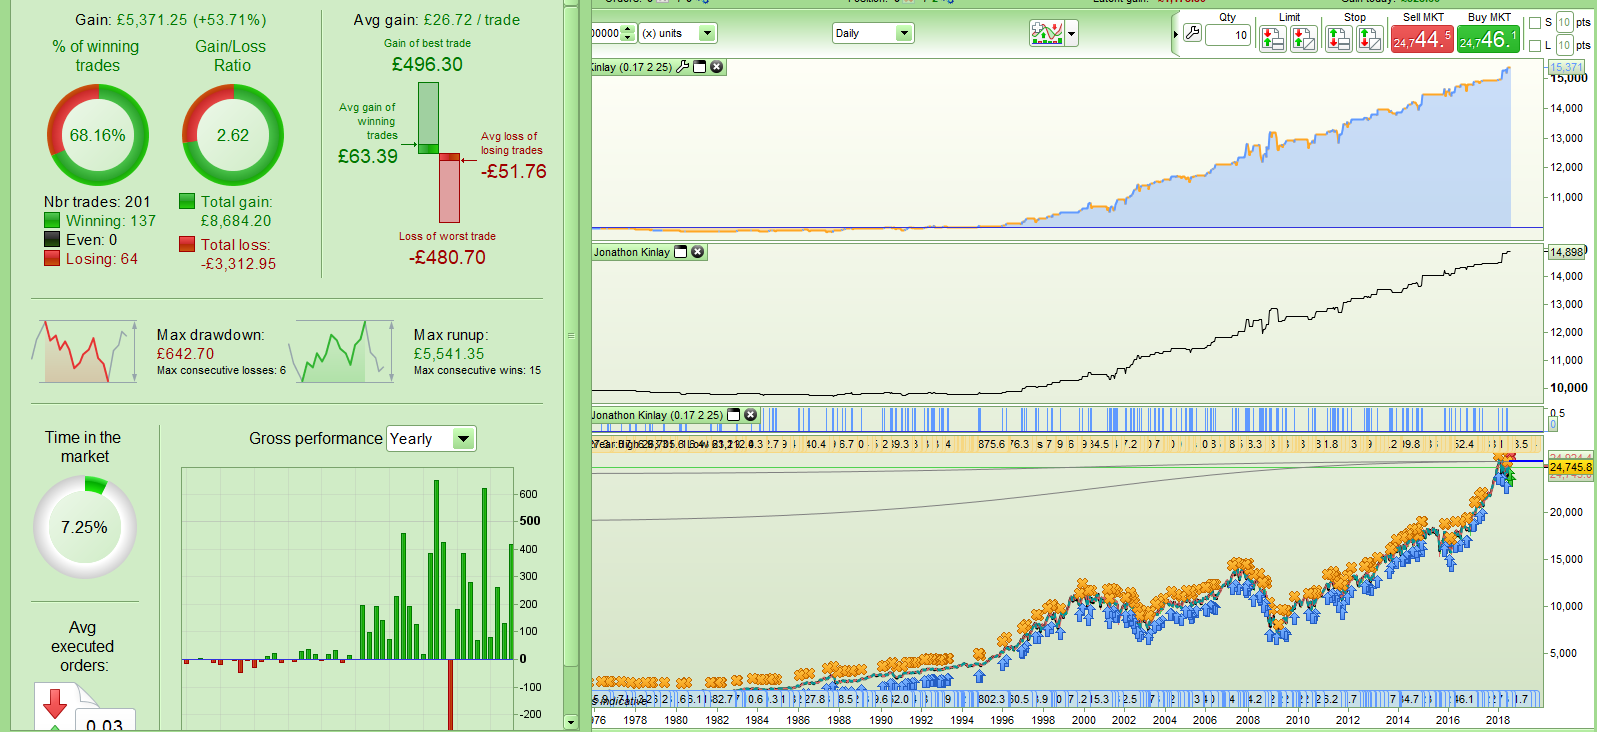
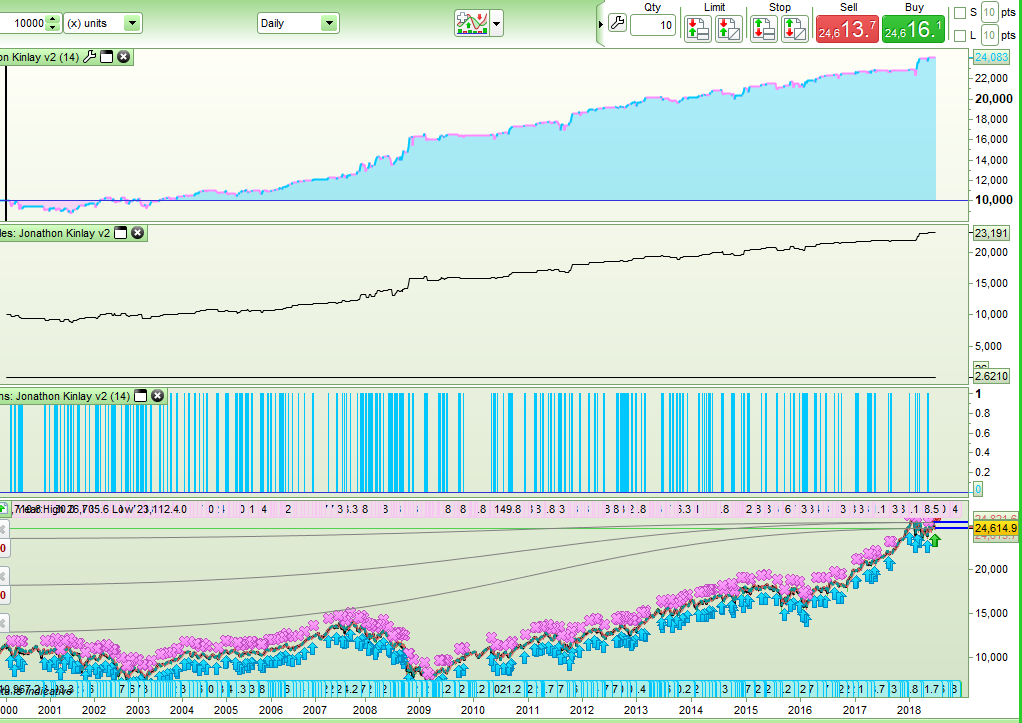
[attachment file=73763]
[attachment file=73764]
The black line is an equity curve where 1 is deducted from the strategy profit whenever a position is held overnight. Worryingly it seems that since early 2013 overnight fees may just be sucking the life out of the strategy.
Plenty more testing to be done and ideas to be tested. I did look at the same strategy on the DJI index and it worked well there with a look back period of around 15 bars.
Please post here your thoughts, ideas and further tests and remember that this is not my strategy idea and I am not recommending anyone to trade this with real money just yet!