Dear all,
As you may know in the pro-real library there is a Demark TD Sequential available: link: https://www.prorealcode.com/prorealtime-indicators/td-sequential-setup/
Well, I have been trying to create a code to back test the Demark TD, but I am not able to create it, i thought (and I would very much appreciate) if any of you here could post the back-test code of a Demark TD simply. Would that be possible? Thank you so much in advance.
 JS
JSParticipant
Senior
Hi
@jonpt88
You can do a simple conversion from an indicator to a trading system by removing the “draw elements” and adding buy and sell options
DefParam CumulateOrders = False

once TDSL=0
once TDSS=0
once BuySetup=0
once SellSetup=0
Once BuyCountdown=0
once SellCountdown=0
if close[1]>close[5] and close<close[4] then
bearishflip=1
bullishflip=0
elsif close[1]<close[5] and close>close[4] then
bullishflip=1
bearishflip=0
endif
if close<close[4] and bearishflip then
TDSL=TDSL+1
TDSS=0
elsif close>close[4] and bullishflip then
TDSS=TDSS+1
TDSL=0
endif
//if TDSL>0 and TDSL<10 then
//drawtext("#TDSL#",barindex,low-10*pipsize) coloured(0,255,0)
//endif
if TDSL=9 then
L=(low<low[3] and low<low[2]) or (low[1]<low[2] and low[1]<low[3])
bearishflip=0
TDSL=0
BuySetup=1
if L then
//DRAWARROWUP(barindex,low-20*pipsize) coloured(0,255,0)
Buy 1 Contract at Market
endif
endif
if TDSS>0 and TDSS<10 then
//drawtext("#TDSS#",barindex,high+10*pipsize) coloured(255,0,0)
endif
if TDSS=9 then
S=(high>high[2] and high>high[3]) or (high[1]>high[3] and high[1]>high[2])
bullishflip=0
TDSS=0
SellSetup=1
if S then
//DRAWARROWDOWN(barindex,high+20*pipsize) coloured(255,0,0)
SellShort 1 Contract at Market
endif
endif
if BuySetup then
if close<=low[2] then
BuyCountdown=BuyCountdown+1
//drawtext("#BuyCountdown#",barindex,low-10*pipsize) coloured(0,0,255)
endif
if BuyCountdown=8 then
Bar8=barindex
elsif BuyCountdown=13 then     // TD Countdown perfection buy
if low<=close[barindex-Bar8] then
//DRAWARROWUP(barindex,low-20*pipsize) coloured(0,0,255)
Buy 1 Contract at Market
endif
BuySetup=0
BuyCountdown=0
endif
elsif SellSetup then
if close>=high[2] then
SellCountdown=SellCountdown+1
//drawtext("#SellCountdown#",barindex,high+10*pipsize) coloured(0,0,255)
endif
if SellCountdown=8 then
Bar8=barindex
elsif SellCountdown=13 then  //TD Countdown perfection sell
if high>=close[barindex-Bar8] then
//DRAWARROWDOWN(barindex,high+20*pipsize) coloured(0,0,255)
SellShort 1 Contract at Market
endif
SellSetup=0
SellCountdown=0
endif
endif
You are always so helpful 🙂 Thank you again!
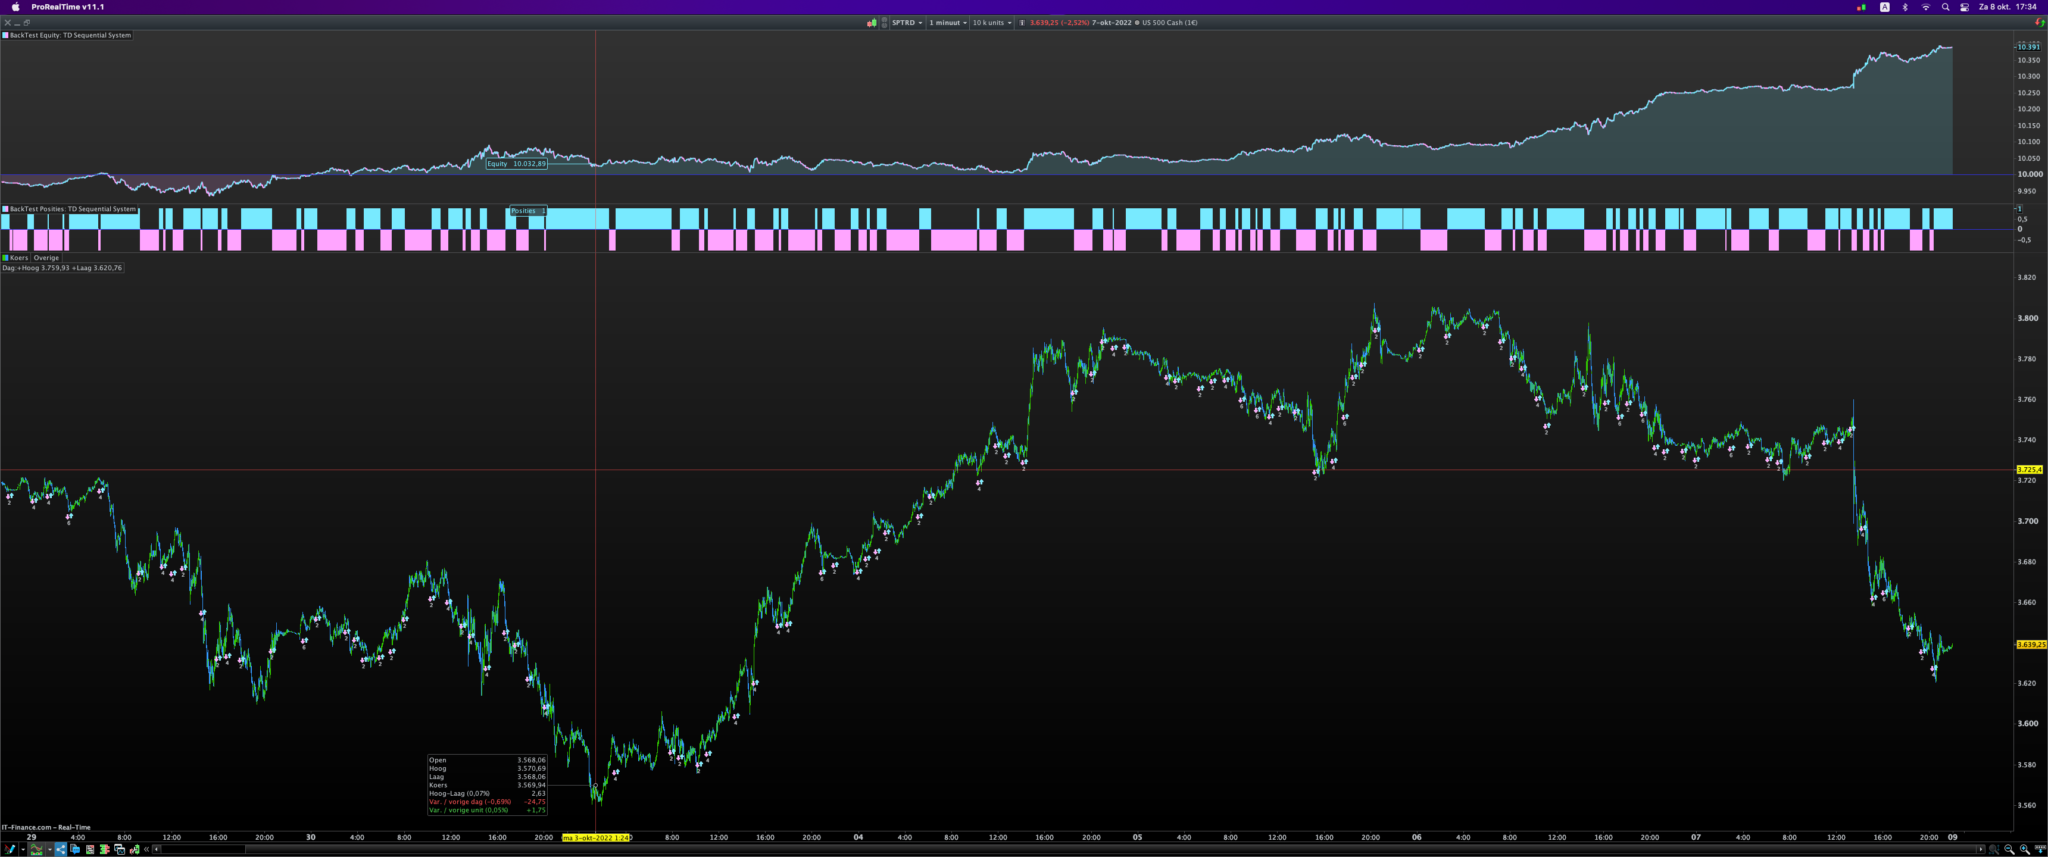
You are always so helpful 🙂 Thank you again! Looks very nice. And, how would that combine with heikin-ashi signals, I mean how would the back test code look like. Looking at the chart looks promising…Apologies, I jus the post was published twice… Sorry for that.
JSParticipant
Senior
Hi
@jonpt88
If you want to use the code with Heikin Ashi, you have to change the following:
Close => HAClose = (Open + High + Low + Close) / 4
Open => HAOpen = (Open[1] + Close[1]) / 2
High => HAHigh = Max(High, Open, Close)
Low => HALow = Low(Low, Open, Close)
Hello JS,
Thank you. I think I should have specified better:
What I meant is that:
Demark bullish signal + first (after demark bullish signal) heikin ashi green candle = buy
Demark bearish signal + first (after demark bearish signal) Heikin ashi red candle = sell
Demark bearish signal + first (after demark bearish signal) Heikin ashi red candle = short
Demark bullish signal + first (after demark bullish signal) heikin ash green candle = close short.
Sorry for a second message in a row.
Meanwhile I tried to combine them as I detailed above but I must be doing something wrong as no result appears… Let me clarify, a lot of times the Demark signal coincides with a bearish HA candle. However, what I want to do is back test of Demark as first condition + HA candle = such condition could take days (in daily chart to confirm) but it does not necessarily means that both conditions occur on the same date. If that make sense.
DefParam CumulateOrders = False
once TDSL=0
once TDSS=0
once BuySetup=0
once SellSetup=0
Once BuyCountdown=0
once SellCountdown=0
if close[1]>close[5] and close<close[4] then
bearishflip=1
bullishflip=0
elsif close[1]<close[5] and close>close[4] then
bullishflip=1
bearishflip=0
endif
if close<close[4] and bearishflip then
TDSL=TDSL+1
TDSS=0
elsif close>close[4] and bullishflip then
TDSS=TDSS+1
TDSL=0
endif
// Heikin Ashi setup
once xOpen = open
xClose = (open + close + high + low) / 4
if barindex > 0 then
xOpen = (xOpen + xClose[1]) / 2
endif
xLow = min(low,min(xClose,xOpen))
xHigh = max(high,max(xClose,xOpen))
//
Bullish = xClose > xOpen
Bearish = xClose < xOpen

//if TDSL>0 and TDSL<10 then
//drawtext("#TDSL#",barindex,low-10*pipsize) coloured(0,255,0)
//endif
if TDSL=9 then
L=(low<low[3] and low<low[2]) or (low[1]<low[2] and low[1]<low[3])
bearishflip=0
TDSL=0
BuySetup=1

if L and (Bullish AND Bearish[1])then
//DRAWARROWUP(barindex,low-20*pipsize) coloured(0,255,0)
Buy 1 Contract at Market
endif
endif
if TDSS>0 and TDSS<10 then
//drawtext("#TDSS#",barindex,high+10*pipsize) coloured(255,0,0)
endif
if TDSS=9 then
S=(high>high[2] and high>high[3]) or (high[1]>high[3] and high[1]>high[2])
bullishflip=0
TDSS=0
SellSetup=1
if S and (Bearish AND Bullish[1]) then
//DRAWARROWDOWN(barindex,high+20*pipsize) coloured(255,0,0)
SellShort 1 Contract at Market
endif
endif
if BuySetup then
if close<=low[2] then
BuyCountdown=BuyCountdown+1
//drawtext("#BuyCountdown#",barindex,low-10*pipsize) coloured(0,0,255)
endif
if BuyCountdown=8 then
Bar8=barindex
elsif BuyCountdown=13 then     // TD Countdown perfection buy
if low<=close[barindex-Bar8] and (Bullish AND Bearish[1])then
//DRAWARROWUP(barindex,low-20*pipsize) coloured(0,0,255)
Buy 1 Contract at Market
endif
BuySetup=0
BuyCountdown=0
endif
elsif SellSetup then
if close>=high[2] then
SellCountdown=SellCountdown+1
//drawtext("#SellCountdown#",barindex,high+10*pipsize) coloured(0,0,255)
endif
if SellCountdown=8 then
Bar8=barindex
elsif SellCountdown=13 then  //TD Countdown perfection sell
if high>=close[barindex-Bar8] and (Bearish AND Bullish[1]) then
//DRAWARROWDOWN(barindex,high+20*pipsize) coloured(0,0,255)
SellShort 1 Contract at Market
endif
SellSetup=0
SellCountdown=0
endif
endif
JSParticipant
Senior
Hi
@jonpt88
Line 26 should be: xOpen = (xOpen[1] + xClose[1]) / 2
Thank you for being always so helpful, JS.
I was going nuts with the code. I have amended as you suggested but unfortunately I get no equity curve at all now… Is the amended you have suggested valid for the idea as follows:
Demark bullish signal + first (after demark bullish signal) heikin ashi green candle = buy
Demark bearish signal + first (after demark bearish signal) Heikin ashi red candle = sell
Demark bearish signal + first (after demark bearish signal) Heikin ashi red candle = short
Demark bullish signal + first (after demark bullish signal) heikin ash green candle = close short.
DefParam CumulateOrders = False
once TDSL=0
once TDSS=0
once BuySetup=0
once SellSetup=0
Once BuyCountdown=0
once SellCountdown=0
if close[1]>close[5] and close<close[4] then
bearishflip=1
bullishflip=0
elsif close[1]<close[5] and close>close[4] then
bullishflip=1
bearishflip=0
endif
if close<close[4] and bearishflip then
TDSL=TDSL+1
TDSS=0
elsif close>close[4] and bullishflip then
TDSS=TDSS+1
TDSL=0
endif
// Heikin Ashi setup
once xOpen = open
xClose = (open + close + high + low) / 4
if barindex > 0 then
xOpen = (xOpen[1] + xClose[1]) / 2
endif
xLow = min(low,min(xClose,xOpen))
xHigh = max(high,max(xClose,xOpen))
//
Bullish = xClose > xOpen
Bearish = xClose < xOpen

//if TDSL>0 and TDSL<10 then
//drawtext("#TDSL#",barindex,low-10*pipsize) coloured(0,255,0)
//endif
if TDSL=9 then
L=(low<low[3] and low<low[2]) or (low[1]<low[2] and low[1]<low[3])
bearishflip=0
TDSL=0
BuySetup=1

if L and (Bullish AND Bearish[1])then
//DRAWARROWUP(barindex,low-20*pipsize) coloured(0,255,0)
Buy 1 Contract at Market
endif
endif
if TDSS>0 and TDSS<10 then
//drawtext("#TDSS#",barindex,high+10*pipsize) coloured(255,0,0)
endif
if TDSS=9 then
S=(high>high[2] and high>high[3]) or (high[1]>high[3] and high[1]>high[2])
bullishflip=0
TDSS=0
SellSetup=1
if S and (Bearish AND Bullish[1]) then
//DRAWARROWDOWN(barindex,high+20*pipsize) coloured(255,0,0)
SellShort 1 Contract at Market
endif
endif
if BuySetup then
if close<=low[2] then
BuyCountdown=BuyCountdown+1
//drawtext("#BuyCountdown#",barindex,low-10*pipsize) coloured(0,0,255)
endif
if BuyCountdown=8 then
Bar8=barindex
elsif BuyCountdown=13 then     // TD Countdown perfection buy
if low<=close[barindex-Bar8] and (Bullish AND Bearish[1])then
//DRAWARROWUP(barindex,low-20*pipsize) coloured(0,0,255)
Buy 1 Contract at Market
endif
BuySetup=0
BuyCountdown=0
endif
elsif SellSetup then
if close>=high[2] then
SellCountdown=SellCountdown+1
//drawtext("#SellCountdown#",barindex,high+10*pipsize) coloured(0,0,255)
endif
if SellCountdown=8 then
Bar8=barindex
elsif SellCountdown=13 then  //TD Countdown perfection sell
if high>=close[barindex-Bar8] and (Bearish AND Bullish[1]) then
//DRAWARROWDOWN(barindex,high+20*pipsize) coloured(0,0,255)
SellShort 1 Contract at Market
endif
SellSetup=0
SellCountdown=0
endif
endif
I get no equity curve at all now
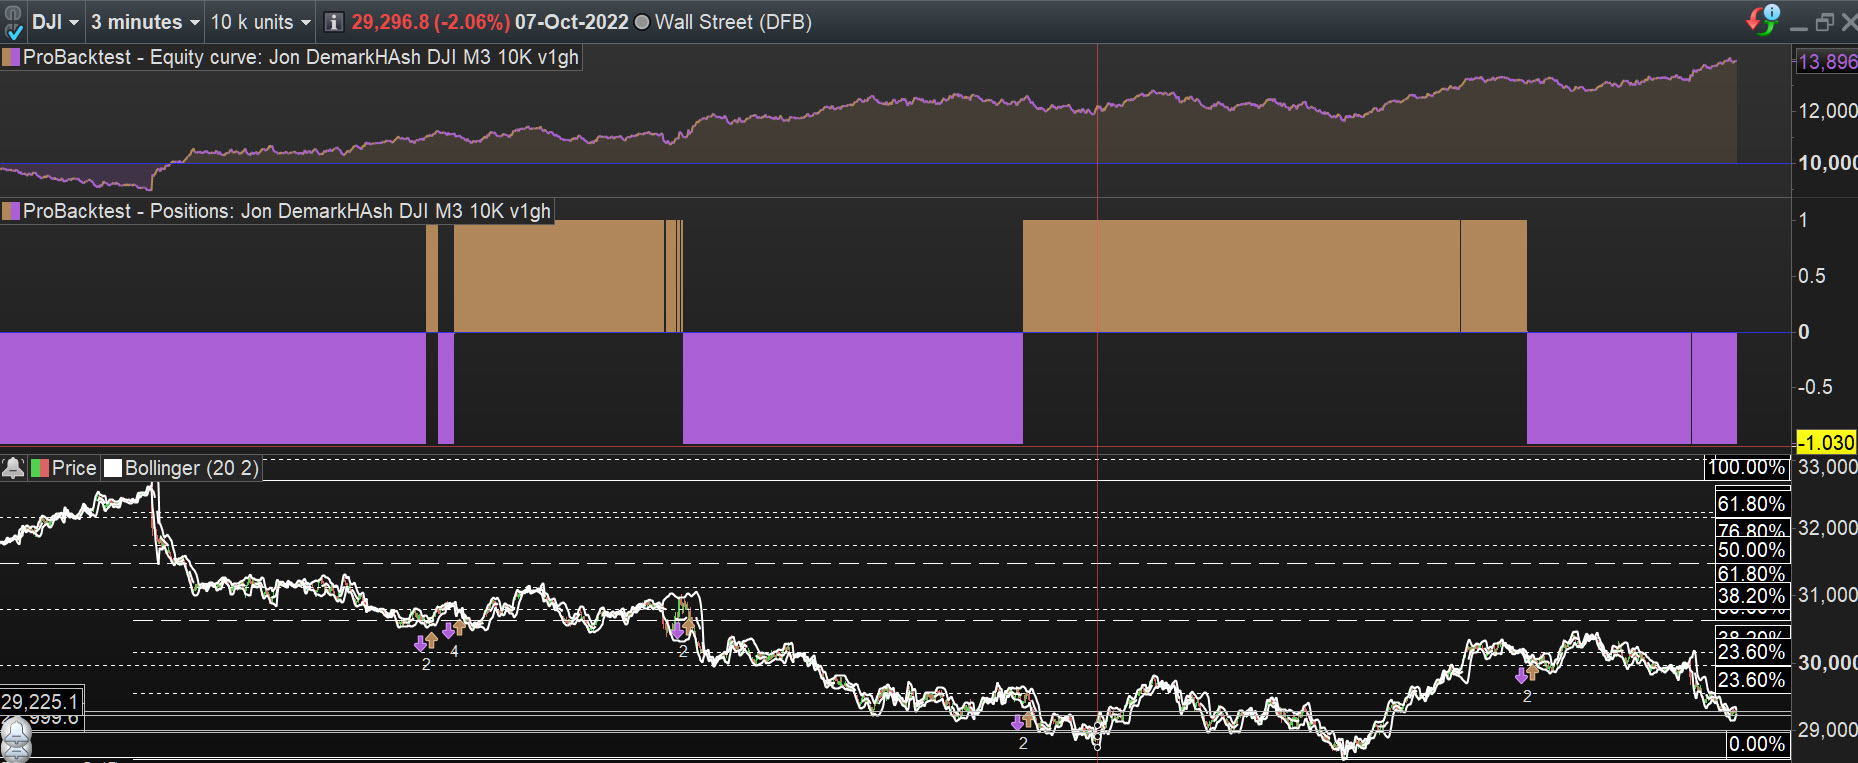
You don’t state an Instrument or a Timeframe (?), so attached is what I get (with code posted above, no changes) on DJI over 10K bars, TF = 3 min, spread = 5
Hi Grahal,
Thank you for your participation and helpful reply. The equity curve does look promising, indeed.
Unfortunately, I do not get results. I must be doing something wrong. Would you be so kind to post the entire code that you are using?
That would be very much appreciated.
Thank you in advance,
Also I have tried to edit the post and include further comments, but suddenly it was to late and hence I need to write a second post. Meanwhile, I manage to also get an equity curve. However, I am unsure if the strategy is following the following logic:
Demark bullish signal + first (after demark bullish signal) heikin ashi green candle = buy
Demark bearish signal + first (after demark bearish signal) Heikin ashi red candle = sell
Demark bearish signal + first (after demark bearish signal) Heikin ashi red candle = short
Demark bullish signal + first (after demark bullish signal) heikin ash green candle = close short.
—
As said, first signal as a condition of the second signal and not necessarily simultaneously.
Enter exact like this, at bottom of strategy code … GRAPH LongTriggered … then click on Backtest and you check if conditions for a Buy have occured correctly.
Let us know how you get on.
Thanks, Grahal: To recap:
Only small time frames work. No daily time frame.
I think this why: the long / short etc are triggered only when e.g. green HA coincides with Demark bullish.
Nevertheless, the idea is that: first Demark Bullish (as first condition), and then once the HA is green – to trigger the long position. Following this logic –> once the bearish demark (first condition), and once the red heikin ashi to trigger the close and short position, and so on. Instead, from what I see that is not what the code is doing. I read somewhere that to supedite one condition to the other one needs to create a “flag”(?), this exceeds by far my skills (which aare nill -I am total beginner – I am a pre-beginner… I am 0 at this. I did not even understand the flag idea on the training video :(.
Thank you for your understanding and help, of course, only if you deem that I can receive it.
I’m not the best at coding, but I manage to do all I require for myself as I can check it out by backtesting and checking using GRAPH etc.
Above can be time consuming and is best undertaken by the code Author or somebody convinced it is worth the time … i.e. going to make money at the end of all the analysis.
from what I see that is not what the code is doing
You can safely assume that the code will correctly execute as it is correctly written.
GRAPH LongTriggered
Did you do above?
You can then set up the Indicators which are used in the code in order to check it all works as it should.
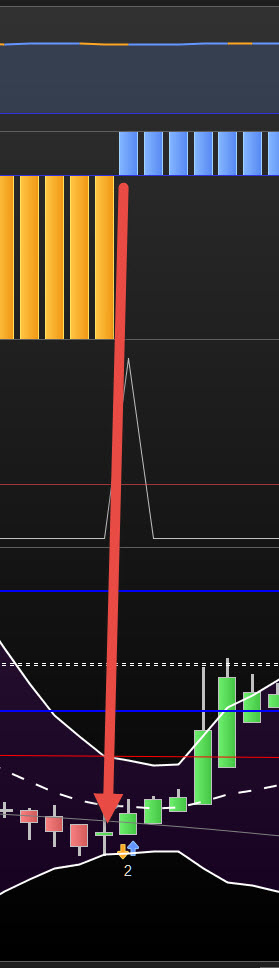
Here you are, I’ve got you started as to how to do it … see attached! The red arrowhead is pointing at a 1st green HAshi candle following red HAshi candles.
You now set up as attached and also set up the
first Demark Bullish (as first condition)?