thanks for your responses GraHal + Vonasi. The question really is WHY is not done already? , I mean PRT know that spreads vary all the time on different instruments, so why has this just been left like that and we – the retail client – have to ‘suggest’ it to them.
Really, it makes me think there is some kind of Agenda here tbh – that agenda being to ensure retail traders do not have important meaningful info in front of them – that way they lose. Lets not forget that PRT has a r’ship with IG.
Oscar
PRT can only display whatever data is provided to them. If the broker (IG) do not provide historical tick by tick data of spreads then PRT can not provide it to us for back testing.
IG do provide time bands (over 24 hour period) and associated spreads so PRT could have 3 boxes for us to input the 3 x IG spreads … this would go some way to reduce our current disadvantage as PRT users / customers.
Okay we know that spreads can still girate wildly outside of the above 3 bands at times of wild volatility / unexpected News etc, but 3 boxes / 3 bands would be a practicable step in the right direction towards a solution.
@ GraHal
Yes that’s required 3 boxes or just inputting a number of times and spreads. I have asked IG in the past whether they have historical data about the spreads and importantly when they change (i.e. Volatile times) and their answer was ‘no’. I mean again, why is this info not recorded by them ? Its highly relevant when BT’ing. If the spread suddenly jumps from say 8 pts OOH’s to say 30 pts (like on the gbp/jpy pair the other day) I need to know about that – otherwise BT does not tell me that I got ‘pulled’ into a trade because of that very large spread at that time OR indeed my Algo got rejected by them as the pending order was ‘too close’.
What is REALLY needed here is for IG and the like to post ALL spread data for all instruments for people to view at any time, so if the spread between 1.30am and 1.55am goes to 35pts we KNOW about that. What you should then be able to do is IMPORT this genuine live data into the PRT platform – you will now have absolutely TRUE spread data incorporated, and know that the BT results are 100% accurate for spread data – one of the most important variables. You could even know from that BT data, the amount of times your Algo is ‘rejected’ by the broker, because for example your pending order is too close to the market price. Again this would be a very useful metric – as a lot of people, inc. me initially were not aware that a change in the market conditions would mean many times that your Algo was ‘rejected’ you then have to manually put it back ‘on’. This happened again on the GER 30 with IG the other night .
Oscar
IG do publish spread and time bands for all, for example …
https://www.ig.com/uk/help-and-support/spread-betting-and-cfds/fees-and-charges/what-are-igs-indices-spread-bet-product-details
Below the overview page requiring you to click on the … See full product details … under each category as you require
https://www.ig.com/uk/spread-betting-cfds-charges
If the spread suddenly jumps from say 8 pts OOH’s to say 30 pts (like on the gbp/jpy pair the other day) I need to know about that
Spread jumps similar to above, often occur only for a few milliseconds so IG cannot let us know / publish such brief occurrences.
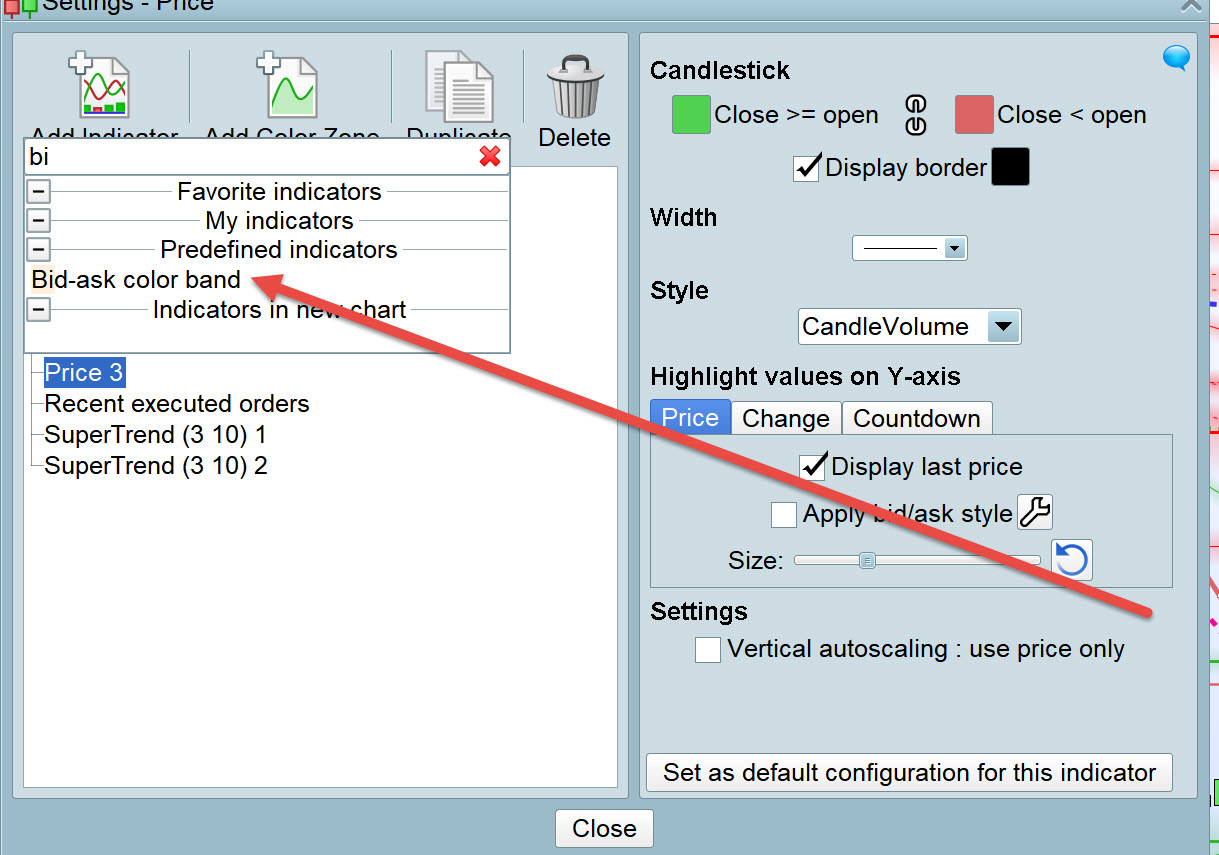
Add the Bid-Ask Color Band – as an Indicator on your Charts – and you will see the few millisecond widening of spread.
EDIT / PS
Read my previous post for IG Spreads data source.
Being able to set different spreads for different times would be an excellent feature.
@OSCARDAX I can assure you data import by users will never happen on platform like PRT – it would destroy platform data integrity.
As a related side there are limitations with the IG API for customers when it comes to historical data but in our case with PRT it could or should be different. I bring up the limitations because I don’t believe IG would provide this data to clients and I’m sure I’ve tried to get access with no success. Also I think IG spread data varies depending on what platform you are using PRT, (maybe MT4) and their level 2 platform or whatever it is called have different spreads. I’m not aware of any brokers that provide historical spread data in a meaningful way except for maybe dukascopy? Oanda has a graph of spread data.
PRT can only display whatever data is provided to them. If the broker (IG) do not provide historical tick by tick data of spreads then PRT can not provide it to us for back testing.
I don’t agree with @Vonasi’s above statement because IG “provides” spread data in realtime on their platform furthermore spread is always the difference between the Bid/Sell AND Ask/Buy value. The question should be: can PRT use and store it, and/or add this much needed feature of spread time variation?
@Grahal
That particular incident i.e. 30 pt spread on the beast, was no ‘few milliseconds’ it was actually about an hour ! I will look at your colour bar indicator when I have time. Thanks
@ David- yes I agree fully with your comments I mean the bid/ask data is there for PRT to use and store, so I cannot see any tech reason why t his cannot be done tbh. What I am saying is that this crucial data when it alters – even for a few seconds, we should not just be made aware of it live : It should be available in BT format. If for example I was looking at 2 years of back test data and I knew that the spread – even if for half a second – suddenly jumped 16 times over that 2 years, I may also know how many times my Algo would stop over that 2 year period and the all important implications of that to me as a trader. And certainly if the spread jumps up way above the ‘guidline’ spread for say half an hour I should certainly know this and the implications of backtest and results i.e. I could be stopped out or ‘pulled into’ trades because of this now far larger spread than what I have calculated from the brokers standard guideline.
I don’t agree with @vonasi‘s above statement because IG “provides” spread data in realtime on their platform furthermore spread is always the difference between the Bid/Sell AND Ask/Buy value. The question should be: can PRT use and store it, and/or add this much needed feature of spread time variation?
For a daily strategy we would be backtesting on decades of historical data. For IG to provide PRT with decades worth of historical tick by tick spread data for every instrument available would be a mammoth task with little benefit in it for IG. Yes PRT could start storing live spread data from today onwards for us to use in the future but I think that we would all be dead long before it was a useful database for us to use – maybe an idea for our grandchildren!
@ Vonasi, I am not sure why you want decades of historical data – although if I am correct from your regular posts you like to go back 10-20 years ! I just cannot see the point of this, bearing in mind market structure changes every say 18-24 months likely anyway. Finding something – and I am not sure if you discretionary trade or algo trade – not that it makes a difference I guess that has been successful for 10 years must nigh on be impossible, I certainly would not trust that data : especially on PRT BT for sure. The further you go back the more errors there are bound to be – that the BT just do not show! And even if its worked well for 10 years it could stop working tomorrow – just as much probability as a strategy thats BT for 3 years well. I believe when you trade an auto strategy – which I want to only do – you MUST be prepared to be able to ‘fix it’ when it goes wrong. This is obviously the ‘no easy answer problem’. For me going back this far – 10 years plus – means you are searching for some ‘almost’ perfect strategy that delivers profits all the time – with some drawdowns – but generally always ‘works’. Lets say a strategy has been working well for the last 3 years but the 2 prior years it made losses – do we not trial that because only 3 latest years have ‘worked’ well? IMHO certainly I would trial ‘live’ a strategy like that as it could deliver me another 3 years of profit…This is a bit ‘off the subject’ but….
Worth mentioning for the discussion …
If we Backtest on a Daily TF then 20 years is only 7300 bars … so we’d have to go back 20 years min, longer the better?
@ Vonasi, I am not sure why you want decades of historical data – although if I am correct from your regular posts you like to go back 10-20 years ! I just cannot see the point of this, bearing in mind market structure changes every say 18-24 months likely anyway.
You answered your own question regarding the point of this. Market structure regularly changes so if we test on only a short period we increase our chance of curve fitting to that short periods market structure type. If we test over a long period then we will most likely see far more different types of market structures and see how robust our strategy is with coping with them all. We will see how our strategy copes entering recessions and exiting recessions. We will see how it reacts in volatile sideways markets and smooth trending markets. Seeing a strategy trade in so many different structures will tell us a lot about the strategy. Personally I ignore any data before the mid 90’s as the use of computers from around this point onwards had a major effect on mark behaviour but otherwise the longer the test period the better – more data is better than less data but ultimately it is all irrelevant as 2018 is showing us!
If we Backtest on a Daily TF then 20 years is only 7300 bars
Actually it is far less. 6 candles for every week times 52 = 312 times 20 years = 6240. Take out the holidays and it is even less probably somewhere around 6120.
Hahaha and I even got my calculator out to (incorrectly) arrive at 7,300! 🙂
In 2019 the NYSE will be open 251 days so 20 years is about 5020 Daily Bars (for a 5 day trading week).
(Are you back on board now Vonasi?? I guess you be painting the hull before you get it wet again??)
I’m a full time developper and most of the trading platforms backtester I know doesn’t have any spread changing capability other times.
Bear in mind that PRT has not been developed specifically to be used by IG customers.
But I agree on the fact that it reduces backtests accuracy with this couple broker/instrument.