Zac
ZacParticipant
Average
Hi,
I have no coding experience and would appreciate some guidance on how to create what I hope is a relatively simple indicator.
I want to use an ATR value calculated from the D1 timeframe and display the upper and lower bounds of that range dynamically on an H1 chart. So if a 20 period ATR value from the D1 timeframe is 100 points and the market sells off 50 points from where the trading day started then then the intraday lines need to adjust downwards accordingly.
I have an MT4 .ex4 file but not the source code. I can’t stand the MT4 platform but really would like to replicate this indicator.
All advice gratefully appreciated.
Thanks, Zac
In order to recode this MT4 indicator to prorealtime and since the source code is not available, do you have some examples and/or other information about how this indicator is coded? Thanks.
ZacParticipant
Average
Thanks for the reply Nicolas.
Unfortunately I don’t know how it was coded. I did however find this thread: https://www.prorealcode.com/topic/showing-customized-daily-indicators-in-smaller-timeframes/
It looks as if https://www.prorealcode.com/user/xerxes/ has done some of the coding already. I’m hoping I will be able to remove the pivot point code and make the ATR element work.
Fingers crossed.
ZacParticipant
Average
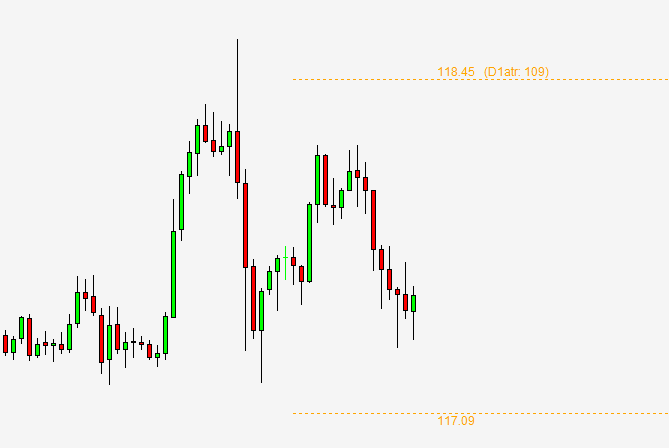
What I am trying to build is shown in the attached image. The picture is of a 1H chart (USDJPY today). The yellow lines are what I want to recreate. You can see the Upper line shows that the 20 period ATR taken from yesterday’s complete daily candle is 109 (D1atr=109).
The upper and lower lines are plotted dynamically. The Upper line is LOD + 109 value and the and Lower line is HOD – the same 109 value. The ATR might be a bit of a red herring insofar as it is there purely to provide the baseline number from which to calculate the position of the two yellow lines.
I’ve made an effort at coding. I’m surprised to find that it works but not quite as I’d like.
Any help in moving it from what it is now towards the attached image would be gratefully received.
The first question is how do I lock down the ATR value to only come from yesterday’s D1 candle? This needs to be static.
Secondly, how do I get two lines to plot like the image rather than the lines I currently have?
Thanks in advance, Zac
//Establishing ATR value from yesterday's completed daily candle
ATRvalue=AverageTrueRange[20](close)

//Upper & Lower ATR lines
ATRu=Low+ATRvalue
ATRl=High-ATRvalue

Return ATRu COLOURED (0, 0, 255), ATRl COLOURED (255, 0, 0)
 fab
fabParticipant
New
Looking for the exact same thing Zac, I think an issue with prt and only displaying the daily atr data is that once the timeframe is changed it will pull the current data for the indicator and not keep the daily. I’m no coder but can see this being a stumbling block with prt for this daily atr. Did you have any luck finding it?
If anyone can help its a very handy visual to know where the daily ATR lands on each day, help is appreciated
cheers
ZacParticipant
Average
Hi fab,
Yes, it is an amazingly helpful indicator. Fortunately Nicolas was kind enough to create some code. You can find it in this thread: https://www.prorealcode.com/topic/code-conversion-neededi/
I still don’t really get the multi time frame issue. In this case all we need is the ATR value calcualted from the Daily timeframe. That’s just a number. I would have thought a mathematical formula could be used to generate an output value and then take this value and generate the two indicator lines from it.
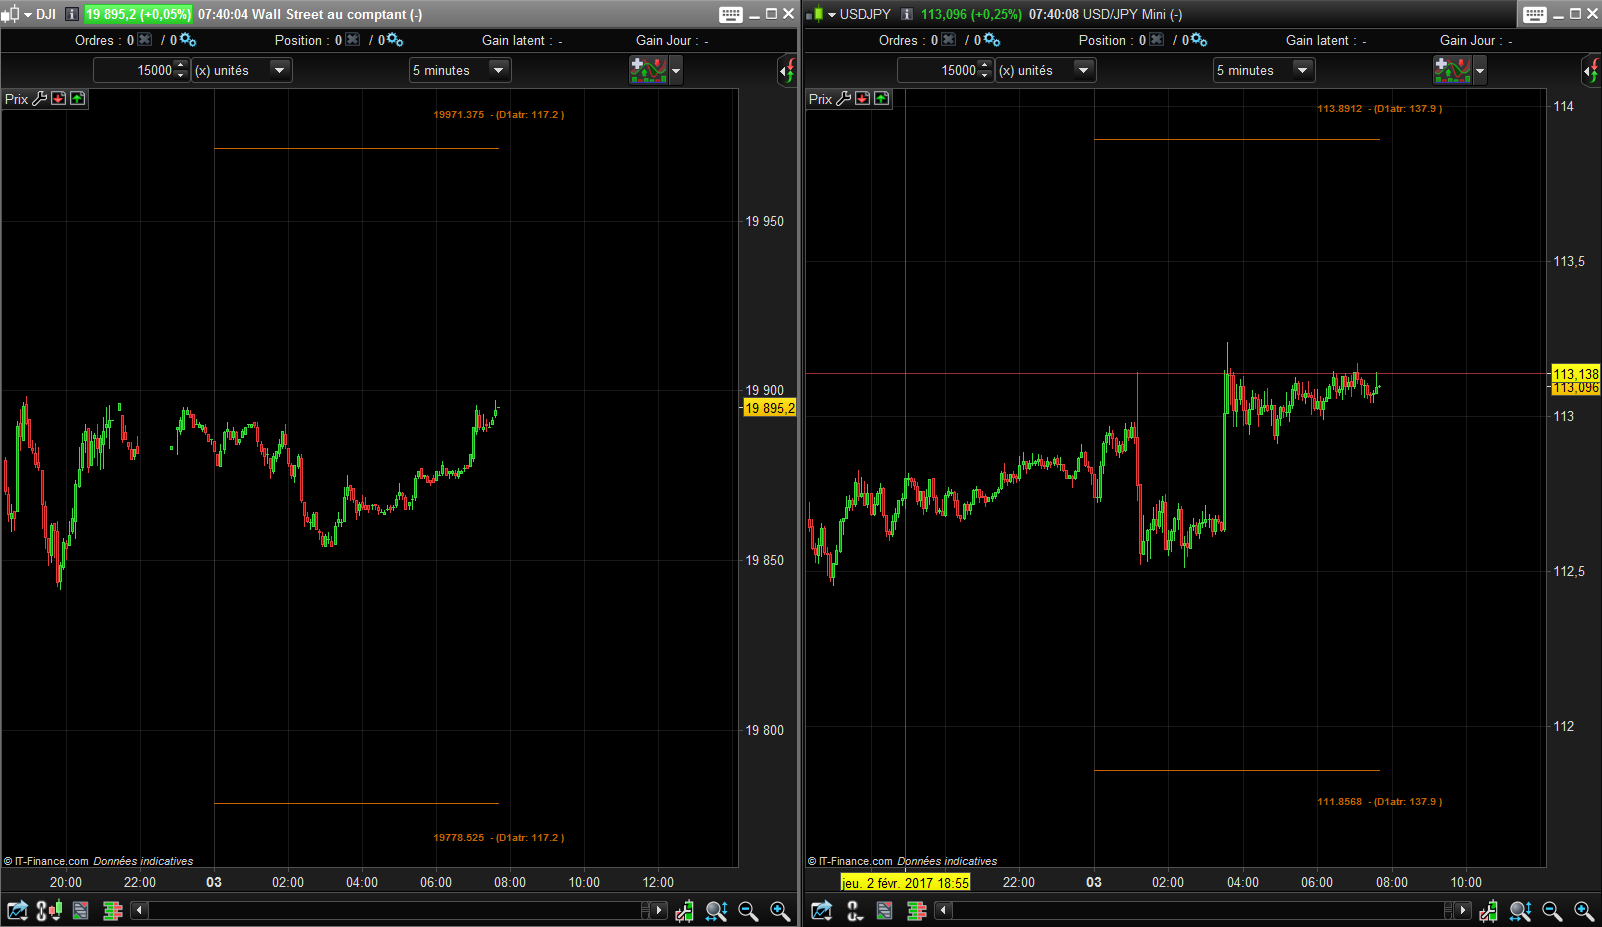
Anyway, the workaround here gives values that are close but they are not completely accurate. Whether they are close enough remains to be seen. Until IG to move over to the latest version I can’t run the code on my trading platform. In the meantime I have a screen running MT4 so I can see the ATR range across the pairs I trade. I intend to run MT4 and PRT side by side for a while to see whether the accuracy is sufficient for my needs.
Good luck.
fabParticipant
New
Zac.. I see its called the ledge atr. I know where I’ve heard that before lol. its a small trading world:)
Have tried the code on the other page, I get syntax errors. I’ll guess that’s because I’m running prt 10.2 with IG.
Will keep drawing it by hand until they upgrade to 10.3 and I can give it a proper test
I’d like to be part of this “small trading world” too 🙂
Where have you heard of ledge ATR? How do you use it in intraday trading?
ZacParticipant
Average
It’s an indicator someone coded for Tom Dante. He has it for MT4 on his website.
I use the indicator for a few different things but the major benefit is as a simple trade filter. I can instantly identify on an intraday chart whether price is extended or within a normal range for the day.
fabParticipant
New
What Zac said 🙂 Get on twitter Nic, you can’t swing a cat without hitting a trader on here, lol
Appreciate your code, many thanks. testing it out now.
fabParticipant
New
Unsure what’s happened, but the 20ATR for cable should be 125-128 current day or prior day
But the indicator is 149. what are you guys seeing?
cheers
fab
For everyone benefit, the indicator has been posted to the library : daily ATR displayed on intraday chart
Today I got 146.7 pips for GBPUSD.